Смотри обучающее видео по маркету на YouTube
Как купить торгового робота или индикатор
Запусти робота на
виртуальном хостинге
виртуальном хостинге
Протестируй индикатор/робота перед покупкой
Хочешь зарабатывать в Маркете?
Как подать продукт, чтобы его покупали
Технические индикаторы для MetaTrader 4 - 15

Future Trend Channel – это динамичный и визуально интуитивный индикатор, предназначенный для определения направления тренда и прогнозирования потенциальных движений цены. Первоначально разработанный ChartPrime для TradingView, этот инструмент был адаптирован для MetaTrader 4, предлагая трейдерам аналогичный функционал. Независимо от того, являетесь ли вы свинг-трейдером, дей-трейдером или долгосрочным инвестором, Future Trend Channel помогает визуализировать силу тренда, предвосхищать развороты

Введение в Harmonic Pattern Plus Индикатор Harmonic Pattern Plus, предназначенный для работы в MetaTrader 4, ищет гармонические модели на графике. Программа Harmonic Pattern Plus предназначена для определения точек разворота текущего тренда - она находит гармонические модели с высокой силой прогнозирования. Гармонические модели состоят из нескольких линий, объединенных важными соотношениями Фибоначчи, такими как 0,618 и 0,382, которые часто используются профессиональными трейдерами для измерения

Powerful non-repainting tool for intraday or swing tading, part of the Power Lines Trading System, used in real trading on a daily basis with proven solid trading signals. The Power Lines indicator is pretty straightforward and easy to set up and can be used perfectly on every timeframe and with every currency pair or other financial instrument. For intraday trading the using of M5, M15 or M30 timeframes and for swing trading H1, H4 or D are recommended. Avoid M1 and be careful with M5 timeframe
FREE

CS ATR FIBO CHANNELS MULTI TIMEFRAME
Additional tool to trade with Cycle Sniper Indicator.
Cycle Sniper : https://www.mql5.com/en/market/product/51950 Indicator Draws Channels based on: - Cycle Sniper Price and Moving Averages - ATR Deviations - Fibonacci Retracement and Extensions
Features: - Multi TimeFrame - Full alert and Notification options. - Simple Settings - Finds the trend change or extreme reversals.
Inputs: - Arrow Mode: ATR Levels or Median Line If Median Line is selected ind

Индикатор ACB Trade Filter отфильтровывает маловероятные торговые сигналы в торговой стратегии. Продукт использует сложный алгоритм фильтрации на основе рыночных настроений и трендов.
Заявки Хорошо сочетается с другим нашим индикатором ACB Breakout Arrows . Отфильтровывает маловероятные сигналы любого индикатора. Избегает слишком частых сделок и минимизирует убытки. Торгует в направлении рыночных настроений. Хорошо справляется с волатильностью.
Инструкция по применению Покупайте, если гистогра
- Real price is 80$ - 60% Discount (It is 30$ now) - It is enabled for 1 purchase. Contact me for extra bonus tool, instruction or any questions! - Non-repaint, No lag - I just sell my products in Elif Kaya Profile, any other websites are stolen old versions, So no any new updates or support. - Lifetime update free
Introduction Smart Money Concepts (SMC) strategy was initially popularized the Inner Circle Trading (ICT) method which is claimed to be the evolved version of the SMC. Essenti

See RSI values turned into colored candles
This indicator provides both colored candles and a colored moving average. 6 drawaing styles are provided to allow customization of the color coding.
Applying coding to the chart may help in conceptualizing price trend and impulse movements defined through RSI values.
Features - optional colored candles - optional colored ma - 6 draw styles; RSI slope RSI above/below overbought/oversold levels RSI above/below level 50 RSI above/below it's moving average
FREE

Smart Fibo Zones are powerful, auto-generated Fibonacci Retracements that are anchored to key market structure shifts . These zones serve as critical Supply and Demand levels, guiding you to identify potential price reactions and confirm market direction. Fibonacci calculations, widely used by professional traders, can be complex when it comes to identifying highs and lows. However, Smart Fibo Zones simplify this process by automatically highlighting order blocks and key zones, complete with St
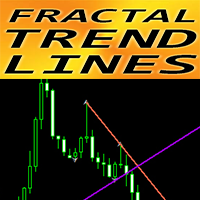
Индикатор Crypto_Forex "Fractal Trend Lines" для MT4.
- Этот индикатор отлично подходит для трейдеров, которые используют графический анализ с прорывами!!! - "Fractal Trend Lines" показывает графические линии восходящего тренда (фиолетовый цвет) и нисходящего тренда (красный цвет). - Линии восходящего и нисходящего тренда строятся на 2 ближайших соответствующих фракталах. - Индикатор имеет несколько параметров, отвечающих за цвет и ширину линий тренда. - Индикатор имеет встроенное оповещение д
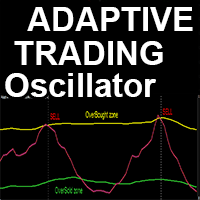
Продвинутый пользовательский индикатор Crypto_Forex "Adaptive Trading Oscillator" — эффективный вспомогательный торговый инструмент для MT4!
— Этот индикатор относится к новому поколению осцилляторов — смотрите изображения, чтобы узнать, как им пользоваться. — "Adaptive Trading Oscillator" имеет настраиваемые адаптивные зоны перепроданности/перекупленности. — Этот осциллятор — вспомогательный инструмент для поиска точных точек входа в сделку при выходе из динамических зон перепроданности/перек
40% off. Original price: $50
Moving Average Trend Scanner is a multi symbol multi timeframe triple MA crossover dashboard that helps traders to monitor, and identify potential market trends from one chart. This panel scans 3 moving averages in up to 28 configurable instruments and 9 timeframes for triple moving average alignment and moving average crossover with a deep scan feature to scan all market watch symbols (up to 1000 instruments!).
Download Demo here (Scans only M1 and M5) Settings

Trend Lines Cross This indicator will alert you on any cross of a Trendline. You can draw up to two trend lines and form a channel, a pennant , a triangle or a simple trend and when the price crosses either trend line the indicator will provide you with alerts that you define plus an up or down arrow when the cross happened. How to: Draw the 1st trendline and name it tl1. Draw the 2nd trendline and name it tl2. Select which type of alerts you would like in the indicator properties and you a
FREE

Этот индикатор служит для визуального представления Дончианского канала на вашем торговом графике. Дончианский канал - это простой технический инструмент, используемый для изображения диапазона между самыми высокими и самыми низкими значениями за определенный период. Этот индикатор улучшает визуальный анализ движения цен, предоставляя понимание потенциальных точек прорыва и продолжения тренда. Дончианский канал может быть применен как к текущему временному интервалу, так и к более высокому, если
FREE
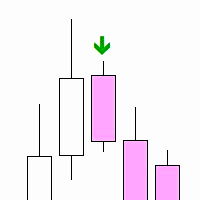
"Inside Bar PA" – это технический индикатор, разработанный для определения внутренних баров на графике. Внутренний бар – это бар или свеча, максимум и минимум которой полностью содержатся в предыдущем баре. Это может сигнализировать о потенциальном развороте или продолжении тренда, в зависимости от контекста. Особенности: Автоматическое обнаружение внутренних баров. Визуальная отметка внутренних баров стрелками на графике. Возможность настроить расстояние отметки от бара. Как использовать: Прикр
FREE
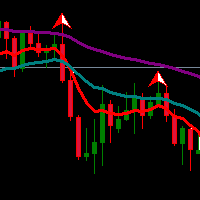
Exponential Moving Average (EMA) is an indicator that often be used by traders. Combination of two or three EMA indicators often applied to determine trend direction. Multiple EMA combined with fractals or oscillator indicator to detect overbought/oversold and divergence point also great to do in trading system.
If you like EMA indicator and want to get better indicator, highly recommended using EMA SuperTrend Strategy Indicator if you want to get better result in here:
https://www.mql5.com/en
FREE

RSI DIVERENCE INDICATOR
RSI divergence is very powerful pattern which is often used to detect a strong trend reversal. it also indicates the weakening of strong signal. So some traders want to use it as the exit criteria. This indicator works in all timeframe and send notification, alert or email to the user. It also show the Higher Highs and Lower Low Pattern with its corresponding RSI divergency. This indicator can be used in Expert Advisors as it has accessible buffers List of Inputs ______
FREE

Индикатор SPV Volatility - один из самых эффективных фильтров. Фильтр по волатильности. Показывает три варианта волатильности. Так называемый лимитный, реальный,и последний самый эффективный для фильтра - процентный фильтр. Процентное отображение фолатильности показывает отношение лимитной волатильности к реальной. И таким образом если мы торгуем в середине канала, то необходимо ставить условие чтобы процентный показатель был меньше определенного значения индикатора. Если мы торгуем на пробой к

This indicator tool provides mini charts, with adjustable symbol/tf that can be dragged into place. Lightweight operation with multiple mini charts are supported.
Chart features: adjustable symbol and tf draggable multiple mini charts color styling and font sizing, foreground/background colors candle coloring candle styles; candles, bars, line, high-low channel
zoom in/out
FREE
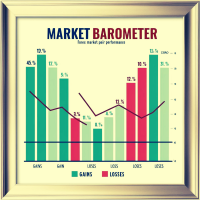
Market Barometer is a cheat code for trading, it acts as a "barometer" for market sentiment across various pairs, showcasing their changes. You can tell right away what to trade. You can trade trends or reversals. MT5 Version: https://www.mql5.com/en/market/product/127467 Market Barometer is a powerful tool designed to track and visualize the percentage changes across multiple currency pairs. By analyzing the price shifts of different forex pairs, it helps you understand how they are correlat
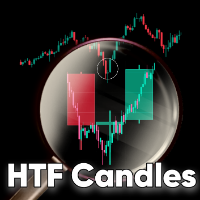
HTF Candles MT4 is a mt4 indicator which plots the outline of the higher time-frame candles on the lower candle, including any MT5 higher time-frame chosen. The indicator gives you the option to choose whether or not to view live current HTF candle, with no lag or repainting. Features MT5 Period Candles: This indicator plots any mt5 time-frame candle e.g m3, m5, m12, m15, m20... and so on, on the lower time-frame. Heiken Ashi Options: You have the option to view the HTF Heiken ashi instead of

Индикатор предназначен для обнаружения высоковероятностных моделей разворота: двойная вершина/дно с ложными прорывами . Представленное видео показывает максимальную производительность индикатора. Под максимальной производительностью подразумевается прибыль, которую можно было бы получить при выходе из каждой сделки на оптимальном ценовом уровне. Разумеется, этого нельзя достичь в реальных торговых условиях, когда будущее движение цены неизвестно. Но в видео показано, что необработанные сигналы и
Gold Trend M1 - Optimized Scalping Tool for Gold (XAUUSD) Gold Trend M1 is a high-frequency trading indicator for the MetaTrader 4 platform, specifically optimized for the M1 timeframe on the Gold market. It combines a powerful SuperTrend trend filter with buy/sell signals derived from Heiken Ashi calculation logic, helping traders identify precise and disciplined entry points for optimal trading performance.
Key Features Optimized for M1 Scalping: Specifically developed for high-speed scalping
ICT Template Indicator visualizes and automatically updates all important ICT elements for Scalpers, Day and Swing traders. It allows you too keep your chart clean and bring any elements by just one click to the side buttons. Thanks to mobile notifications on external liquidity levels, you will not miss any opportunity and you don't have to sit behind the screens whole day. Each element has fully customizable colours, width, line types, max timeframe to be shown etc... so you can really tweak y
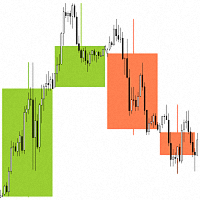
"Candlesticks MTF 4" информационный индикатор, который отображает "Японские свечи" . Индикатор анализирует и определяет время открытия и закрытия свечей из более старших таймфреймов.
Для индикатора "Candlesticks MTF 4" разработан алгоритм, корректирующий несоответствие времени открытия и закрытия свечи с большего таймфрейма. Например, если время открытия свечa на недельном таймфрейме приходится на 1-е число месяца, а на меньшем таймфрейме эта дата приходится на Субботу, то без данного алгоритма
FREE
Индикатор находит низкий, высокий, экстремальный объем на основе заданных коэффициентов и окрашивает их в указанные цвета. Он подменяет стандартную функцию рисования объемов в терминале metatrader. Свечи также могут быть окрашены в цвет объема. На свечах с экстремальным объемом определяется максимальный горизонтальный объем (cluster/POC). В зависимости от своего местоположения (толкающий, нейтральный, останавливающий) кластер также имеет свой собственный цвет. Если кластер находится в тени, а с
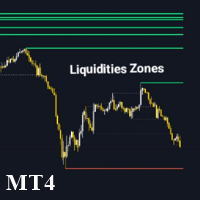
Liquidity Zone Detector — это продвинутый технический индикатор, разработанный для выявления и выделения ключевых зон ликвидности на рынке с использованием индикатора ZigZag. Этот инструмент определяет ценовые уровни, на которых, вероятно, сосредоточена значительная ликвидность, с помощью построения трендовых линий на максимумах и минимумах, определённых ZigZag. Liquidity Zone Detector помогает трейдерам обнаруживать потенциальные зоны разворота или продолжения тренда на основе накопления или вы
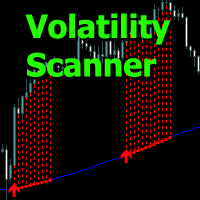
Volatility Scanner - индикатор анализирует состояние рынка и линиями гистограммы показывает зоны повышения волатильности.
Индикатор позволяет определить моменты для входа и удержания позиций, работать в трендовом направлении или когда переждать время без торгов.
Входные параметры позволяют самостоятельно настроить индикатор для нужного торгового инструмента или тайм-фрейма.
Любые Тайм -фреймы для использования от минутного до дневного.
Имеется несколько типов оповещений.
Все сигналы индикатора
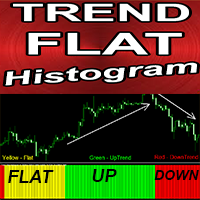
Индикатор Crypto_Forex "Гистограмма трендового флета" для MT4, без перерисовки.
- Индикатор гистограммы трендового флета очень чувствителен и гораздо эффективнее любых стандартных скользящих средних. - Он предназначен для отображения текущих рыночных условий: флета, восходящего и нисходящего тренда. - Индикатор имеет 3 цвета: жёлтый для флета, красный для нисходящего тренда и зелёный для восходящего тренда (цвета можно изменить в настройках). - С оповещением на мобильных устройствах и ПК. - Эт
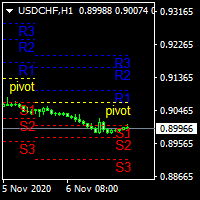
.................................if you need pivot point s levels............................... ............................this is a daily pivot point level creator........................... ...it is for daily pivots and show levels at times period H4 , H1 , M30 , M15 ,M 5... .................................also shows levels for 3 last days.............................. ................can use it with other indicators and see important levels...............
FREE

CustomMultiBarFractal Indicator Description
Overview The CustomMultiBarFractal indicator identifies and displays fractal patterns on price charts. Fractals represent significant price reversal points that can serve as signals for trading strategies.
Key Features - Detects fractals based on a user-defined analysis period - Displays upper and lower fractals with customizable colors - Allows offset adjustment from price extremes - Provides flexible visualization settings - Support
FREE

VWAP and Moving Average A combination of Supertrend and Moving Average to create a converging trade setup Input parameters: signal mode: set it to true if you want to plug it into STAT (Signal Tester and Trader) arrow shift: distance between fast EMA line to arrow on chart turn on moving average signal for converging setup VWAP period MA period MA averaging method MA pricing method upper level limit ( VWAP ) lower level limit ( VWAP ) You can find the best setting for 4 hour EURUSD on this v
FREE

本指标 基于 Zigzag 基础上... 增加了: 1.增加了箭头指示,使图表更鲜明 2.增加了价格显示,使大家更清楚的看清价格. 3.增加了报警等设置,可以支持邮件发送 原指标特性: 1.基本的波段指标构型. 2.最近的2个ZIGZAG点不具有稳定性,随着行情而改变,(就是网友所说的未来函数) 3.原指标适合分析历史拐点,波段特性,对于价格波动有一定的指导性.
Zigzag的使用方法一 丈量一段行情的起点和终点 (1)用ZigZag标注的折点作为起点和终点之后,行情的走势方向就被确立了(空头趋势); (2)根据道氏理论的逻辑,行情会按照波峰浪谷的锯齿形运行,行情确立之后会走回撤行情,回撤的过程中ZigZag会再次形成折点,就是回撤点; (3)在回撤点选择机会进场,等待行情再次启动,止损可以放到回撤的高点。 一套交易系统基本的框架就建立起来了。 Zigzag的使用方法二 作为画趋势线的连接点 趋势线是很常见的技术指标,在技术分析中被广泛地使用。 但一直以来趋势线在实战中都存在一个BUG,那就是难以保证划线的一致性。 在图表上有很多的高低点,到底该连接哪一个呢?不同的书上画趋势线的方法
FREE

Название продукта Smart ATR (MT4) – часть серии SmartView Краткое описание Индикатор ATR с уникальным пользовательским опытом на платформе MetaTrader. Предоставляет расширенные возможности, ранее недоступные, такие как открытие настроек двойным кликом, скрытие и отображение индикаторов без удаления, и отображение окна индикатора на весь размер графика. Разработан для работы вместе с остальными индикаторами серии SmartView. Обзор Серия SmartView предлагает уникальный и отличительный пользовательс
FREE
Summer Sale: 50% OFF!!! Promotion is valid until 08 August 2025! This indicator is unstoppable when combined with our other indicator called Katana. After purchase, send us a message and you could get Katana for FREE as a BONUS After purchase, send us a private message for your instructions. The Trend Forecasting indicator is a very unique & easy tool that is able to make prediction about future price movement based on the signals generated by MACD . It helps you have an estimation on the are
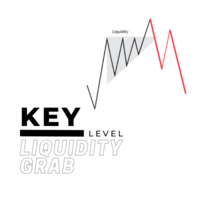
For a bullish move to occur for example, there should be alot of buying power. but you cannot buy if there is no sell on the other side, so the big players usually tend to manipulate the market in order to create available positions on the other side and be able to open their positions and one of the ways is by creating a fake breakout/ a liquidity grab. Before majority of big reversal moves and trends are formed, a liquidty grab would have occured in order to have enough orders to push for the

Scalping monster - готовая торговая система в виде индикатора. Scalping monster разработан для платформы Metatrader4. При размещении на график форекс индикатор автоматически анализирует рынок с помощью адаптационного алгоритма и выводит трейдеру на экран сигналы в виде красных и синих точек. Так же индикатор показывает в правом верхнем углу информацию о потенциальной прибыли/убытке.
Как торговать с помощью Scalping monster:
когда появляется синяя точка на графике - открываем ордер на покупку.
This automated VOLUME SCALPING INDICATOR can be utilized to manage trades and identify potential areas of support and resistance for both buying and selling. It is designed to identify zones for Sell/Buy trades based on the volume analysis and can be effectively used in conjunction with other indicators, such as order block indicators, and more. Currently designed for MT4, it will later be adapted to function on MT5. We also offer the opportunity to customize the robot according to your trading
FREE
CISD (Change In State Delivery) Indicator TradingLabs ID – ICT Concept Tool The Change In State Delivery (CISD) Indicator is designed based on the ICT (Inner Circle Trader) concept, where price transitions from one delivery state to another often signal high-probability trade opportunities. This tool automatically detects and marks CISD levels on your MT4 charts, helping traders identify potential breakout and retest zones with great accuracy. It is especially useful for traders applying Smart
MTF Fair Value Gaps Alerts indicator is based on Fair Value Gaps (FVG), Volume imbalance (VI) and Gaps. This indicator will create 2 arrows pointing to the left showing the area of the FVG, VI and Gaps and will never repaint after the candle has been closed .
Inputs: TF (Timeframe of the Alert For Current timeframe use CURRENT)
barshilft : the barshift needs to be the same timeframe as the above TF. barshift format (CURRENT, M1, M5, M15, M30, H1, H4, D1, W1, MN) Send Email: Audible Alert Push N
FREE
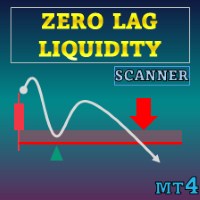
Специальное предложение : ALL TOOLS , всего по $35 за каждый! Новые инструменты будут стоить $30 в течение первой недели или для первых 3 покупок ! Канал Trading Tools на MQL5 : Присоединяйтесь к моему каналу MQL5, чтобы получать последние новости от меня Zero Lag Liquidity строит зоны ликвидности на основе профилей фитилей младшего таймфрейма и фитилей с высоким объёмом. Для каждой аномальной свечи индикатор формирует внутрифитильную объёмную гистограмму, находит локальную точку к
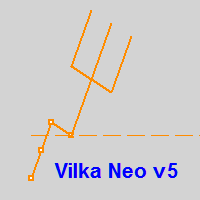
Вилка Нео v5, разрабатывалась для торговой системы "Оракул", но постепенно дополнялась, например - углами Ганна и другими опциями...
Можно создавать графические объекты с заданным цветом, стилем и толщиной, такие как: прямоугольники с заливкой и без, отрезки трендлиний и нестандартный инструмент - "вилка Нео" в виде трезубца, так же есть возможность интерактивно настраивать цветовую палитру прямо с графика, настраивать видимость объектов для разных ТФ, толщину и стили... Панель переключается кла
FREE

Индикатор использует линии Полос Боллинджера для обнаружения тренда. Очень полезный инструмент для ручной торговли. Кроме того, можно использовать индикатор с ATR в качестве фильтра, а также включить всплывающее уведомление при развороте тренда. Показатели индикатора очень понятны и просты в использовании. Лучше всего индикатор работает на таймфрейме H1.
Параметры советника: BarsCount - количество баров для расчета линии. BBperiod - период полос Боллинджера. BBdeviations - отклонения полос Болл
FREE

Are you tired of drawing trendlines every time you're analyzing charts? Or perhaps you would like more consistency in your technical analysis. Then this is for you. This indicator will draw trend lines automatically when dropped on a chart. How it works Works similar to standard deviation channel found on mt4 and mt5. It has 2 parameters: 1. Starting Bar 2. Number of bars for calculation The starting bar is the bar which drawing of the trend lines will begin, while the number of bars for c
FREE
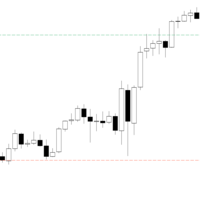
PDHL – отображает максимумы и минимумы предыдущих дней прямо на графике, предоставляя трейдеру быстрый и наглядный ориентир по ключевым уровням прошлых сессий. Индикатор лёгкий и легко настраиваемый : вы можете изменить количество отображаемых дней, цвета, стиль и толщину линий в соответствии со своими предпочтениями. Он создан для удобства и простоты использования, однако может работать не на всех инструментах или платформах . Русский : Тестировался только на CFD
FREE
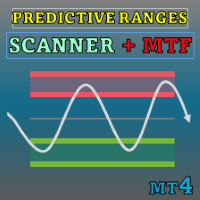
Special offer : ALL TOOLS , just $35 each! New tools will be $30 for the first week or the first 3 purchases ! Trading Tools Channel on MQL5 : Join my MQL5 channel to update the latest news from me В условиях современной нестабильной финансовой торговли точное определение уровней поддержки и сопротивления имеет решающее значение для принятия обоснованных решений трейдерами. Predictive Ranges Scanner Multi-TF — это продвинутый инструмент, разработанный для сканирования и прогнозиров

Автоматически строит уровни Фибоначчи на основе максимальных и минимальных цен за указанный временной период Несколько баров могут быть объединены: например, можно получить уровни Фибоначчи на основе максимумов и минимумов за 10 дней Моя утилита 1 : более 66 функций, включая этот индикатор | Свяжитесь со мной по любым вопросам | Версия для MT5 Помогает увидеть потенциальные уровни разворота; Паттерны, сформированные на уровнях Фибоначчи, обычно сильнее; Значительно сокращает врем

A classical MACD indicator where both the MACD line and the Signal line are displayed as lines. The difference between MACD and Signal line is displayed as a histogram. A user can change the color and thickness of histogram lines. So, histogram lines can be grouped into four different groups: positive ascending, positive descending, negative descending and negative ascending. Multi-currency Dashboard for the indicator is available https://www.mql5.com/en/market/product/72354
FREE

Индикатор определяет торговый коридор, плоский рынок, коррекции.
Позволяет сопоставлять значимость разных флэтовых и трендовых участков (по времени существования и по волатильности). Это даёт возможность одним взглядом оценить цикл рынка и его настроения.
То есть, сколько в среднем по времени длится флэт, а сколько тренд и какая у них волатильность в пунктах.
Как правило, чем дольше длится флэт, тем больше вероятность накопления потенциала для сильного движения.
Индикатор не перерисовыва
Откройте для себя новое измерение торговли с нашим передовым индикатором MQL4 Range BreakOut MT4
Этот мощный инструмент предназначен для выявления и извлечения выгоды из движения цен, когда они выходят за пределы установленных диапазонов.
предоставляя вам точность и уверенность, необходимые для процветания в динамичном мире финансовых рынков.
Версия MT5 : WH Range BreakOut MT5
Функции:
Точное определение дальности. Мультисимволы и мультитаймфреймы (сканер). Сигналы прорыва в реальном

Introduction This indicator detects volume spread patterns for buy and sell opportunity. The patterns include demand and supply patterns. You might use each pattern for trading. However, these patterns are best used to detect the demand zone (=accumulation area) and supply zone (=distribution area). Demand pattern indicates generally potential buying opportunity. Supply pattern indicates generally potential selling opportunity. These are the underlying patterns rather than direct price action. T
FREE

Индикатор ICT Asian Range — это мощный инструмент, разработанный для помощи трейдерам в определении ключевых рыночных структур и зон ликвидности на основе торговой стратегии ICT Asian Range. Он отмечает самые высокие и самые низкие уровни цен азиатской сессии (с 7 вечера до полуночи по нью-йоркскому времени) и предоставляет критически важную информацию о рыночных движениях для следующих торговых сессий. Этот индикатор повышает точность торговли, выделяя свипы ликвидности и разрывы справедливой

Lord Auto Fibonnaci is a free indicator for Meta Trader, in order to show the most famous chart in the financial market known as "Fibonnaci".
As we can see in the images below, the fibonnaci table will automatically analyze the graph for you, with trend factors through percentage, almost infallible use, you can always work when the percentage is low or high, start shopping and sales on time, great for analyzing entries!
In the images below we can see an example in gold in H4, where we are at
FREE

What is G Force Trend? G Force Trend is a technical analysis indicator developed for the MetaTrader 4 platform. It analyzes price movements to identify trend direction and generates buy/sell signals. The indicator creates a dynamic channel to track price behavior within the channel and visualizes trend changes. What Does It Do? Trend Detection : Determines whether the price is in a bullish or bearish trend. Buy/Sell Signals : Generates clear buy and sell signals when the price crosses the channe
FREE

This comprehensive technical indicator calculates and plots up to 3 moving averages with 3 different periods. By employing three moving averages of distinct lookback periods, the trader can confirm whether the market has indeed experienced a change in trend or whether it is merely pausing momentarily before resuming its prior state. SX Golden MA Pack for MT5 is available here . The shorter the moving average period, the more closely it tracks the price curve. When a security initiates an upt
FREE
Stop missing powerful breakout opportunities! The Advanced Breakout Scanner Dashboard is a professional-grade trading tool that monitors up to 28 currency pairs in real-time, scanning for ten unique high-probability breakout strategies simultaneously. Attach it to a single chart to get a complete overview of the entire market, instantly identifying the best trading setups as they happen. This is not just a signal indicator; it's a complete trading dashboard designed for serious breakout traders.
Этот индикатор является уникальным в своём роде, больше всего подходит для скальпинга на XAUUSD а также для торговли на более старших таймфреймах!
Уведомление сообщит самые важные точки входа, поэтому следует торговать по тренду. Идеален для скальпинга! The Best Trend Signals - трендовый мультивалютный индикатор, может использоваться на любых финансовых инструментах валюта, криптовалюта, металлы, акции, индексы. Рекомендуемый тайм-фрейм M15, M30, H1, H4, D1.
Как торговать с помощью индикатора
FREE

Other profitable programs https://www.mql5.com/en/users/ifyjava/seller Solarwind No Repaint — это технический осциллятор, который применяет преобразование Фишера к нормализованным ценовым данным, создавая гистограммный индикатор для выявления потенциальных точек разворота рынка. Этот индикатор преобразует ценовые движения в нормальное распределение Гаусса, делая циклические паттерны и сдвиги импульса более заметными для трейдеров. Принцип работы Индикатор обрабатывает ценовые данные через неско
FREE

Mouse Calculation быстро рассчитывает прибыль/убыток по каждой сделке при закрытии по цене, на которую указывает мышь. Подходит для быстрого принятия решений при множестве ордеров: сетка, мартингейл, поэтапный набор позиции. Цена безубытка и целевые уровни — наглядно. Основные функции Mouse PnL (M) : Предпросмотр PnL по каждой сделке и по сумме (включая swap). Break even Price (B) : Отображение цены безубытка / линии безубытка для всей корзины. Time_Sync_Lines (T) : Синхронизация одного и того ж
FREE

Индикатор позволяет с легкостью размечать на графике настраиваемые уровни дневного открытия. Во многих торговых стратегиях дневное открытие является важным уровнем для принятия торгового решения. Данный индикатор как раз призван помочь в работе с такими стратегиями и в дальнейшей их оптимизации, а также в общем понимании движения рынков. С помощью этой инструмента вы можете легко посмотреть предыдущее ценовое действие вокруг таких уровней дневного открытия, даже на других часовых поясах.
Функци
FREE

his indicator automatically identifies key support and resistance levels by analyzing volume patterns. Unlike traditional S/R tools that rely only on price, Volume S/R finds levels where the market truly reacted. DETECTION LOGIC: - High Volume Zones: Price levels where strong buying/selling occurred - Low Volume Zones: Areas of weak interest - potential breakout or reversal zones
SMART FILTERING: - Nearby levels are automatically merged to avoid chart clutter - Maximum levels limit keeps yo
FREE

Ищет точки входа по локальному тренду без перерисовки! Стрелками отображаются точки входа. Основан на классических индикаторах. Индикатор легкий в использовании. Подпишись на мой telegram канал, ссылка в контактах моего профиля . Настройки Наименование Описание Frequency factor Частота сигнала. Чем меньше, тем чаще.
Соответственно, это влияет на качество.
Рекомендации: Рекомендуется использовать на мажорных валютных парах. Таймфрем от м5, м15, м30
FREE
ALL MOVING AVERAGES: Идеальный Пользовательский Индикатор для Разнообразных Стратегий Пользовательский индикатор ALL MOVING AVERAGES — это ваш незаменимый инструмент для глубокого технического анализа, содержащий впечатляющую коллекцию из более чем 31 самых популярных скользящих средних . Разработанный как для опытных трейдеров, так и для новичков, этот индикатор предлагает беспрецедентную гибкость, позволяя идеально настроить скользящие средние для широкого спектра торговых стратегий. Благодаря
FREE
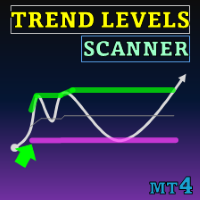
Special offer : ALL TOOLS , just $35 each! New tools will be $30 for the first week or the first 3 purchases ! Trading Tools Channel on MQL5 : Join my MQL5 channel to update the latest news from me Индикатор Trend Levels тщательно разработан для определения ключевых уровней тренда — Высокий, Средний и Низкий — в период рыночных движений. С расчетами в реальном времени, основанными на максимальных, минимальных и средних значениях за настраиваемый период, этот инструмент предоставляе
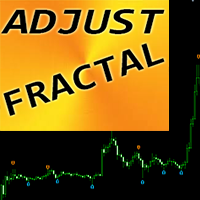
"Adjustable Fractals" - это расширенная версия индикатора фракталов, очень полезный инструмент для торговли!
- Как мы знаем, стандартный индикатор fractals mt4 вообще не имеет настроек - это очень неудобно для трейдеров. - Adjustable Fractals решил эту проблему - в нем есть все необходимые настройки: - Настраиваемый период индикатора (рекомендуемые значения - выше 7). - Настраиваемое расстояние от максимумов/минимумов цены. - Настраиваемый дизайн фрактальных стрелок. - Индикатор имеет встроенн

[V 1.00] Выпущен MTF NRPA 5 Moving Average RTD!
Приборная панель в реальном времени без перерисовки стрелок.
Если вы ищете лучший индикатор скользящих средних, то вы находитесь на правильной странице. Обычно люди устанавливают две скользящие средние, потому что пересечение двух скользящих средних (пересечение) определяет направление следующего ценового тренда. Если быстрая скользящая средняя пересекается с медленной скользящей средней и быстрая > медленная, то тренд восходящий. И наоборот, ес

Индикатор PipTick Pivot автоматически рассчитывает и отображает линии уровней разворота, а также уровни поддержки и сопротивления. Уровень разворота может рассчитываться по разным формулам: классическая, Floor, Fibonacci, Woodie, Camarilla или DeMark. Можно выбрать период для расчета индикатора. Период может быть дневным, недельным, месячным или пользовательским.
Типы пивотов: Классический. Floor. Fibonacci. Woodie. Camarilla. DeMark.
Основные характеристики Индикатор показывает текущие и исто
FREE

Индикатор синхронизирует восемь видов разметки на нескольких графиках одного торгового инструмента.
Этот индикатор удобно использовать вместе с "Multichart Dashboard" или другим похожим помощником, который позволяет работать сразу с несколькими графиками одновременно.
"Multichart Dashboard" можно найти по ссылке на моём youtube-канале.
Настройки:
включение синхронизации Vertical Line
включение синхронизации Horizontal Line
включение синхронизации Trend Line
включение синхронизации Fi
FREE

Flat Reminder Overview Flat Reminder is a powerful technical analysis tool that identifies and highlights price consolidation zones on your chart. It detects when price action slows down and moves sideways, indicating potential reversal points, continuation setups, or key decision zones in the market. Key Features Consolidation Detection : Automatically identifies flat price zones where market momentum decreases Range Measurement : Calculates and displays the exact range of each consolidation in
FREE

Этот индикатор является основой для эксперта, который можно отнести к категории "почти Грааль". См. подробности ниже. Этот индикатор отображает проекцию графика ренко на ценовой график. Эта проекция отображается в виде ступенчатой линии, а не в виде "кирпичей" (прямоугольников). См. слайды 1 и 2. Сокращённое название индикатора: LRC – L ine of R enko on the price C hart . Принцип его построения очень прост. Сначала строится сетка горизонтальных линий (уровн
FREE
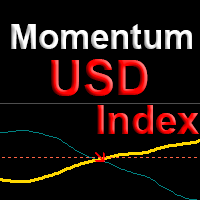
Индикатор показывает точки на продолжение тренда по валютным парам с участием доллара USD с вероятностью более 80%. Работа алгоритма основана на сравнении моментума текущей валютной пары с моментумом индекса доллара DX в текущий момент времени. Использование индекса доллара позволяет оценивать не только текущую пару, а целиком полную картину по всем мажорным валютам сразу. Данный подход увеличивает достоверность и уменьшает количество ложных срабатываний, позволяя строить новые стратегии с высо
MetaTrader Маркет - лучшее место для продажи торговых роботов и технических индикаторов.
Вам необходимо только написать востребованную программу для платформы MetaTrader, красиво оформить и добавить хорошее описание. Мы поможем вам опубликовать продукт в сервисе Маркет, где его могут купить миллионы пользователей MetaTrader. Так что занимайтесь только непосредственно своим делом - пишите программы для автотрейдинга.
Вы упускаете торговые возможности:
- Бесплатные приложения для трейдинга
- 8 000+ сигналов для копирования
- Экономические новости для анализа финансовых рынков
Регистрация
Вход
Если у вас нет учетной записи, зарегистрируйтесь
Для авторизации и пользования сайтом MQL5.com необходимо разрешить использование файлов Сookie.
Пожалуйста, включите в вашем браузере данную настройку, иначе вы не сможете авторизоваться.