
Developing a trading Expert Advisor from scratch (Part 12): Times and Trade (I)

Introduction
Tape Reading is a trading method used by some traders at various stages of trading. This method is very effective and, when used correctly, it provides a stable profit growth in a safer and more consistent way than when using the well-known Price Action, which is pure candlestick observation. However, the use of Tape Reading in its currently presented form is a very complex and tedious process which requires constant concentration of attention. Over time, we inevitably begin to make mistakes in observation.
The problem in tape reading is related to the amount of information which we have to analyze. Let's look at a typical use case for Tape Reading:
The real problem is that during the analysis we have to look at the price and at what happened to it, but checking these values in mini-contracts is not very practical. Therefore, we usually do not look at the content of the flow in mini-contracts, instead we prefer to observe full contracts, since they are the ones that move the market. This is what actually happens, so the system looks like the one below. It is somewhat easier to interpret and to follow.
But even in this case the application of the system is a very tedious process requiring extreme attention. The situation becomes even tighter when stop positions are activated, and in this case we can miss some of the movement, as the scrolling of information on the screen should be very fast.
Planning
However, the MetaTrader 5 platform has an alternative system even for mini-contracts, which makes monitoring much more efficient and easier. Let's see how things look when working with mini-contracts:
As you can see the interpretation is much simpler. However, for the reasons we discussed earlier, it is more appropriate to use full contracts, so it will look like the following:
Note that the data on deals are hindered by the noise of BID and ASK movements. The deals are represented here as circles. Red show sell deals, blue ones are buy deals and green show direct orders. In addition to the fact that we have information that is not needed for the observation itself, we have another problem: the system is separated from the chart that we actually trade, due to which we have to monitor two screens. On the one hand, this is an advantage, but in some cases it greatly complicates things. So, here I propose to create a system that is easy to read and at the same time allows us to see this indicator directly on the trading chart.
Implementation
The first thing we are going to do is modify the C_Terminal class so that we can access the full contract asset and this is done by adding the following code:
void CurrentSymbol(void)
{
        MqlDateTime mdt1;
        string sz0, sz1, sz2;
        datetime dt = TimeLocal();

        sz0 = StringSubstr(m_Infos.szSymbol = _Symbol, 0, 3);
        m_Infos.szFullSymbol = _Symbol;
        m_Infos.TypeSymbol = ((sz0 == "WDO") || (sz0 == "DOL") ? WDO : ((sz0 == "WIN") || (sz0 == "IND") ? WIN : OTHER));
        if ((sz0 != "WDO") && (sz0 != "DOL") && (sz0 != "WIN") && (sz0 != "IND")) return;
        sz2 = (sz0 == "WDO" ? "DOL" : (sz0 == "WIN" ? "IND" : sz0));
        sz1 = (sz2 == "DOL" ? "FGHJKMNQUVXZ" : "GJMQVZ");
        TimeToStruct(TimeLocal(), mdt1);
        for (int i0 = 0, i1 = mdt1.year - 2000;;)
        {
                m_Infos.szSymbol = StringFormat("%s%s%d", sz0, StringSubstr(sz1, i0, 1), i1);
                m_Infos.szFullSymbol = StringFormat("%s%s%d", sz2, StringSubstr(sz1, i0, 1), i1);
                if (i0 < StringLen(sz1)) i0++; else
                {
                        i0 = 0;
                        i1++;
                }
                if (macroGetDate(dt) < macroGetDate(SymbolInfoInteger(m_Infos.szSymbol, SYMBOL_EXPIRATION_TIME))) break;
        }
}

// ... Class code ...

inline string GetFullSymbol(void) const { return m_Infos.szFullSymbol; }
By adding the highlighted lines, we have access to the desired asset, which we will use in our Time & Trade program. Next, we can move on to creating object class which will support our Time & Trade. This class will contain some very interesting functions. First, it is necessary to create a subwindow that will contain our indicator. It is easy to do, however, for practical reasons we will not use the subwindow system that we used previously. Perhaps the concept will change in the future, but for now we will work with Time & Trade in a separate window from the indicator system, which involves a lot of preparatory work.
Let's start with creating a new support file in order to have a different name for the indicator. Instead of creating files on top of files, let's do something more elegant. We are modifying the support file in order to have more possibilities. The new support file is shown below:
#property copyright "Daniel Jose 07-02-2022 (A)"
#property version   "1.00"
#property description "This file only serves as supporting indicator for SubWin"
#property indicator_chart_window
#property indicator_plots 0
//+------------------------------------------------------------------+
input string user01 = "SubSupport";             //Short Name
//+------------------------------------------------------------------+
int OnInit()
{
        IndicatorSetString(INDICATOR_SHORTNAME, user01);

        return INIT_SUCCEEDED;
}
//+------------------------------------------------------------------+
int OnCalculate(const int rates_total, const int prev_calculated, const int begin, const double &price[])
{
        return rates_total;
}
//+------------------------------------------------------------------+
I have highlighted the changes that should be made to the source file. Now we need to make changes to our EA code. We will create a new class now:
#property copyright "Daniel Jose"
//+------------------------------------------------------------------+
#include "C_Terminal.mqh"
//+------------------------------------------------------------------+
class C_FnSubWin
{
        private :
                string  m_szIndicator;
                int             m_SubWin;
//+------------------------------------------------------------------+
                void Create(const string szIndicator)
                        {
                                int i0;
                                m_szIndicator = szIndicator;
                                if ((i0 = ChartWindowFind(Terminal.Get_ID(), szIndicator)) == -1)
                                        ChartIndicatorAdd(Terminal.Get_ID(), i0 = (int)ChartGetInteger(Terminal.Get_ID(), CHART_WINDOWS_TOTAL), iCustom(NULL, 0, "::" + def_Resource, szIndicator));
                                m_SubWin = i0;
                        }
//+------------------------------------------------------------------+
        public  :
//+------------------------------------------------------------------+
                C_FnSubWin()
                        {
                                m_szIndicator = NULL;
                                m_SubWin = -1;
                        }
//+------------------------------------------------------------------+
                ~C_FnSubWin()
                        {
                                Close();
                        }
//+------------------------------------------------------------------+
                void Close(void)
                        {
                                if (m_SubWin >= 0) ChartIndicatorDelete(Terminal.Get_ID(), m_SubWin, m_szIndicator);
                                m_SubWin = -1;
                        }
//+------------------------------------------------------------------+
inline int GetIdSubWinEA(const string szIndicator = NULL)
                        {
                                if ((szIndicator != NULL) && (m_SubWin < 0)) Create(szIndicator);
                                return m_SubWin;
                        }
//+------------------------------------------------------------------+
inline bool ExistSubWin(void) const { return m_SubWin >= 0; }
//+------------------------------------------------------------------+
};
//+------------------------------------------------------------------+
This class replaces C_SubWindow, and now it supports the creation of subwindows on a chart. To understand how this class works, take a quick look at the new C_SubWindow class below:
#include "C_ChartFloating.mqh"
#include <NanoEA-SIMD\Auxiliar\C_FnSubWin.mqh>
//+------------------------------------------------------------------+
class C_SubWindow : public C_ChartFloating
{
//+------------------------------------------------------------------+
        private :
                C_FnSubWin      m_fnSubWin;
//+------------------------------------------------------------------+
        public  :
//+------------------------------------------------------------------+
                ~C_SubWindow()
                        {
                                Close();
                        }
//+------------------------------------------------------------------+
                void Close(void)
                        {
                                m_fnSubWin.Close();
                                CloseAlls();
                        }
//+------------------------------------------------------------------+
inline int GetIdSubWinEA(void)
                        {
                                return m_fnSubWin.GetIdSubWinEA("SubWinSupport");
                        }
//+------------------------------------------------------------------+
inline bool ExistSubWin(void) const { return m_fnSubWin.ExistSubWin(); }
//+------------------------------------------------------------------+
};
//+------------------------------------------------------------------+
Pay attention that the class contains the definition of the indicator that will be used to support templates. It is highlighted in the code above. Now comes the tricky part. If we use another name instead of SubWinSupport, the C_FnSubWin class will search for another indicator. We will use this trick to avoid creating indicator files. We simply tell the C_FnSubWin class what the short name of the desired indicator should be. Thus, we are not limited by the number of unnecessary subwindows or indicator files used only to create an Expert Advisor subwindow.
After that we can move on to creating the C_TimeAndTrade class.
The C_TimesAndTrade class
The C_TimesAndTrade object class consists of several small pieces each of which is responsible for something specific. The code shown below is the first thing the EA calls for this class:
void Init(const int iScale = 2)
{
        if (!ExistSubWin())
        {
                CreateCustomSymbol();
                CreateChart();
        }
        ObjectSetInteger(Terminal.Get_ID(), m_szObjName, OBJPROP_CHART_SCALE, (iScale > 5 ? 5 : (iScale < 0 ? 0 : iScale)));
}
This code will check whether the support subwindow exists. If it does not yet exist, the code will create one. Now, take a look at the following code of initial support for the class:
inline void CreateCustomSymbol(void)
{
        m_szCustomSymbol = "_" + Terminal.GetFullSymbol();
        SymbolSelect(Terminal.GetFullSymbol(), true);
        SymbolSelect(m_szCustomSymbol, false);
        CustomSymbolDelete(m_szCustomSymbol);
        CustomSymbolCreate(m_szCustomSymbol, StringFormat("Custom\\Robot\\%s", m_szCustomSymbol), Terminal.GetFullSymbol());
        CustomRatesDelete(m_szCustomSymbol, 0, LONG_MAX);
        CustomTicksDelete(m_szCustomSymbol, 0, LONG_MAX);
        SymbolSelect(m_szCustomSymbol, true);
};
This code will create a custom symbol and reset all data inside that symbol. To enable the display of symbol contents in the window that we are going to create, first this symbol should be added to Market Watch. This is done in the following line:
SymbolSelect(m_szCustomSymbol, true);
The custom symbol will be created at Custom\Robot <Symbol name>.. Its initial data will be provided by the original symbol. It is implemented in the following code:
CustomSymbolCreate(m_szCustomSymbol, StringFormat("Custom\\Robot\\%s", m_szCustomSymbol), Terminal.GetFullSymbol());
Basically, that's all. Add the class to the EA and run it as follows:
// ... Expert Advisor code

#include <NanoEA-SIMD\Tape Reading\C_TimesAndTrade.mqh>

// ... Expert Advisor code

input group "Times & Trade"
input   int     user041 = 2;    //Escala
//+------------------------------------------------------------------+
C_TemplateChart Chart;
C_WallPaper     WallPaper;
C_VolumeAtPrice VolumeAtPrice;
C_TimesAndTrade TimesAndTrade;
//+------------------------------------------------------------------+
int OnInit()
{
// ... Expert Advisor code

        TimesAndTrade.Init(user041);

        OnTrade();
        EventSetTimer(1);

        return INIT_SUCCEEDED;
}
The result is the following:
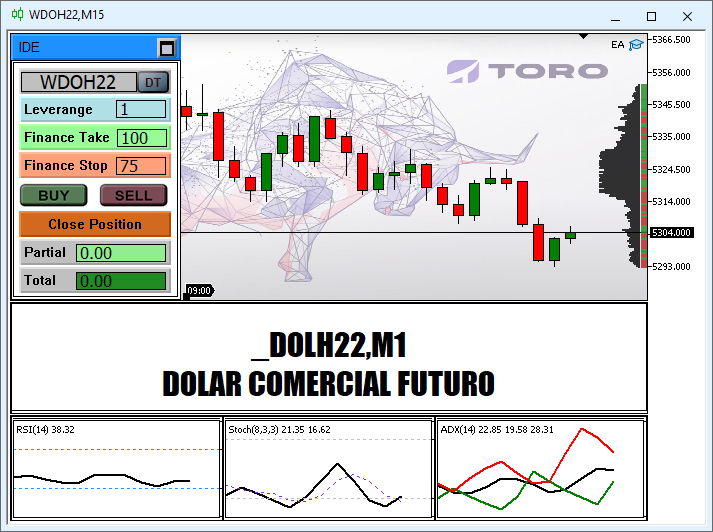
And it is exactly what was expected. Now, let's add the values of performed deals onto the _DOLH22 chart. This chart will reflect all performed deals to provide the graphical representation of Times & Trade. The presentation will be in the form Japanese candlestick patterns, because they are easy to use. Prior to this, we need to do a few things, in particular, connect and synchronize the symbol. This is done in the following function:
inline void Connect(void)
{
        switch (m_ConnectionStatus)
        {
                case 0:
                        if (!TerminalInfoInteger(TERMINAL_CONNECTED)) return; else m_ConnectionStatus = 1;
                case 1:
                        if (!SymbolIsSynchronized(Terminal.GetFullSymbol())) return; else m_ConnectionStatus = 2;
                case 2:
                        m_LastTime = TimeLocal();
                        m_MemTickTime = macroMinusMinutes(60, m_LastTime) * 1000;
                        m_ConnectionStatus = 3;
                default:
                        break;
        }
}
The function checks if the terminal is connected and then synchronizes the symbol. After that, we can start capturing values and displaying them on the screen. But for this, it is necessary to make a small change to the initialization code. The change is highlighted in the following code:
void Init(const int iScale = 2)
{
        if (!ExistSubWin())
        {
                CreateCustomSymbol();
                CreateChart();
                m_ConnectionStatus = 0;
        }
        ObjectSetInteger(Terminal.Get_ID(), m_szObjName, OBJPROP_CHART_SCALE, (iScale > 5 ? 5 : (iScale < 0 ? 0 : iScale)));
}
After that we can see he capture function.
inline void Update(void)
{
        MqlTick Tick[];
        MqlRates Rates[def_SizeBuff];
        int i0, p1, p2 = 0;
        int iflag;

        if (m_ConnectionStatus < 3) return;
        if ((i0 = CopyTicks(Terminal.GetFullSymbol(), Tick, COPY_TICKS_ALL, m_MemTickTime, def_SizeBuff)) > 0)
        {
                for (p1 = 0, p2 = 0; (p1 < i0) && (Tick[p1].time_msc == m_MemTickTime); p1++);
                for (int c0 = p1, c1 = 0; c0 < i0; c0++)
                {
                        if (Tick[c0].volume == 0) continue;
                        iflag = 0;
                        iflag += ((Tick[c0].flags & TICK_FLAG_BUY) == TICK_FLAG_BUY ? 1 : 0);
                        iflag -= ((Tick[c0].flags & TICK_FLAG_SELL) == TICK_FLAG_SELL ? 1 : 0);
                        if (iflag == 0) continue;
                        Rates[c1].high = Tick[c0].ask;
                        Rates[c1].low = Tick[c0].bid;
                        Rates[c1].open = Tick[c0].last;
                        Rates[c1].close = Tick[c0].last + ((Tick[c0].volume > 200 ? 200 : Tick[c0].volume) * (Terminal.GetTypeSymbol() == C_Terminal::WDO ? 0.02 : 1.0) * iflag);
                        Rates[c1].time = m_LastTime;
                        p2++;
                        c1++;
                        m_LastTime += 60;
                }
                CustomRatesUpdate(m_szCustomSymbol, Rates, p2);
                m_MemTickTime = Tick[i0 - 1].time_msc;
        }
}
The above function allows capturing absolutely all trading ticks to check whether they are sell or buy ticks. If these ticks are related to BID or ASK changes, i.e. without volume, the information is not saved. The same concerns the ticks, which are direct orders that do not affect the price movement, although they are often related to the movement, as there are market players who force the price to a certain value only in order to fill a direct order, and then, shortly after that let the price move freely. These ticks, related to BID and ASK modification, will be used in another version, which we will see in the next article, since they are of secondary importance in the overall system. After checking the transaction type, we have a sequence of lines which are very important and you should understand them. These lines in the code below will build one candlestick per each tick that has passed through the analysis system and that should be saved.
Rates[c1].high = Tick[c0].ask;
Rates[c1].low = Tick[c0].bid;
Rates[c1].open = Tick[c0].last;
Rates[c1].close = Tick[c0].last + ((Tick[c0].volume > 200 ? 200 : Tick[c0].volume) * (Terminal.GetTypeSymbol() == C_Terminal::WDO ? 0.02 : 1.0) * iflag);
Rates[c1].time = m_LastTime;
The high and low of the candlestick indicate the spread at the time of the trade, i.e. the value that existed between BID and ASK will be the shadow of the created candlestick, and the opening value of the candlestick is the price at which the transaction was actually completed. Now take a close look at the highlighted code line. For a trading tick we have volume, this line will create a small adjustment to that volume so that the scale does not overflow. You may adjust the values according to your own analysis, depending on the asset, at your discretion.
Now the last detail - the time. Each candlestick will correspond to one minute, as it is not possible to plot values below that. Then each of them will remain in the corresponding position every minute. This is not real time, this is virtual time. Do not confuse trade time with graphical time: operations can take place in milliseconds, but the graphical information will be plotted every minute on a graphical scale. We could use any other value, but this, being the smallest possible, greatly simplifies programming. The result of this system can be seen below:
We see that reading is quite possible now and that interpretation is simple. Although the order tape was very slow at the time of capture, but I think it's enough to get the idea.
The final information about this system can be seen in the figure below:

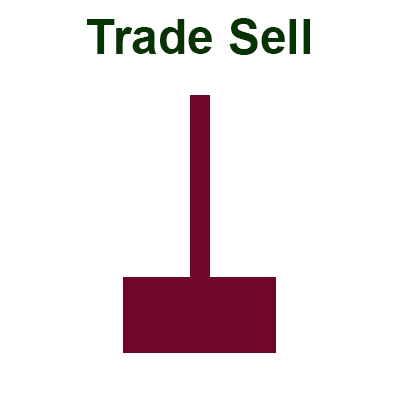

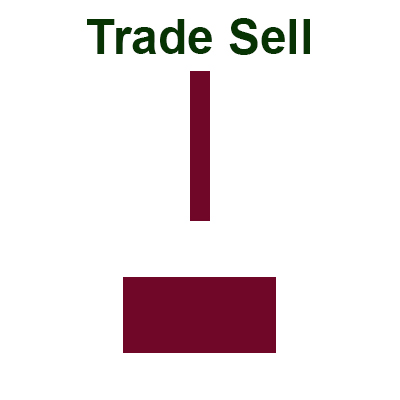
Pay attention that there are four different configurations that can be seen on the system. What are they needed for? We will see this in the next article, which will help in understanding why there are four Times & Trade configurations. Anyway, we already have a working system which is perhaps enough for intensive use. But if you understand what's going on and what's causing the four candlestick patterns to be generated, you can get a lot more out of this system, and who knows, maybe it will become your main indicator...
Conclusion
We have created the Times & Trade system for use in our EA to analyze Tape Reading. It should provide the same speed of analysis as the alternative system present in MetaTrader 5. We have achieved this by creating a charting system, instead of reading and trying to understand a huge amount of numbers and values. In the next article, we will implement some missing information in the system. We will need to add some new elements to the code of our Expert Advisor.
Translated from Portuguese by MetaQuotes Ltd.
Original article: https://www.mql5.com/pt/articles/10410
Warning: All rights to these materials are reserved by MetaQuotes Ltd. Copying or reprinting of these materials in whole or in part is prohibited.
This article was written by a user of the site and reflects their personal views. MetaQuotes Ltd is not responsible for the accuracy of the information presented, nor for any consequences resulting from the use of the solutions, strategies or recommendations described.

 Developing a trading Expert Advisor from scratch (Part 13): Time and Trade (II)
 Developing a trading Expert Advisor from scratch (Part 11): Cross order system
 Learn how to design a trading system by Williams PR
- Free trading apps
- Over 8,000 signals for copying
- Economic news for exploring financial markets
You agree to website policy and terms of use
Published article Developing a commercial EA from scratch (Part 12): Time & Trade (I):
Author: Daniel Jose
Excellent