
Parafrac Oscillator: Combination of Parabolic and Fractal Indicator
Introduction
Technical indicators serve as indispensable tools for market participants, transforming complex mathematical formulae into clear graphical representations. This visual format facilitates efficient market analysis, strategic planning, and the development of entry methodologies. Crucially, these automated tools liberate traders from the burdensome task of manual recalculation whenever new market data emerges, ensuring analysis remains current and responsive.
The spectrum of indicators addresses diverse analytical needs. Certain indicators excel at identifying prevailing market trends, delineating consolidation zones, or quantifying market volatility. Others are specifically engineered to measure trading volume dynamics. Collectively, these instruments empower traders to base their decisions on structured, quantifiable insights rather than intuition alone.
Towards a Novel Oscillator: Combining Parabolic SAR and Fractals
This article proposes a strategic synthesis, focusing on the fusion of the Parabolic SAR and the Fractal indicator. Our objective is to leverage the distinct strengths of both – the Parabolic SAR's trend direction and potential reversal points, alongside the Fractal's identification of significant price extremes – to engineer a new oscillator indicator. This novel tool will subsequently serve as the foundation for developing a refined trading strategy, aiming to capitalize on the synergistic potential of these established analytical components.
Exploring the Parabolic and Fractal Indicator
In this section, we delve into the two key indicators—Parabolic SAR and Fractal—that form the foundation of the newly engineered oscillator. While we will avoid going into the mathematical formulas behind these tools, our focus will be on how to access and use them effectively within a trading platform.
Parabolic SAR
The Parabolic Stop and Reverse (SAR) is a trend-following indicator designed to identify both the direction of a trend and potential reversal points. True to its name, the indicator signals when traders should "stop" and "reverse" their positions based on changing market momentum. It was developed by J. Welles Wilder Jr. in 1978.
The Parabolic SAR typically appears on a chart as a series of dots, positioned either above or below the price candles. When the dots form above the high of a candlestick, it suggests a potential sell signal. Conversely, when the dots appear below the low of a candlestick, it indicates a potential buy opportunity. This visual cue makes the indicator especially useful for timing exits and entries during trending markets.
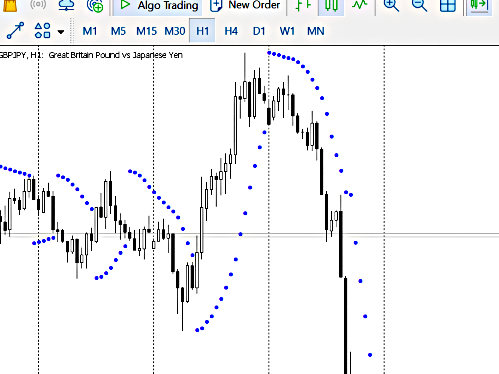
Figure 1
To access the Parabolic SAR in MetaTrader 4 or 5:
- Click on the ‘Insert’ menu or the ‘Indicators’ icon.
- Navigate to the ‘Trend’ category.
- Select ‘Parabolic SAR’ from the list.
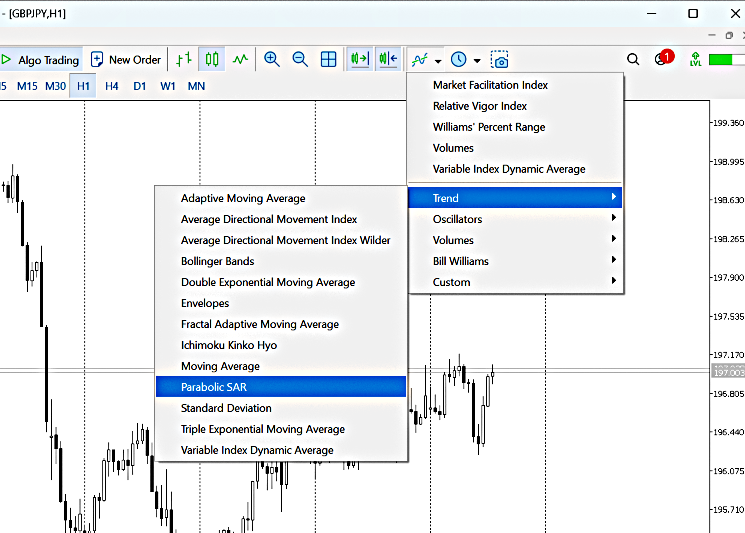
Figure 2
Upon selection, you’ll be prompted to configure two main input parameters:
- Step (pstep): Determines the sensitivity of the indicator. A smaller step makes the SAR more responsive to price changes.
- Maximum (pMax): Controls the maximum value of the step, affecting how quickly the indicator accelerates toward the price.
These settings influence how closely the SAR trails the price, and traders can fine-tune them based on their trading style or the volatility of the asset.
![]()
Figure 3
Fractal Indicator
The Fractal indicator is a technical analysis tool used to identify potential reversal points in the market by highlighting short-term support and resistance levels. It was also developed by Bill Williams, a renowned trader and author known for his contributions to chaos theory in market behavior.
Fractals appear on the chart as a series of arrows pointing either up or down:
- An upward-pointing fractal appears above a group of candlesticks and signals a potential reversal to the downside.
- A downward-pointing fractal forms below a group of candlesticks and suggests a potential reversal to the upside.
A valid fractal pattern consists of five consecutive bars (or candlesticks). For a bullish fractal, the middle bar must have the lowest low, with two higher lows on either side. For a bearish fractal, the middle bar must have the highest high, flanked by two lower highs on either side.
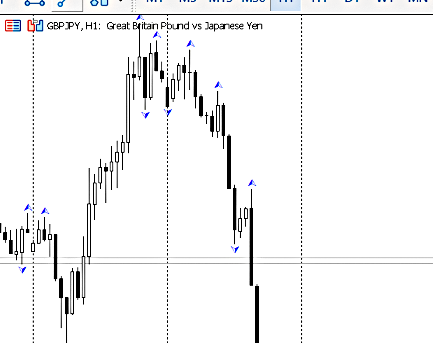
Figure 4
To access the Fractal indicator in MetaTrader 4 or 5:
- Open the ‘Insert’ menu or click the ‘Indicators’ icon.
- Go to the ‘Bill Williams’ category.
- Select ‘Fractals’ from the list.
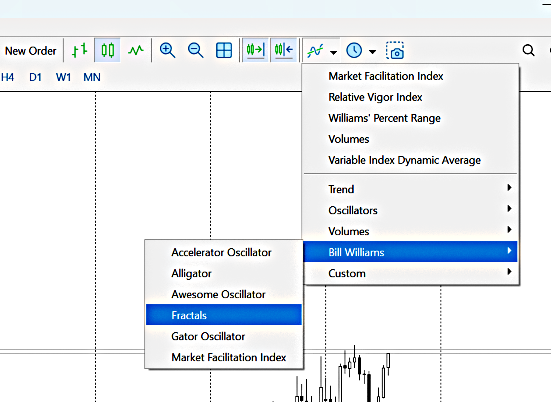
Figure 5
Unlike some other indicators, the Fractal indicator has no adjustable input parameters. Once added to the chart, it automatically identifies and marks the relevant fractal patterns with arrows above or below the price bars as depicted in Figure 4.
In this article, the Fractal indicator will be used not just as a reversal signal, but more specifically to measure the range of price movement between recent significant highs and lows. By identifying the most recent high fractal and most recent low fractal, traders can establish a dynamic price range that reflects current market behavior.
This range becomes particularly useful when combined with the Parabolic SAR, allowing for the construction of a new oscillator-style indicator.
Introducing the Parafrac Oscillator
The Parafrac Oscillator is a custom technical indicator developed by combining two powerful tools: the Parabolic SAR and the Fractal indicator. As the name implies, Parafrac merges the gap between the Parabolic SAR and price with the range defined by recent fractal highs and lows. This hybrid approach provides a dynamic way to evaluate trend strength and market momentum.
While the mathematical foundation of many indicators is often hidden behind user interfaces, understanding the concept behind the Parafrac Oscillator is crucial for interpreting its signals and customizing its behavior.
Mathematical Concept Behind the Parafrac Oscillator
At the core of the Parafrac Oscillator lies a simple yet powerful idea: normalize the gap between price and the Parabolic SAR by the price range defined by recent fractal points.
The following equations define the oscillator:
1. Fractal Range (FracDiff):
![]()
This value represents the absolute difference between the most recent high fractal and low fractal, giving a dynamic range of current market activity.
By visual inspection:
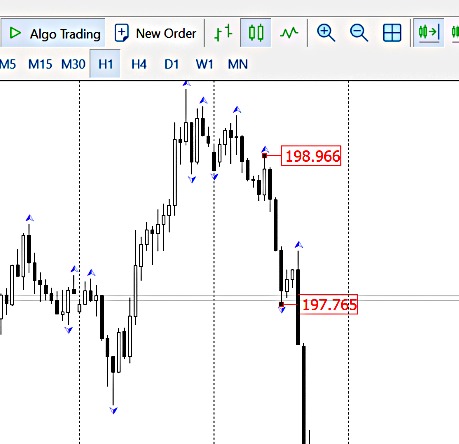
Figure 6
2. Uptrend Condition:

When the market is in a potential uptrend, the oscillator measures how far the lower of the candle's body (open or close) is from the PSAR value, normalized by the fractal range.
3. Downtrend Condition:

For a downtrend, the oscillator evaluates the gap between the higher end of the candle's body and the PSAR, again scaled by the fractal range.
By visualization:
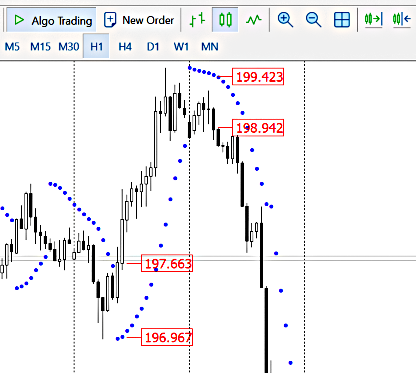
Figure 7
By calculating the oscillator this way, we capture the momentum of price action in relation to trend direction (via Parabolic SAR) and recent price extremes (via Fractals). The resulting values can then be plotted as an oscillator for easy visual interpretation—offering insights into trend strength, volatility, and potential reversals.
Observation: Interpretation and Behavior of the Parafrac Oscillator
One of the key strengths of the Parafrac Oscillator lies in its normalization. Because the oscillator values are derived by dividing the gap between price and the Parabolic SAR by the fractal-defined range (FracDiff), the resulting values are unitless and scale-independent. This means the oscillator can be applied across different market instruments—whether you're trading Gold, GBP/JPY, or any other asset—while maintaining consistent, comparable readings.
For instance, a reading of +2.5 or -2.5 on the Parafrac Oscillator for Gold will carry the same implication as a similar reading for GBP/JPY, allowing traders a unified framework for developing and applying strategies across markets and timeframes.
Volatility and Momentum Insights
Both components of the oscillator—FracDiff and the Parabolic SAR gap—contribute to its sensitivity and behavior:
- FracDiff provides a volatility measure. A large FracDiff suggests a volatile market, while a small FracDiff indicates relative calm.
- The Parabolic SAR gap reflects trend momentum. A wide gap suggests strong directional movement, while a narrow gap implies weakening momentum or consolidation.
These relationships allow for deeper interpretation of oscillator movements:
- When FracDiff is much greater than the PSAR gap (FracDiff >>> PSAR gap), the normalized value becomes smaller, causing the oscillator histogram to diminish—a sign of high volatility but weak momentum.
- When FracDiff is much smaller than the PSAR gap (FracDiff <<< PSAR gap), the normalized value becomes significantly larger, resulting in a spike in the oscillator histogram—a sign of strong directional movement in a relatively tight range.
Normal Operating Range and Default Settings
Empirical observation suggests that the Parafrac Oscillator typically fluctuates within a range of approximately ±2.5 under normal market conditions. However, during periods of high momentum or sharp reversals, the oscillator can produce extreme spikes that may visually dominate the histogram and obscure subsequent signals.
To maintain clarity and usability, the oscillator includes default maximum and minimum levels set to ±10. These boundaries help to:
- Keep the histogram visually balanced,
- Prevent extreme outliers from distorting the chart,
- Allow traders to quickly identify significant deviations from normal behavior.
These threshold levels can be customized by the user to suit specific instruments, trading styles, or personal preferences.
The Parafrac Oscillator inherits its core inputs from the Parabolic SAR, as it relies on the PSAR values to determine the strength and direction of market momentum. These parameters affect how closely the PSAR tracks the price, and consequently, how large or small the PSAR gap will be at any given time. Since the Parafrac Oscillator uses this gap as part of its core formula, fine-tuning these settings can have a noticeable effect on the oscillator’s responsiveness and the size of its histogram bars.
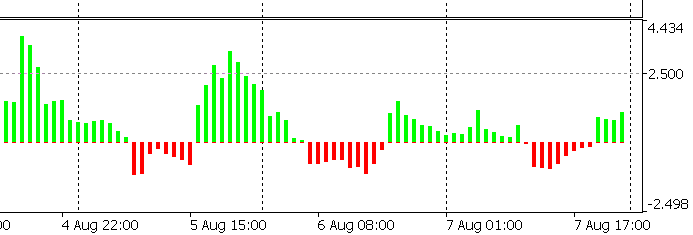
Figure 8: Parafrac Oscillator
Code Structure
The attached is MetaTrader 4 and MetaTrader 5 source code. Both has initialization structure as below.
#property indicator_type1   DRAW_HISTOGRAM
#property indicator_color1  Lime      // UpLevel
#property indicator_width1  2
#property indicator_label1  "UpLevel"

#property indicator_type2   DRAW_HISTOGRAM
#property indicator_color2  Red       // DownLevel
#property indicator_width2  2
#property indicator_label2  "DownLevel"

#property indicator_level1     2.5
#property indicator_level2    -2.5
#property indicator_level3     5.0
#property indicator_level4    -5.0
#property indicator_level5     7.5
#property indicator_level6    -7.5

#property indicator_maximum    10
#property indicator_minimum   -10
Visual Properties and Indicator Levels
This section of the code sets the visual and display properties of the Parafrac Oscillator to enhance readability and facilitate quick decision-making during live trading.
By default, the oscillator uses color-coded bars to distinguish trend directions:
- Lime (Green) bars represent uptrend conditions, where the price is showing bullish strength.
- Red bars indicate downtrend conditions, signaling bearish momentum.
These color choices help traders immediately identify the market sentiment at a glance, reducing the cognitive load when monitoring multiple charts.
Predefined Oscillator Levels
To provide further clarity and assist in signal interpretation, the oscillator includes the following horizontal guide levels: ±2.5, ±5 , ±7.5
These intermediate levels serve as reference zones, allowing traders to classify the strength of a trend or momentum burst. For example:
- Readings around ±2.5 may suggest mild to moderate momentum.
- Values exceeding ±5 could indicate a strong directional move.
- Reaching or surpassing ±7.5 often signals an overextended move or the peak of a strong trend.
To control histogram scale and maintain visual balance, the indicator also sets default maximum and minimum boundaries at: +10 (ceiling) , −10 (floor).
These limits ensure that exceptionally high or low values—caused by sudden market spikes—do not dominate the histogram and obscure subsequent signals. However, these thresholds are fully customizable, allowing traders the flexibility to adjust them based on their trading style, market instrument, or timeframe.
// Input parameters
input double pstep = 0.02;
input double pMax = 0.2;
Input Parameters
The Parafrac Oscillator includes configurable input parameters inherited from the Parabolic SAR, enabling traders to adjust the sensitivity of the oscillator to suit various market conditions and trading styles. These inputs are defined at the beginning of the indicator’s code and can be modified directly by the user within the MetaTrader platform.
1. Step (pstep = 0.02)
The pstep parameter determines the acceleration factor of the Parabolic SAR. A smaller step results in smoother PSAR movement, making the indicator less sensitive to short-term fluctuations. The default value of 0.02 provides a balanced response that works well for most markets.
2. Maximum (pMax = 0.2)
The pMax parameter sets the maximum value that the acceleration factor can reach. A higher value allows the Parabolic SAR to accelerate more quickly toward the price, which in turn makes the oscillator more responsive to sharp trends. The default of 0.2 ensures that strong trends are captured without introducing excessive noise.
These two parameters directly influence the PSAR gap in the Parafrac Oscillator formula and therefore affect:
- The size of the histogram bars,
- The frequency of spikes,
- The overall sensitivity of the oscillator to price movements.
By fine-tuning pstep and pMax, traders can customize the oscillator’s behavior to align with fast-moving markets (like crypto or scalping forex) or slower environments (like commodities or swing trading setups).
Conclusion
The Parafrac Oscillator offers traders a powerful, adaptive tool for building trading strategies across various market conditions. Its strength lies in its ability to combine trend direction (via Parabolic SAR) with market volatility (via Fractal range) into a single, normalized oscillator—making it suitable for a wide range of instruments and timeframes.
Traders can leverage the oscillator in multiple ways:
- By using the predefined levels (±2.5, ±5, ±7.5) to classify trend strength.
- By analyzing histogram patterns, such as spikes, fades, or clustering.
- Through divergence or continuation patterns, where oscillator behavior contradicts or confirms price action.
One of its key advantages is that each histogram bar reflects the behavior of a single candle, not a smoothed average. This allows for faster signal response and more accurate candle-by-candle analysis.
Zero Line Crossovers
- A crossover above zero signals that the Parabolic SAR has flipped below price, indicating a potential bullish reversal or continuation.
- A crossover below zero reflects a bearish shift, as the PSAR moves above the price, similar to how traditional PSAR functions.
In summary, the Parafrac Oscillator bridges the gap between volatility and trend analysis, allowing traders a clear, flexible, and visually intuitive tool for identifying opportunities and managing risk. Whether used as a standalone indicator or as part of a broader strategy, it empowers traders to read the market with greater precision and confidence.
Warning: All rights to these materials are reserved by MetaQuotes Ltd. Copying or reprinting of these materials in whole or in part is prohibited.
This article was written by a user of the site and reflects their personal views. MetaQuotes Ltd is not responsible for the accuracy of the information presented, nor for any consequences resulting from the use of the solutions, strategies or recommendations described.
 From Basic to Intermediate: Definitions (II)
 Neural Networks in Trading: Parameter-Efficient Transformer with Segmented Attention (Final Part)
 From Basic to Intermediate: Overload
 From Basic to Intermediate: Definitions (I)
- Free trading apps
- Over 8,000 signals for copying
- Economic news for exploring financial markets
You agree to website policy and terms of use
New article Parafrac oscillator: Combination of parabolic and fractal indicator:
Author: Daniel Opoku
Hello,
Looks cleanly programmed but unfortunately I don't see the added value.
The indicator shows exactly the same as if I would only use a stand-alone parabolic SAR. Unfortunately I can't see any difference in effect due to the influence of the Fractal indicator ?
Can you show me an example ?
Chris