Learn how to design a trading system by Chaikin Oscillator
Introduction
Here is a new article that completes our series about learning how to design a trading system by the most popular technical indicators because we will learn how to do that using a new technical indicator which is the Chaikin Oscillator.
We will learn about this technical indicator in detail through the following topics:
- Chaikin Oscillator definition
- Chaikin Oscillator strategy
- Chaikin Oscillator strategy blueprint
- Chaikin Oscillator trading system
- Conclusion
Through the previous topics, we will learn how to create and design a trading system by the Chaikin Oscillator step-by-step. We will learn what is the Chaikin Oscillator indicator, what it measures, how we can calculate it manually to know the main concept behind it, and all of that we learn through the Chaikin Oscillator definition topic. We learn how we can use this indicator through simple strategies based on the basic concept behind it through the topic of the Chaikin Oscillator strategy. After that, we will create a step-by-step blueprint for each mentioned strategy to help us to create a trading system for each of them smoothly through the topic of the Chaikin Oscillator strategy blueprint. After that, we will create a trading system for each mentioned strategy to execute it and get signals automatically by the MetaTrader 5 and this will be through the Chaikin Oscillator trading system topic.
We will use the MQL5 (MetaQuotes Language) to write the code of the trading strategy to execute it in the MetaTrader 5 to give us signals automatically. If you want how to download and use MetaTrader 5 to use MQL5, you can read the topic of Writing MQL5 in MetaEditor from a previous article.
Now, let us start our article with our topics.
Chaikin Oscillator definition
In this part, we will learn in detail about the Chaikin Oscillator indicator as we will learn what will let us understand the basic concept behind the indicator. The Chaikin Oscillator indicator is a momentum indicator, it is created by Marc Chaikin and it is very clear that the indicator is named for its creator. It measures the momentum of the accumulation distribution line using the moving average convergence divergence (MACD) formula. By measuring this momentum we can get insights into directional changes in the accumulation distribution line.
If we want to calculate the Chaikin Oscillator manually to understand more of the concept behind it, we can do that through the following steps:
- Calculating the money flow multiplier = ((close - low) - (high - close))/(high - low)
- Calculating money flow volume = money flow multiplier * volume
- Calculating Accumulation Distribution Line (ADL) = previous ADL + current money flow volume
- Chaikin Oscillator = (3-periods EMA of ADL) - (10-periods EMA of ADL)
Nowadays, we do not need to calculate the indicator manually as you can simply insert it into the chart as it is built-in in the MetaTrader 5. All you want to do is to choose it from the available indicators but here we learn how we can do that to learn the main concept behind it.
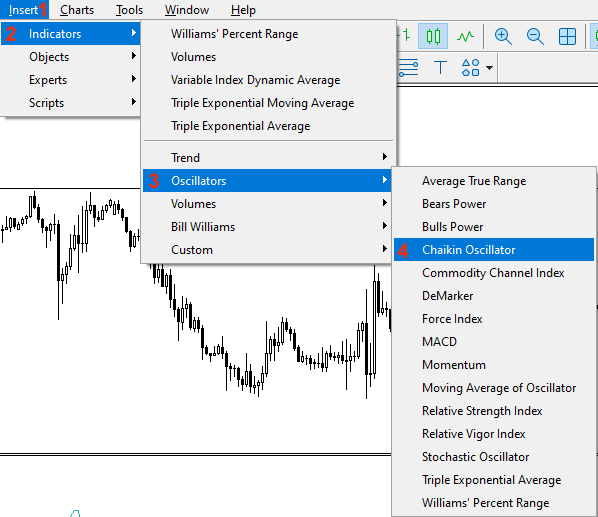
We can insert it into the chart by clicking on the Insert tab in the MetaTrader 5 --> Indicators --> Oscillators --> Chaikin Oscillator. The following picture is for these steps:
After choosing the Chaikin Oscillator indicator, we will find the window of parameters of the indicator the same as the following:
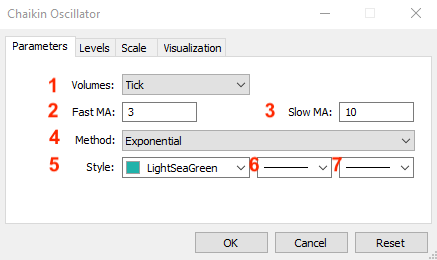
1- To determine the type of volume.
2- To determine the period of fast moving average.
3- To determine the period of slow moving average.
4- To determine the type of moving average.
5- To determine the color of the indicator's line.
6- To determine the indicator's line type.
7- To determine the indicator's line thickness.
After determining the previous parameters and pressing "OK", we will find the indicator is inserted into the chart the same as the following:
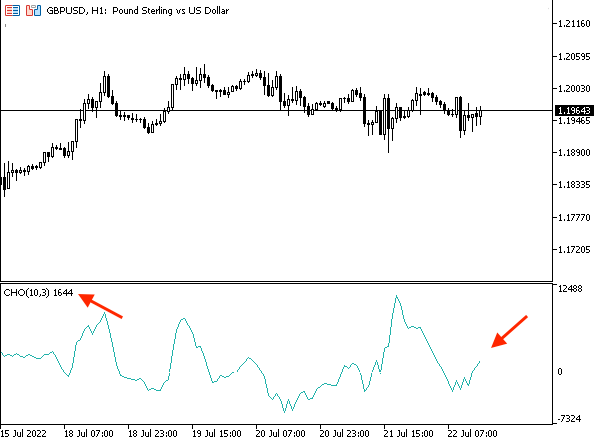
As we can see that the indicator is inserted in the lower part of the previous picture and it shows that the indicator line is oscillating above and below zero level.
Chaikin Oscillator strategy
In this topic, we will learn simple strategies to use the Chaikin Oscillator indicator based on its main concept. It will be a good approach when we think about how we can use another technical tool to enhance and give more weight to our decision and this is one of the features of using technical analysis. What I need to confirm here also is to make sure to test any strategy before using it on your real account to make sure that it will be suitable for you especially if you learned it through an educational subject like here.
- Strategy one: Chaikin Oscillator Crossover:
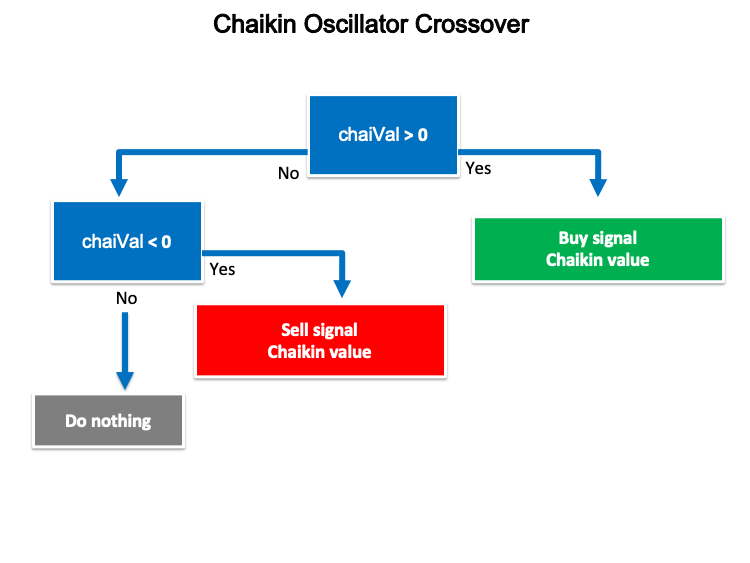
According to this strategy, we need to get buy or sell signals based on the crossover between the current Chaikin value and the zero level. When the current Chaikin value became above zero level, this will be a buy signal. In the other scenario, when the current Chaikin value became below zero level, this will be a sell signal.
Simply,
The current Chaikin value > zero level --> buy signal.
The current Chaikin value < zero level --> sell signal.
- Strategy two: Chaikin Oscillator Movement:
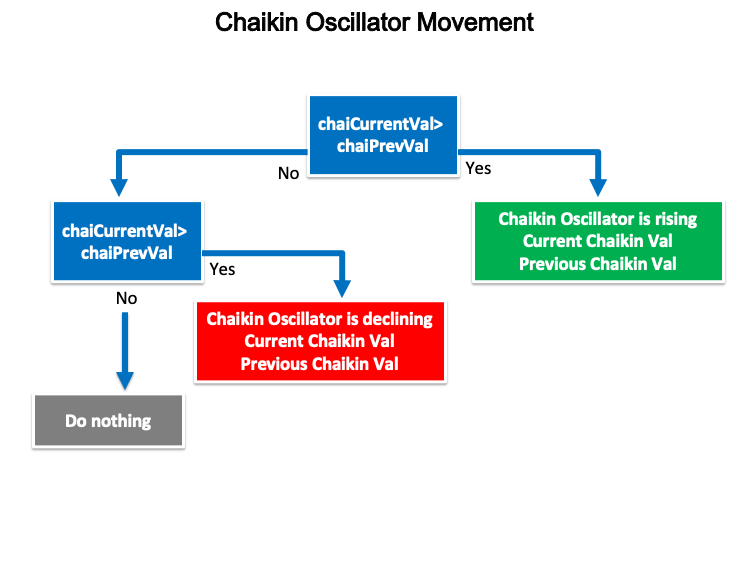
According to this strategy, we need to get a signal with the movement of the Chaikin indicator curve based on the last two values. When the current Chaikin value is greater than the previous value, this will be a signal of rising movement. Vice versa, when the current Chaikin value is lower than the previous value, this will be a signal of declining movement.
Simple,
The current Chaikin value > the previous Chaikin value --> rising movement.
The current Chaikin value < the previous Chaikin value --> declining movement.
- Strategy three: Chaikin Oscillator - Uptrend:
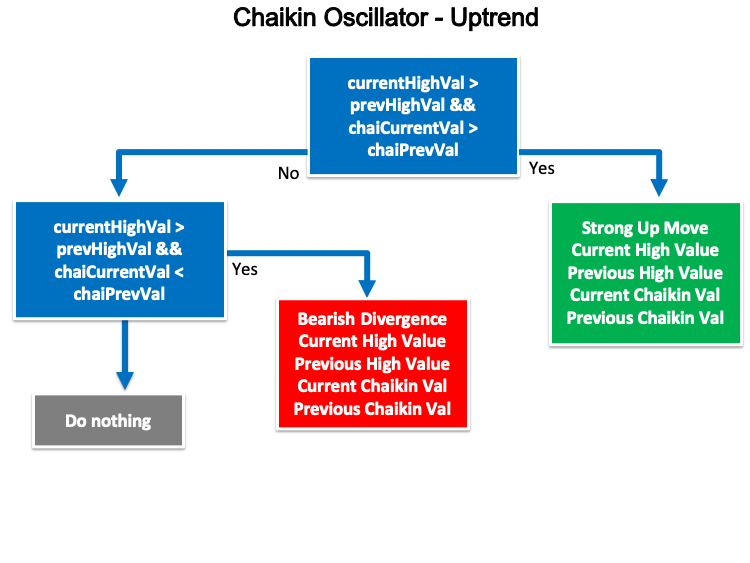
Based on this strategy, during the uptrend, we need to know if there is a strong up move or if there is a bearish divergence based on evaluating the current and previous high values and the current Chaikin and previous Chaikin values. If the current high is greater than the previous high and the current Chaikin is greater than the previous Chaikin value, this will be a signal of the strong up move during the uptrend. If the current high is greater than the previous high and the current Chaikin is lower than the previous Chaikin value, this will be a signal of Bearish divergence.
The current high > the previous high and the current Chaikin > the previous Chaikin --> Strong up move during the uptrend.
The current high > the previous high and the current Chaikin < the previous Chaikin --> Bearish divergence.
- Strategy four: Chaikin Oscillator - Downtrend:
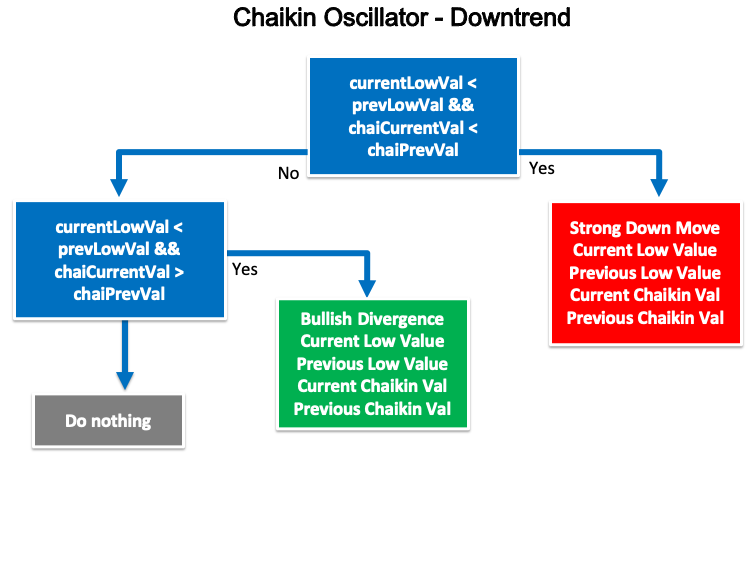
Based on this strategy, during the downtrend, we need to know if there is a strong down move or if there is a bullish divergence based on evaluating the current and previous low values and the current and previous Chaikin values. If the current low is lower than the previous low and the current Chaikin value is lower than the previous one, this will be a strong down move during the downtrend. If the current low is lower than the previous one and the current Chaikin is greater than the previous one, this will be a signal of bullish divergence.
The current low < the previous low and the current Chaikin < the previous Chaikin --> Strong down move during the downtrend.
The current low < the previous low and the current Chaikin > the previous Chaikin --> Bullish divergence.
Chaikin Oscillator strategy blueprint
In this topic, we will design a step-by-step blueprint to help us to create our trading system for every mentioned strategy and I believe that this step is very important as it will organize our ideas in a way that achieves our target. Now let us start doing that.
- Strategy one: Chaikin Oscillator Crossover:
According to this strategy, we need to create a trading system that returns a specific comment on the chart once a specific condition is met. we need the trading system to check the Chaikin oscillator value every tick and when this value became above the zero level, we need the trading system to appear on the chart a comment with a buy signal and the current Chaikin value each one in a separate line. In the other scenario, we need the trading system to return a comment with a sell signal and the current Chaikin value each one in a separate line when the Chaikin value became below the zero level.
The following is a picture of this blueprint.
- Strategy two: Chaikin Oscillator Movement:
Based on this strategy, we need the trading system to check two values and decide which one is bigger than the other every tick. These two values are the current and the previous Chaikin oscillator. When the current value is greater than the previous, we need the trading system to return a comment with: Chaikin Oscillator is rising, current Chaikin Val, previous Chaikin Val each one in a separate line. When the current value is lower than the previous, we need the trading system to return a comment with: Chaikin Oscillator is declining, current Chaikin Val, previous Chaikin Val.
The following is a picture of a blueprint of this strategy.
- Strategy three: Chaikin Oscillator - Uptrend:
According to this strategy, we need the trading system to check four values every tick and they are the current high, the previous high, the current Chaikin, and previous Chaikin. We need the trading system after checking these values to decide which one is greater than the other between current and previous highs and between current and previous Chaikin values. When the current high is greater than the previous high and the current Chaikin is greater than the previous Chaikin value, we need the trading system to return a comment with a strong up move during the uptrend, current high value, previous high value, current Chaikin value, and previous Chaikin value each value in a separate line. In the other scenario, when the current high is greater than the previous high and the current Chaikin is lower than the previous Chaikin value, we need the trading system to return comment on the chart with bearish divergence, current high value, previous high value, current, Chaikin value, previous Chaikin value each value in a separate line.
The following is a picture of the blueprint of this strategy.
- Strategy four: Chaikin Oscillator - Downtrend:
Based on this strategy, we need to create a trading system that continuously checks four values every tick and these values are the current low value, the previous low value, the current chaikin value, and the previous chaikin value and then decide if the current low value is lower than the previous low value and the current chaikin value is lower than the previous chaikin value, we need the trading system to return comment on the chart with a strong down move, current low value, previous low value, current Chaikin value, and previous Chaikin value each value in a separate line. The other scenario to detect the divergence, when the current low value is lower than the previous low value and the current chaikin value is greater than the previous chaikin value, we need the trading system to return a comment with bullish divergence, current low value, previous low value, current Chaikin value, and previous Chaikin value each value in a separate line.
The following picture is of this blueprint.
Chaikin Oscillator is rising
Chaikin Oscillator trading system
In this part, we will learn how to turn mentioned strategies into a trading system to work automatically by programming or coding by MQL5. So, now we will start to code a simple trading system to appear the Chaikin Oscillator current value on the chart as a comment automatically and we will use this trading system as a base for our mentioned strategies. The following is for creating this trading system.
- Creating an array of the Chaikin Oscillator by using the "double" function which represents fractional values. double is one of the floating-point types which is one of the data types.
double chaiArray[]; - Sorting this created array from the current data and we will do that by using the "ArraySetAsSeries" function which returns a boolean value. Parameters of the "ArraySetAsSeries" are:
- An array[]
- Flag
ArraySetAsSeries(chaiArray,true);
- Creating an integer variable of the chaiDef to define the Chaikin Oscillator by using the "iChaikin" function. This function returns the handle of the Chaikin Oscillator indicator. Parameters of this function are:
- symbol, to set the symbol name, we will specify "_Symbol" to be applied on the current chart.
- period, to set the time frame, we will specify "_Period" to be applied to the current time frames.
- fast_ma_period, to set the fast-moving average length, we will set 3 as a default.
- slow_ma_period, to set the slow-moving average length, we will set 10 as a default.
- ma_method, to determine the type of moving average, we will use the exponential moving average(MODE_EMA).
- applied_volume, to determine the type of volume, we will use the tick volume (VOLUME_TICK).
int chaiDef = iChaikin(_Symbol,_Period,3,10,MODE_EMA,VOLUME_TICK);
- Copying price data to the array of chaiArray by using the "CopyBuffer" function which returns the copied data count or -1 if there is an error. Parameters of this function are:
- indicator_handle, we will specify the indicator Definition "chaiDef".
- buffer_num, to set the indicator buffer number, we will set 0.
- start_pos, to set the start position, we will set 0.
- count, to set the amount to copy, we will set 3.
- buffer[], to determine the target array to copy, we will determine "chaiArray".
CopyBuffer(chaiDef,0,0,3,chaiArray);
- Getting the Chaikin Oscillator value by using the "NormalizeDouble" function a double type after creating a double variable of "chaiVal". Parameters of the "Normalizedouble" are:
- value, to determine the normalized number, we will specify "chaiArray[0]", we will use 0 to return the current value
- digits, to determine the number of digits after the decimal point, we will determine 6.
int chaiVal = NormalizeDouble(chaiArray[0],6);
- Using the comment function to return the current Chaikin Oscillator value as a comment on the chart.
Comment("Chaikin Oscillator Value is ",chaiVal);
The following is the full code to create this simple trading system.
//+------------------------------------------------------------------+
//|                                    Simple Chaikin Oscillator.mq5 |
//|                                  Copyright 2022, MetaQuotes Ltd. |
//|                                             https://www.mql5.com |
//+------------------------------------------------------------------+
#property copyright "Copyright 2022, MetaQuotes Ltd."
#property link      "https://www.mql5.com"
#property version   "1.00"
//+------------------------------------------------------------------+
void OnTick()
  {
   double chaiArray[];

   ArraySetAsSeries(chaiArray,true);

   int chaiDef = iChaikin(_Symbol,_Period,3,10,MODE_EMA,VOLUME_TICK);

   CopyBuffer(chaiDef,0,0,3,chaiArray);

   int chaiVal = NormalizeDouble(chaiArray[0],6);

   Comment("Chaikin Oscillator Value is ",chaiVal);

  }
//+------------------------------------------------------------------+
After compiling this code, we can find the file of this program in the navigator window in the Expert Advisors folder the same as the following.
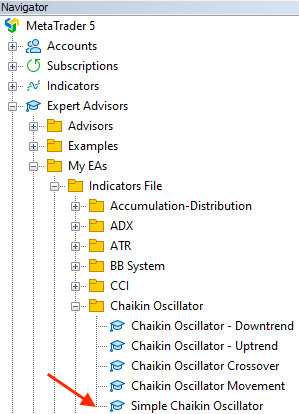
When we need to execute this expert advisor, we will drag and drop it on the chart after that the following window of the program will appear the same as the following.
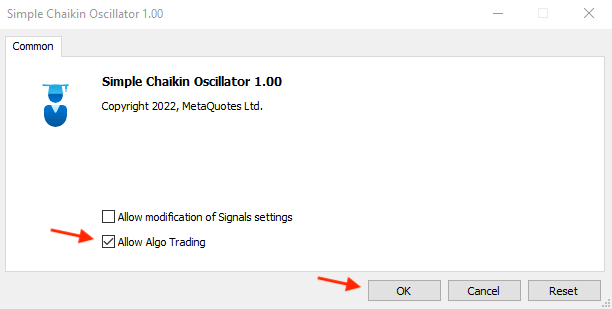
After pressing "OK", the expert advisor will be attached to the chart the same as the following.
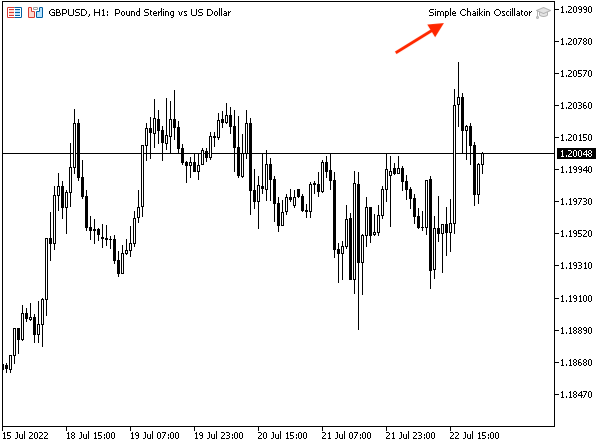
As we can see in the top right corner of the previous chart, the expert is attached to the chart. Then, we can find generated signals the same as the following.
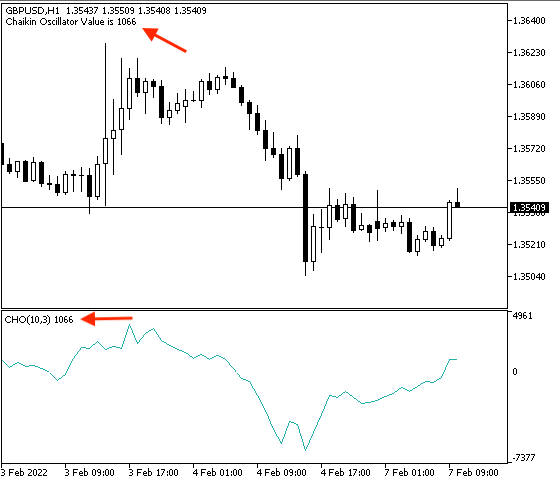
As we can see in the previous example from testing, in the top left corner of the chart we have a comment with the current Chaikin Oscillator value. If we want to make sure that the generated value will be the same as the generated value from the built-in indicator in the MetaTrader5, we can insert the built-in indicator with the parameters after attaching the expert advisor and we will find values of both the same as the following.
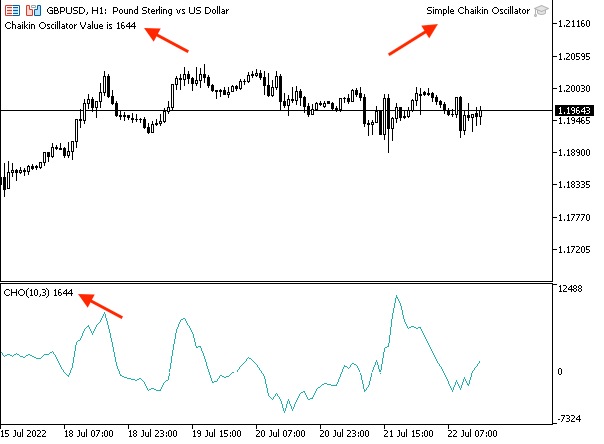
As we can see in the right corner of the chart the expert advisor is attached to the chart and in the left corner, we can find the generated value according to the expert which is the same as the value of the inserted indicator in the below window.
- Strategy one: Chaikin Oscillator Crossover:
The following is for the full code to create a trading system based on this strategy.
//+------------------------------------------------------------------+
//|                                 Chaikin Oscillator Crossover.mq5 |
//|                                  Copyright 2022, MetaQuotes Ltd. |
//|                                             https://www.mql5.com |
//+------------------------------------------------------------------+
#property copyright "Copyright 2022, MetaQuotes Ltd."
#property link      "https://www.mql5.com"
#property version   "1.00"
//+------------------------------------------------------------------+
void OnTick()
  {
   double chaiArray[];

   ArraySetAsSeries(chaiArray,true);

   int chaiDef = iChaikin(_Symbol,_Period,3,10,MODE_EMA,VOLUME_TICK);

   CopyBuffer(chaiDef,0,0,3,chaiArray);

   int chaiVal = NormalizeDouble(chaiArray[0],6);

   if(chaiVal>0)
   {
   Comment("Buy signal","\n","Chaikin Oscillator Value is ",chaiVal);
   }

   if(chaiVal<0)
   {
   Comment("Sell signal","\n","Chaikin Oscillator Value is ",chaiVal);
   }

  }
//+------------------------------------------------------------------+
Differences in this code:
Conditions of the Chaikin Oscillator Crossover:
In case of a buy signal,
   if(chaiVal>0)
   {
   Comment("Buy signal","\n","Chaikin Oscillator Value is ",chaiVal);
   }
In case of a sell signal,
   if(chaiVal<0)
   {
   Comment("Sell signal","\n","Chaikin Oscillator Value is ",chaiVal);
   }
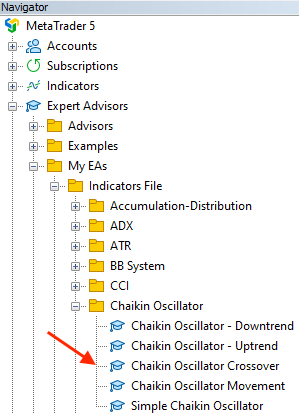
After compiling this code, we will find the file of the Expert Advisor in the navigator window the same as the following.
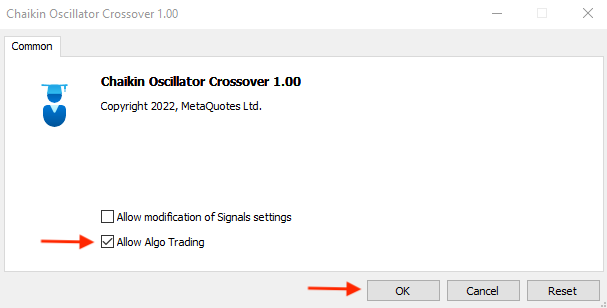
After dragging and dropping it on the chart, the window of the expert will appear the same as follows:
After pressing "OK", the expert will be attached to the chart the same as the following:
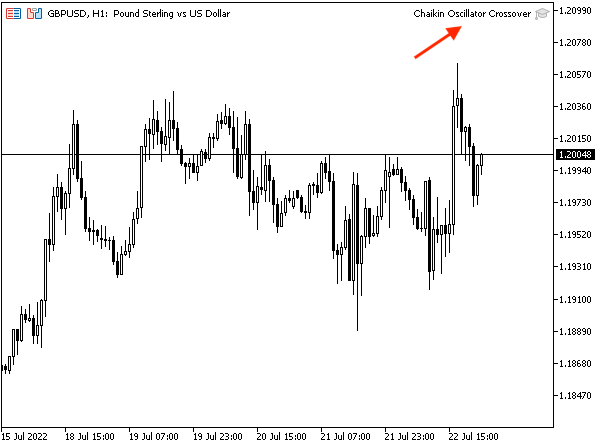
As we can see in the top right corner that the Chaikin Oscillator Crossover expert is attached to the chart and now we can see generated signals according to this strategy. The following is an example.
In case of a buy signal,
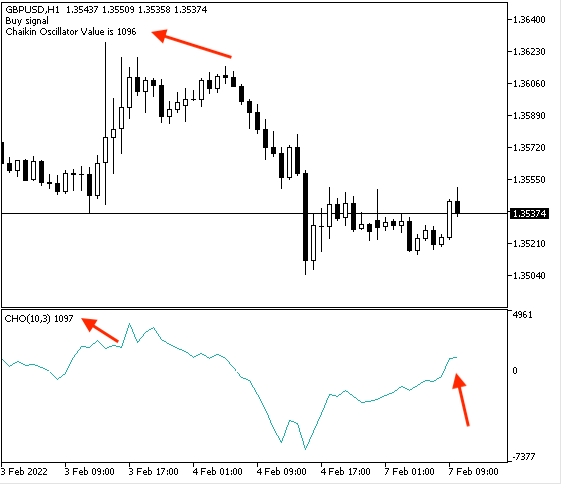
As we can see in the top left corner of the chart the buy signal was generated when the Chaikin Oscillator value crossed above the zero level.
In case of a sell signal,
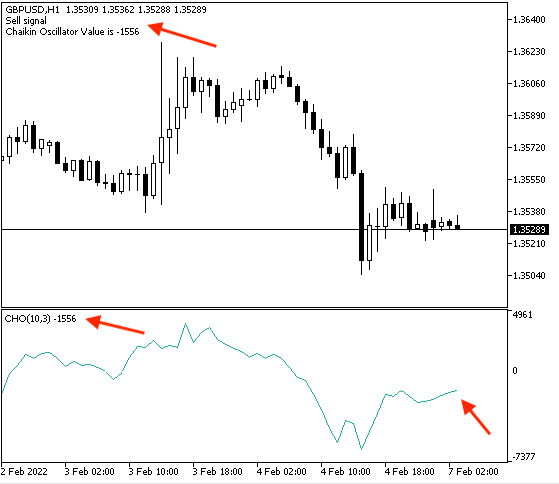
As we can see on the top left corner of the chart, the sell signal was generated as the Chaikin Oscillator value crossed below the zero level.
- Strategy two: Chaikin Oscillator movement:
The following is the full code to create a trading system based on this strategy.
//+------------------------------------------------------------------+
//|                                  Chaikin Oscillator Movement.mq5 |
//|                                  Copyright 2022, MetaQuotes Ltd. |
//|                                             https://www.mql5.com |
//+------------------------------------------------------------------+
#property copyright "Copyright 2022, MetaQuotes Ltd."
#property link      "https://www.mql5.com"
#property version   "1.00"
//+------------------------------------------------------------------+
void OnTick()
  {
   double chaiArray[];

   ArraySetAsSeries(chaiArray,true);

   int chaiDef = iChaikin(_Symbol,_Period,3,10,MODE_EMA,VOLUME_TICK);

   CopyBuffer(chaiDef,0,0,3,chaiArray);

   int chaiCurrentVal = NormalizeDouble(chaiArray[0],6);
   int chaiPrevVal = NormalizeDouble(chaiArray[1],6);

   if(chaiCurrentVal>chaiPrevVal)
     {
      Comment("Chaikin Oscillator is rising","\n",
              "Chaikin Oscillator Cuurent Value is ",chaiCurrentVal,"\n",
              "Chaikin Oscillator Previous Value is ",chaiPrevVal);
     }

   if(chaiCurrentVal<chaiPrevVal)
     {
      Comment("Chaikin Oscillator is declining","\n",
              "Chaikin Oscillator Cuurent Value is ",chaiCurrentVal,"\n",
              "Chaikin Oscillator Previous Value is ",chaiPrevVal);
     }

  }
//+------------------------------------------------------------------+
Differences in this code are the same as the following:
Defining current and previous Chaikin Oscillator values.
   int chaiCurrentVal = NormalizeDouble(chaiArray[0],6);
   int chaiPrevVal = NormalizeDouble(chaiArray[1],6);
Conditions of the strategy.
In case of rising,
   if(chaiCurrentVal>chaiPrevVal)
     {
      Comment("Chaikin Oscillator is rising","\n",
              "Chaikin Oscillator Current Value is ",chaiCurrentVal,"\n",
              "Chaikin Oscillator Previous Value is ",chaiPrevVal);
     }
In case of declining,
   if(chaiCurrentVal<chaiPrevVal)
     {
      Comment("Chaikin Oscillator is declining","\n",
              "Chaikin Oscillator Current Value is ",chaiCurrentVal,"\n",
              "Chaikin Oscillator Previous Value is ",chaiPrevVal);
     }
After compiling this code we will find it in the navigator window the same as the following:
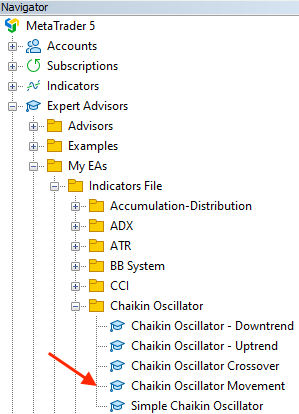
After dragging and dropping the expert on the chart, we will find the window of the program the same as follows:
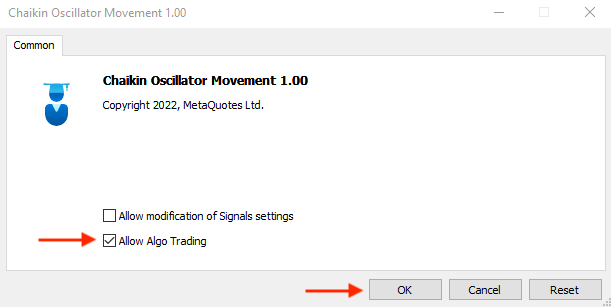
After pressing "OK", we will find it attached to the chart the same as the following:
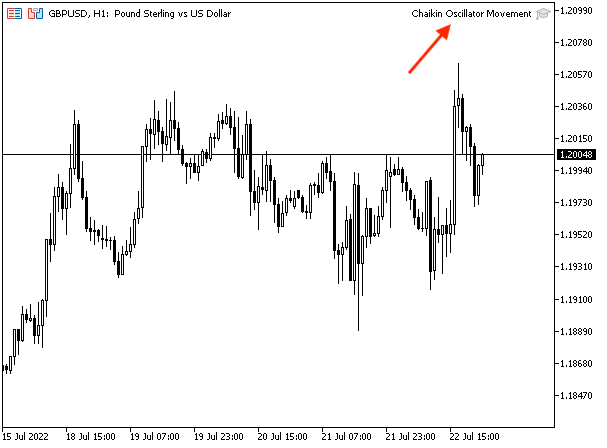
The following are examples of generated signals based on this strategy.
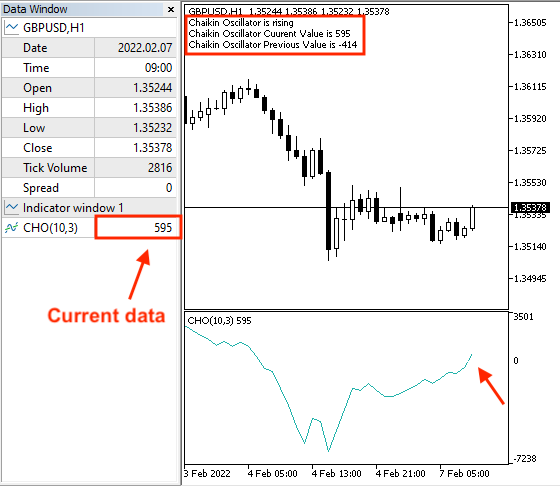
In case of rising with current data:
In case of rising with previous data,
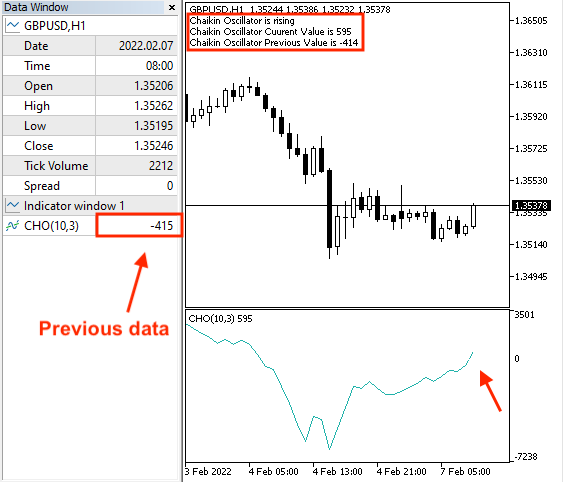
As we can see in the previous charts in the top left corner we have three lines:
- Chaikin Oscillator is rising
- Chaikin Oscillator current value
- Chaikin Oscillator previous value
The other scenario in case of declining with current data,
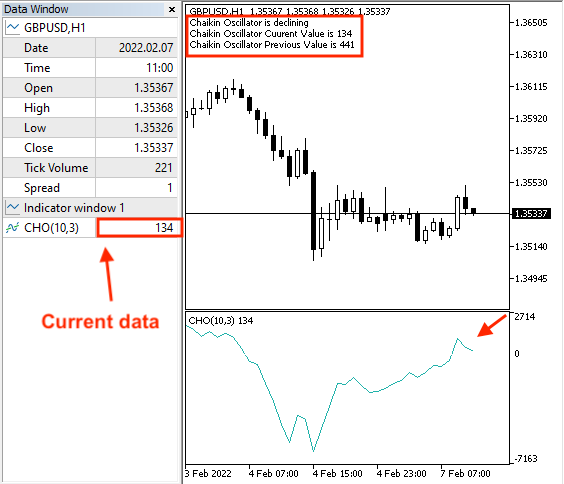
In case of decline with previous data,
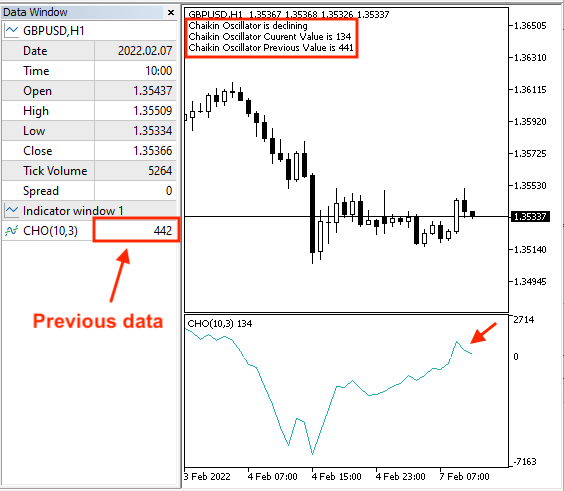
As we can see in the previous charts that we have a comment on the chart in the top left corner:
Chaikin Oscillator is declining.
Chaikin Oscillator current value.
Chaikin Oscillator previous value.
- Strategy three: Chaikin Oscillator - Uptrend:
The following is for the full code to create a trading system according to this strategy:
//+------------------------------------------------------------------+
//|                                 Chaikin Oscillator - Uptrend.mq5 |
//|                                  Copyright 2022, MetaQuotes Ltd. |
//|                                             https://www.mql5.com |
//+------------------------------------------------------------------+
#property copyright "Copyright 2022, MetaQuotes Ltd."
#property link      "https://www.mql5.com"
#property version   "1.00"
//+------------------------------------------------------------------+
void OnTick()
  {
   double chaiArray[];
   MqlRates priceArray[];

   ArraySetAsSeries(chaiArray,true);
   int Data=CopyRates(_Symbol,_Period,0,3,priceArray);

   int chaiDef = iChaikin(_Symbol,_Period,3,10,MODE_EMA,VOLUME_TICK);

   CopyBuffer(chaiDef,0,0,3,chaiArray);

   int chaiCurrentVal = NormalizeDouble(chaiArray[0],6);
   int chaiPrevVal = NormalizeDouble(chaiArray[1],6);


   double currentHighVal=NormalizeDouble(priceArray[2].high,6);
   double prevHighVal=NormalizeDouble(priceArray[1].high,6);

   if(currentHighVal>prevHighVal&&chaiCurrentVal>chaiPrevVal)
     {
      Comment("Strong Up Move During The Uptrend","\n",
              "Current High Value is: ",currentHighVal,"\n",
              "Previous High Value is: ",prevHighVal,"\n",
              "Chaikin Oscillator Current Value is ",chaiCurrentVal,"\n",
              "Chaikin Oscillator Previous Value is ",chaiPrevVal);
     }


   if(currentHighVal>prevHighVal&&chaiCurrentVal<chaiPrevVal)
     {
      Comment("Bearish Divergence","\n",
              "Current High Value is: ",currentHighVal,"\n",
              "Previous High Value is: ",prevHighVal,"\n",
              "Chaikin Oscillator Current Value is ",chaiCurrentVal,"\n",
              "Chaikin Oscillator Previous Value is ",chaiPrevVal);
     }

  }
//+------------------------------------------------------------------+
Differences in this code are the same as the following:
Creating two arrays for ChaiArray the same as we learned and the priceArray by using the "MqlRates" function which stores information about prices, volumes, and spread.
ArraySetAsSeries(chaiArray,true);
int Data=CopyRates(_Symbol,_Period,0,3,priceArray);
Defining values of the current and previous Chaikin Oscillator.
int chaiCurrentVal = NormalizeDouble(chaiArray[0],6);
int chaiPrevVal = NormalizeDouble(chaiArray[1],6);
Defining values of the current and previous highs.
double currentHighVal=NormalizeDouble(priceArray[2].high,6);
double prevHighVal=NormalizeDouble(priceArray[1].high,6);
Conditions of this strategy:
In case of a strong move during the uptrend:
   if(currentHighVal>prevHighVal&&chaiCurrentVal>chaiPrevVal)
     {
      Comment("Strong Up Move During The Uptrend","\n",
              "Current High Value is: ",currentHighVal,"\n",
              "Previous High Value is: ",prevHighVal,"\n",
              "Chaikin Oscillator Current Value is ",chaiCurrentVal,"\n",
              "Chaikin Oscillator Previous Value is ",chaiPrevVal);
     }
In case of the bearish divergence:
   if(currentHighVal>prevHighVal&&chaiCurrentVal<chaiPrevVal)
     {
      Comment("Bearish Divergence","\n",
              "Current High Value is: ",currentHighVal,"\n",
              "Previous High Value is: ",prevHighVal,"\n",
              "Chaikin Oscillator Current Value is ",chaiCurrentVal,"\n",
              "Chaikin Oscillator Previous Value is ",chaiPrevVal);
     }
After compiling this code we will find it as an expert in the navigator the same as the following:
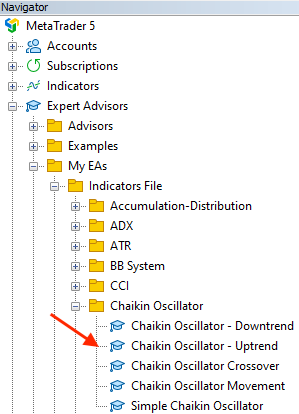
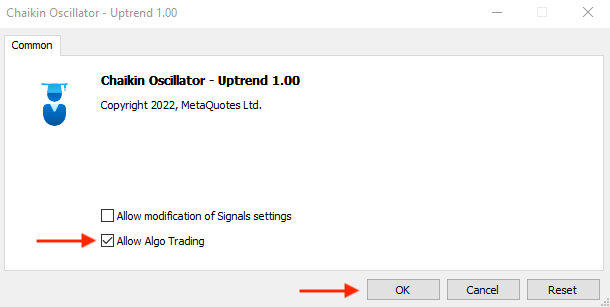
By dragging and dropping it on the chart the window of the expert will appear the same as follows:
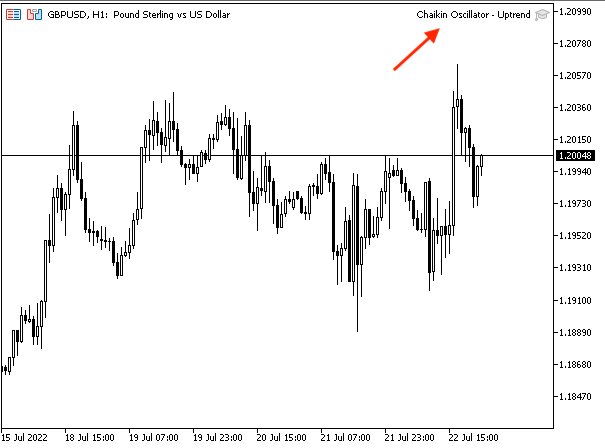
After pressing "Ok" we will find the expert is attached to the chart the same as the following:
The following are examples of generated signals based on this trading system.
In case of a strong move with the current data:
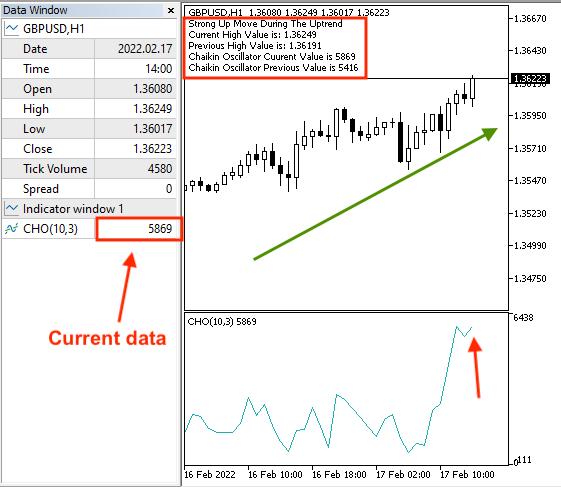
In case of a strong move with the previous data:
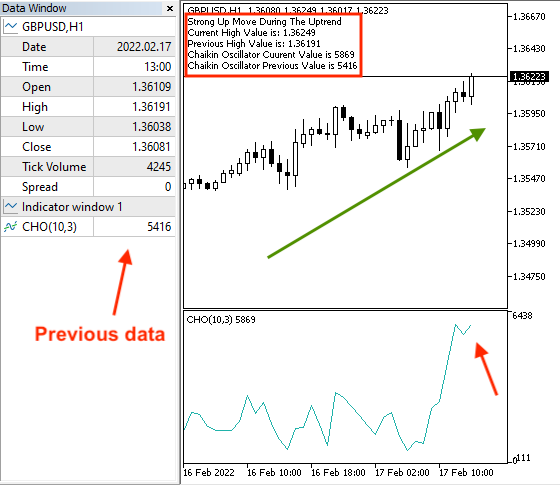
As we can see in the previous two charts that we have five lines of comments on the top left corner of the chart and they are:
- A strong up move during the uptrend
- The current high value
- The previous high value
- The current Chaikin valuue
- The previous Chaikin value
In the other scenario when we have a bearish divergence with current data we can see an example for this case the same as the following:
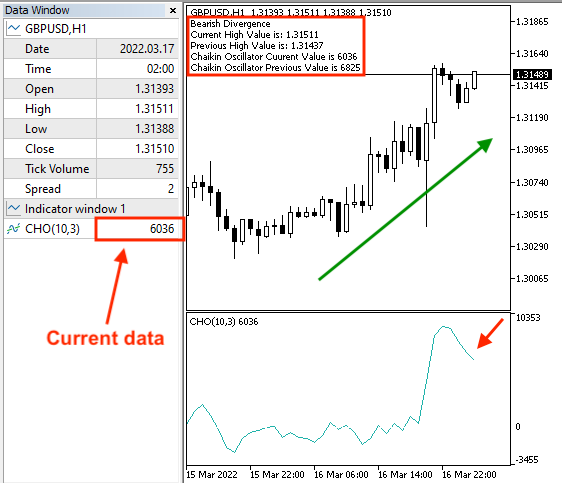
In case of bearish divergence with previous data
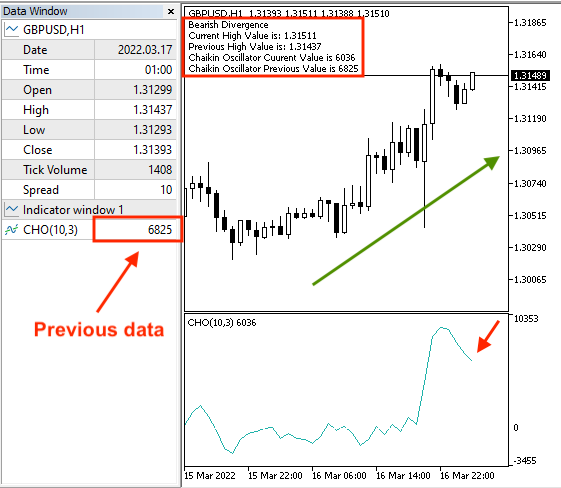
As we can see in the previous two charts we have a comment with five lines:
Bearish Divergence.
The current high value.
The previous high value.
The current Chaikin valuue.
The previous Chaikin value.
- Strategy four: Chaikin Oscillator - Downtrend:
The following is for the full code to create a trading system based on this strategy:
//+------------------------------------------------------------------+
//|                               Chaikin Oscillator - Downtrend.mq5 |
//|                                  Copyright 2022, MetaQuotes Ltd. |
//|                                             https://www.mql5.com |
//+------------------------------------------------------------------+
#property copyright "Copyright 2022, MetaQuotes Ltd."
#property link      "https://www.mql5.com"
#property version   "1.00"
//+------------------------------------------------------------------+
void OnTick()
  {
   double chaiArray[];
   MqlRates priceArray[];

   ArraySetAsSeries(chaiArray,true);
   int Data=CopyRates(_Symbol,_Period,0,3,priceArray);

   int chaiDef = iChaikin(_Symbol,_Period,3,10,MODE_EMA,VOLUME_TICK);

   CopyBuffer(chaiDef,0,0,3,chaiArray);

   int chaiCurrentVal = NormalizeDouble(chaiArray[0],6);
   int chaiPrevVal = NormalizeDouble(chaiArray[1],6);


   double currentLowVal=NormalizeDouble(priceArray[2].low,6);
   double prevLowVal=NormalizeDouble(priceArray[1].low,6);

   if(currentLowVal<prevLowVal&&chaiCurrentVal<chaiPrevVal)
     {
      Comment("Strong Down Move During The Downtrend","\n",
              "Current Low Value is: ",currentLowVal,"\n",
              "Previous Low Value is: ",prevLowVal,"\n",
              "Chaikin Oscillator Current Value is ",chaiCurrentVal,"\n",
              "Chaikin Oscillator Previous Value is ",chaiPrevVal);
     }


   if(currentLowVal<prevLowVal&&chaiCurrentVal>chaiPrevVal)
     {
      Comment("Bullish Divergence","\n",
              "Current Low Value is: ",currentLowVal,"\n",
              "Previous Low Value is: ",prevLowVal,"\n",
              "Chaikin Oscillator Current Value is ",chaiCurrentVal,"\n",
              "Chaikin Oscillator Previous Value is ",chaiPrevVal);
     }

  }
//+------------------------------------------------------------------+
Difference in this code is conditions of this strategy:
In case of a strong down move during the downtrend,
   if(currentLowVal<prevLowVal&&chaiCurrentVal<chaiPrevVal)
     {
      Comment("Strong Down Move During The Downtrend","\n",
              "Current Low Value is: ",currentLowVal,"\n",
              "Previous Low Value is: ",prevLowVal,"\n",
              "Chaikin Oscillator Current Value is ",chaiCurrentVal,"\n",
              "Chaikin Oscillator Previous Value is ",chaiPrevVal);
     }
In case of the bullish divergence:
   if(currentLowVal<prevLowVal&&chaiCurrentVal>chaiPrevVal)
     {
      Comment("Bullish Divergence","\n",
              "Current Low Value is: ",currentLowVal,"\n",
              "Previous Low Value is: ",prevLowVal,"\n",
              "Chaikin Oscillator Current Value is ",chaiCurrentVal,"\n",
              "Chaikin Oscillator Previous Value is ",chaiPrevVal);
     }
After compiling this code we will find the expert of this strategy in the navigator window the same as the following:
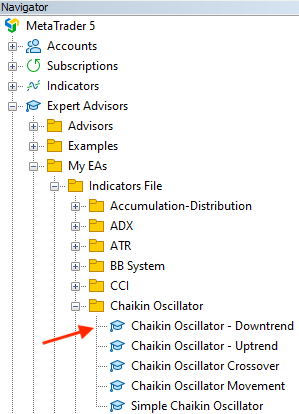
By dragging and dropping this expert on the chart we will find the window of this program the same as the following:
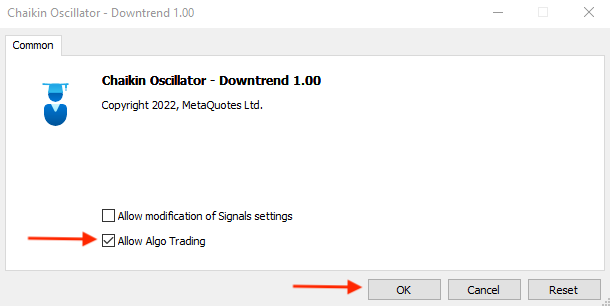
After pressing "OK" we will find the expert is attached to the chart the same as the following:
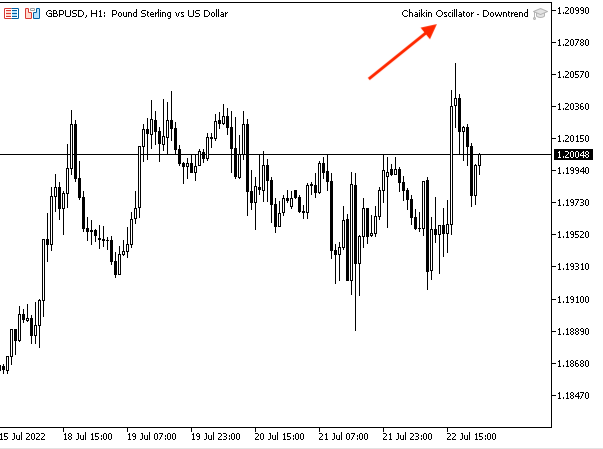
The following are examples of generated signals based on this strategy from testing:
In case of strong down during the downtrend with current data,
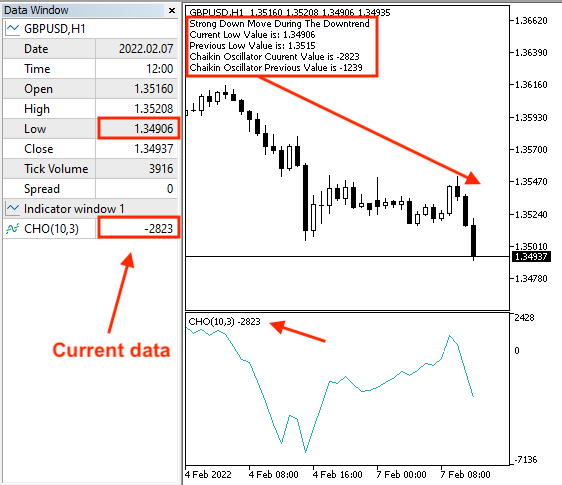
In case of strong down with previous data,
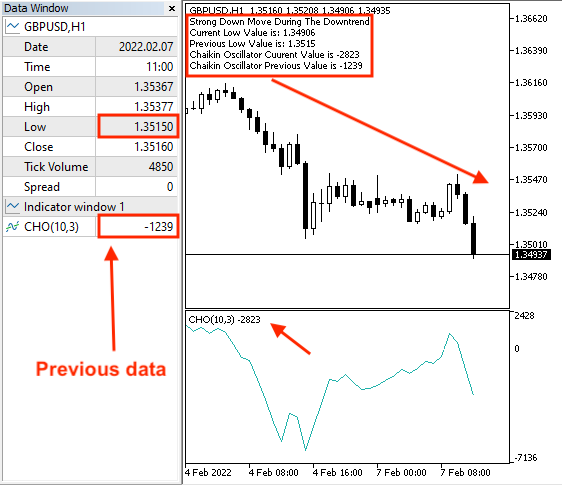
As we can see in the previous two charts we have a comment with five lines:
- Strong down move during the downtrend
- The current low value
- The previous low value
- The current Chaikin value
- The previous Chaikin value
In the other scenario of bullish divergence we can see examples of generated signals the same as the following:
In case of the bullish divergence with current data,
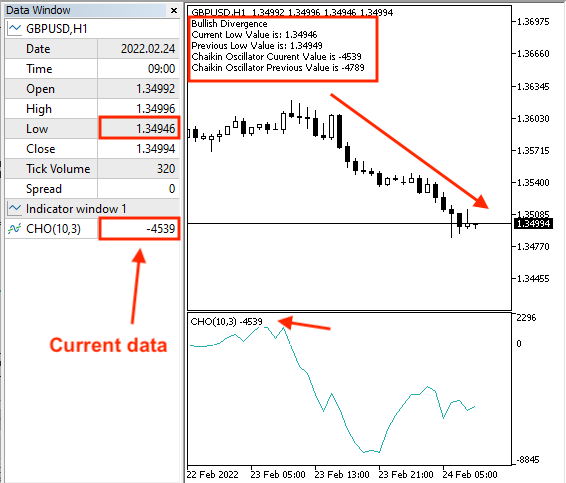
In case of bullish divergence with previous data,
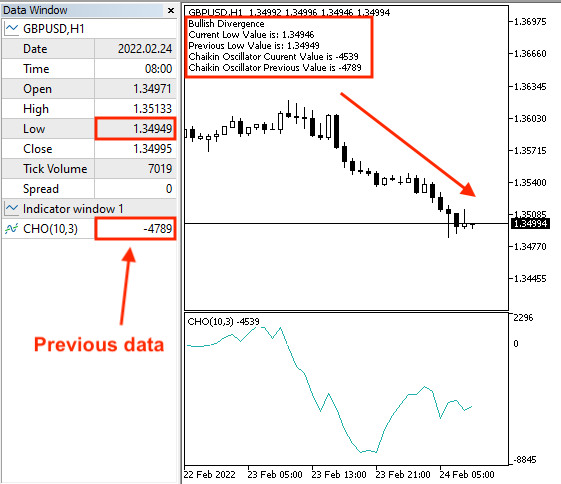
As we can see in the previous two charts we have a comment with five lines:
- Bullish divergence
- The current low value
- The previous low value
- The current Chaikin value
- The previous Chaikin value
Conclusion
After the previous topics, we learned about the Chaikin Oscillator in detail. We learned what it is, what it measures, how we can calculate it manually, and how we can use and insert the built-in MetaTrader 5 indicator. We learned also how we can use it simply based on the main concept of this indicator as we learned more than a strategy:
- Chaikin Oscillator Crossover: to get signals of buying and selling based on the zero-level crossover.
- Chaikin Oscillator Movement: to get signals of informing us the movement of the indicator line if it is rising or declining.
- Chaikin Oscillator - Uptrend: to get signals when we have a strong up move during the uptrend or if there is a bearish divergence.
- Chaikin Oscillator - Downtrend: to get signals when we have a strong down move during the downtrend or if there is a bullish divergence.
We designed also a blueprint for every strategy to help us to create a trading system for each of them as this is a very important step to organize our idea to achieve our objective smoothly. We learned how to create a trading system for every strategy to generate signals automatically after executing them in the MetaTrader 5 to ease and enhance our trading and get a better result in addition to saving our time.
I confirm again to make sure that you must test any strategy before using it on your real account as there is nothing suitable for everyone. What I need to focus on here also is to apply what you learn and practice by yourself if you need to improve your programming skills as practicing is an important factor in any learning and development path. I hope that you find this article useful for you and if you want to read more similar articles, you can read other articles in this series about how to design a trading system based on the most popular technical indicators.
Warning: All rights to these materials are reserved by MetaQuotes Ltd. Copying or reprinting of these materials in whole or in part is prohibited.
This article was written by a user of the site and reflects their personal views. MetaQuotes Ltd is not responsible for the accuracy of the information presented, nor for any consequences resulting from the use of the solutions, strategies or recommendations described.
 Developing a trading Expert Advisor from scratch (Part 18): New order system (I)
 Developing a trading Expert Advisor from scratch (Part 17): Accessing data on the web (III)
 Neural networks made easy (Part 17): Dimensionality reduction
 Data Science and Machine Learning (Part 06): Gradient Descent
- Free trading apps
- Over 8,000 signals for copying
- Economic news for exploring financial markets
You agree to website policy and terms of use