Articles with MQL5 programming examples
Access a huge collection of articles with code examples showing how to create indicators and trading robots for the MetaTrader platform in the MQL5 language. Source codes are attached to the articles, so you can open them in MetaEditor and run them to see how the applications work.
These articles will be useful both for those who have just started exploring automated trading and for professional traders with programming experience. They feature not only examples, but also contain new ideas.
Add a new article

You are missing trading opportunities:
- Free trading apps
- Over 8,000 signals for copying
- Economic news for exploring financial markets
Registration
Log in
You agree to website policy and terms of use
If you do not have an account, please register

Price Action Analysis Toolkit Development (Part 11): Heikin Ashi Signal EA
MQL5 offers endless opportunities to develop automated trading systems tailored to your preferences. Did you know it can even perform complex mathematical calculations? In this article, we introduce the Japanese Heikin-Ashi technique as an automated trading strategy.

Graphics in DoEasy library (Part 93): Preparing functionality for creating composite graphical objects
In this article, I will start developing the functionality for creating composite graphical objects. The library will support creating composite graphical objects allowing those objects have any hierarchy of connections. I will prepare all the necessary classes for subsequent implementation of such objects.

Population optimization algorithms: Harmony Search (HS)
In the current article, I will study and test the most powerful optimization algorithm - harmonic search (HS) inspired by the process of finding the perfect sound harmony. So what algorithm is now the leader in our rating?
Population optimization algorithms
This is an introductory article on optimization algorithm (OA) classification. The article attempts to create a test stand (a set of functions), which is to be used for comparing OAs and, perhaps, identifying the most universal algorithm out of all widely known ones.

DoEasy. Controls (Part 6): Panel control, auto resizing the container to fit inner content
In the article, I will continue my work on the Panel WinForms object and implement its auto resizing to fit the general size of Dock objects located inside the panel. Besides, I will add the new properties to the Symbol library object.

Dynamic Swing Architecture: Market Structure Recognition from Swings to Automated Execution
This article introduces a fully automated MQL5 system designed to identify and trade market swings with precision. Unlike traditional fixed-bar swing indicators, this system adapts dynamically to evolving price structure—detecting swing highs and swing lows in real time to capture directional opportunities as they form.

Price Action Analysis Toolkit Development (Part 7): Signal Pulse EA
Unlock the potential of multi-timeframe analysis with 'Signal Pulse,' an MQL5 Expert Advisor that integrates Bollinger Bands and the Stochastic Oscillator to deliver accurate, high-probability trading signals. Discover how to implement this strategy and effectively visualize buy and sell opportunities using custom arrows. Ideal for traders seeking to enhance their judgment through automated analysis across multiple timeframes.

DoEasy. Controls (Part 7): Text label control
In the current article, I will create the class of the WinForms text label control object. Such an object will have the ability to position its container anywhere, while its own functionality will repeat the functionality of the MS Visual Studio text label. We will be able to set font parameters for a displayed text.

Bill Williams Strategy with and without other indicators and predictions
In this article, we will take a look to one the famous strategies of Bill Williams, and discuss it, and try to improve the strategy with other indicators and with predictions.
Timeseries in DoEasy library (part 48): Multi-period multi-symbol indicators on one buffer in a subwindow
The article considers an example of creating multi-symbol multi-period standard indicators using a single indicator buffer for construction and working in the indicator subwindow. I am going to prepare the library classes for working with standard indicators working in the program main window and having more than one buffer for displaying their data.

Cycles and Forex
Cycles are of great importance in our lives. Day and night, seasons, days of the week and many other cycles of different nature are present in the life of any person. In this article, we will consider cycles in financial markets.

The Random Sandbox
The article includes an interactive "sandbox" as an Excel file which simulates randomized Expert Advisor backtest data. Readers can use this to help explore and more deeply understand the EA performance metrics offered by default with MetaTrader. The text of the article is designed to guide the user through this experience.

MT4TerminalSync - System for the Synchronization of MetaTrader 4 Terminals
This article is devoted to the topic "Widening possibilities of MQL4 programs by using functions of operating systems and other means of program development". The article describes an example of a program system that implements the task of the synchronization of several terminal copies based on a single source template.

MQL4 as a Trader's Tool, or The Advanced Technical Analysis
Trading is, first of all, a calculus of probabilities. The proverb about idleness being an engine for progress reveals us the reason why all those indicators and trading systems have been developed. It comes that the major of newcomers in trading study "ready-made" trading theories. But, as luck would have it, there are some more undiscovered market secrets, and tools used in analyzing of price movements exist, basically, as those unrealized technical indicators or math and stat packages. Thanks awfully to Bill Williams for his contribution to the market movements theory. Though, perhaps, it's too early to rest on oars.
Graphics in DoEasy library (Part 85): Graphical object collection - adding newly created objects
In this article, I will complete the development of the descendant classes of the abstract graphical object class and start implementing the ability to store these objects in the collection class. In particular, I will create the functionality for adding newly created standard graphical objects to the collection class.

Reimagining Classic Strategies (Part 16): Double Bollinger Band Breakouts
This article walks the reader through a reimagined version of the classical Bollinger Band breakout strategy. It identifies key weaknesses in the original approach, such as its well-known susceptibility to false breakouts. The article aims to introduce a possible solution: the Double Bollinger Band trading strategy. This relatively lesser known approach supplements the weaknesses of the classical version and offers a more dynamic perspective on financial markets. It helps us overcome the old limitations defined by the original rules, providing traders with a stronger and more adaptive framework.

Beginners' Mistakes when Working with MetaTrader 4 Client Terminal
Err is human. Everybody makes mistakes: more or less frequently, through ignorance or inadvertently. You ask and we answer your questions about: terminal time, test results, Print in journal, symbols, history for Tester, history import, leverage, traffic, hints, scaling, wrong calculations, Invalid account, Empty News, Price changed, Not Enough Money, Market Is Closed.

Reimagining Classic Strategies (Part 21): Bollinger Bands And RSI Ensemble Strategy Discovery
This article explores the development of an ensemble algorithmic trading strategy for the EURUSD market that combines the Bollinger Bands and the Relative Strength Indicator (RSI). Initial rule-based strategies produced high-quality signals but suffered from low trade frequency and limited profitability. Multiple iterations of the strategy were evaluated, revealing flaws in our understanding of the market, increased noise, and degraded performance. By appropriately employing statistical learning algorithms, shifting the modeling target to technical indicators, applying proper scaling, and combining machine learning forecasts with classical trading rules, the final strategy achieved significantly improved profitability and trade frequency while maintaining acceptable signal quality.
Graphics in DoEasy library (Part 100): Making improvements in handling extended standard graphical objects
In the current article, I will eliminate obvious flaws in simultaneous handling of extended (and standard) graphical objects and form objects on canvas, as well as fix errors detected during the test performed in the previous article. The article concludes this section of the library description.

Swing Extremes and Pullbacks in MQL5 (Part 2): Automating the Strategy with an Expert Advisor
Built on lower-timeframe market structure, and then orchestrated on the higher-timeframe, this indicator detects swing extremes where price becomes statistically vulnerable to reversal. It visualizes overextension and pullback zones, offering early insight into mean-reversion behavior.

Risk manager for manual trading
In this article we will discuss in detail how to write a risk manager class for manual trading from scratch. This class can also be used as a base class for inheritance by algorithmic traders who use automated programs.

From Novice to Expert: Enhancing Liquidity Strategies with Multi-Timeframe Structural Confirmation in MQL5
The alignment of higher-timeframe liquidity structures with lower-timeframe reversal patterns can greatly influence both the likelihood and direction of the next price movement. By integrating structural liquidity zones from higher timeframes with precise reversal confirmations on lower timeframes, traders can improve entry timing and overall trade quality. This article demonstrates how to reinforce liquidity-based trading strategies through higher-timeframe structural confirmation—and how to implement this approach effectively using MQL5.

Price Action Analysis Toolkit Development (Part 56): Reading Session Acceptance and Rejection with CPI
This article presents a session-based analytical framework that combines time-defined market sessions with the Candle Pressure Index (CPI) to classify acceptance and rejection behavior at session boundaries using closed-candle data and clearly defined rules.

Population optimization algorithms: Gravitational Search Algorithm (GSA)
GSA is a population optimization algorithm inspired by inanimate nature. Thanks to Newton's law of gravity implemented in the algorithm, the high reliability of modeling the interaction of physical bodies allows us to observe the enchanting dance of planetary systems and galactic clusters. In this article, I will consider one of the most interesting and original optimization algorithms. The simulator of the space objects movement is provided as well.

Color buffers in multi-symbol multi-period indicators
In this article, we will review the structure of the indicator buffer in multi-symbol, multi-period indicators and organize the display of colored buffers of these indicators on the chart.

Algorithmic Trading Without the Routine: Quick Trade Analysis in MetaTrader 5 with SQLite
The article presents a minimal working set for maintaining a trading journal in MQL5 using SQLite: a table structure for trades, signals, and events, indices, prepared statements and trades, as well as standard analytical SQL queries. Integration with the statistics dashboard in MetaTrader 5 and working with the database via MetaEditor are demonstrated. The approach allows automating the journal, accelerating calculations, and performing analysis without complicating the EA code.

Price Action Analysis Toolkit Development (Part 61): Structural Slanted Trendline Breakouts with 3-Swing Validation
We present a slanted trendline breakout tool that relies on three‑swing validation to generate objective, price‑action signals. The system automates swing detection, trendline construction, and breakout confirmation using crossing logic to reduce noise and standardize execution. The article explains the strategy rules, shows the MQL5 implementation, and reviews testing results; the tool is intended for analysis and signal confirmation, not automated trading.
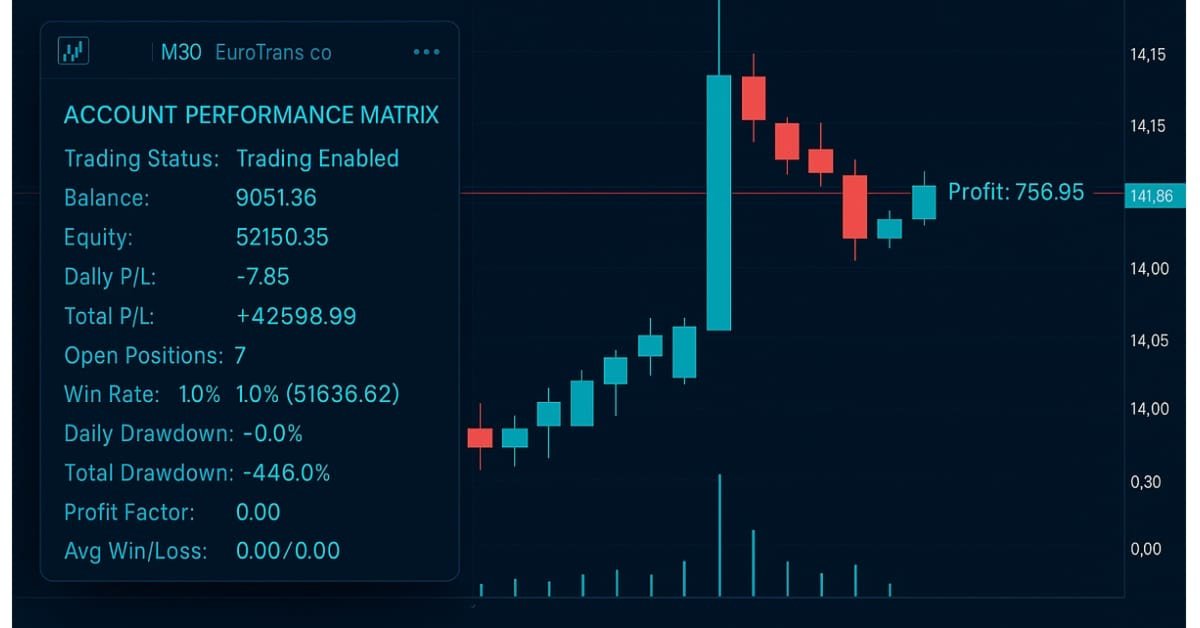
Developing A Custom Account Performance Matrix Indicator
This indicator acts as a discipline enforcer by tracking account equity, profit/loss, and drawdown in real-time while displaying a performance dashboard. It can help traders stay consistent, avoid overtrading, and comply with prop-firm challenge rules.

Implementing the Janus factor in MQL5
Gary Anderson developed a method of market analysis based on a theory he dubbed the Janus Factor. The theory describes a set of indicators that can be used to reveal trends and assess market risk. In this article we will implement these tools in mql5.

Сode Lock Algorithm (CLA)
In this article, we will rethink code locks, transforming them from security mechanisms into tools for solving complex optimization problems. Discover the world of code locks viewed not as simple security devices, but as inspiration for a new approach to optimization. We will create a whole population of "locks", where each lock represents a unique solution to the problem. We will then develop an algorithm that will "pick" these locks and find optimal solutions in a variety of areas, from machine learning to trading systems development.

Creating a Trading Administrator Panel in MQL5 (Part I): Building a Messaging Interface
This article discusses the creation of a Messaging Interface for MetaTrader 5, aimed at System Administrators, to facilitate communication with other traders directly within the platform. Recent integrations of social platforms with MQL5 allow for quick signal broadcasting across different channels. Imagine being able to validate sent signals with just a click—either "YES" or "NO." Read on to learn more.

From Novice to Expert: Auto-Geometric Analysis System
Geometric patterns offer traders a concise way to interpret price action. Many analysts draw trend lines, rectangles, and other shapes by hand, and then base trading decisions on the formations they see. In this article, we explore an automated alternative: harnessing MQL5 to detect and analyze the most popular geometric patterns. We’ll break down the methodology, discuss implementation details, and highlight how automated pattern recognition can sharpen a trader's market insights.

Developing a Custom Market Sentiment Indicator
In this article we are developing a custom market sentiment indicator to classify conditions into bullish, bearish, risk-on, risk-off, or neutral. Using multi-timeframe, the indicator can provide traders with a clearer perspective of overall market bias and short-term confirmations.

Formulating Dynamic Multi-Pair EA (Part 1): Currency Correlation and Inverse Correlation
Dynamic multi pair Expert Advisor leverages both on correlation and inverse correlation strategies to optimize trading performance. By analyzing real-time market data, it identifies and exploits the relationship between currency pairs.

DoEasy. Controls (Part 10): WinForms objects — Animating the interface
It is time to animate the graphical interface by implementing the functionality for object interaction with users and objects. The new functionality will also be necessary to let more complex objects work correctly.

Population optimization algorithms: Fish School Search (FSS)
Fish School Search (FSS) is a new optimization algorithm inspired by the behavior of fish in a school, most of which (up to 80%) swim in an organized community of relatives. It has been proven that fish aggregations play an important role in the efficiency of foraging and protection from predators.

Sending Trade Signal Via RSS Feed
This is my idea how to send your trade signal as RSS FEEDS , a famous way to communicate with your community's members right now.
Matrices and vectors in MQL5: Activation functions
Here we will describe only one of the aspects of machine learning - activation functions. In artificial neural networks, a neuron activation function calculates an output signal value based on the values of an input signal or a set of input signals. We will delve into the inner workings of the process.

Example of new Indicator and Conditional LSTM
This article explores the development of an Expert Advisor (EA) for automated trading that combines technical analysis with deep learning predictions.

MQL5 Trading Toolkit (Part 3): Developing a Pending Orders Management EX5 Library
Learn how to develop and implement a comprehensive pending orders EX5 library in your MQL5 code or projects. This article will show you how to create an extensive pending orders management EX5 library and guide you through importing and implementing it by building a trading panel or graphical user interface (GUI). The expert advisor orders panel will allow users to open, monitor, and delete pending orders associated with a specified magic number directly from the graphical interface on the chart window.