
From Novice to Expert: Enhancing Liquidity Strategies with Multi-Timeframe Structural Confirmation in MQL5

You repeatedly see the same failure mode: a technically perfect M1–M15 setup dies almost immediately because price has run into a higher‑timeframe liquidity level on H1/H4/daily. Manually monitoring multiple charts to confirm higher‑timeframe context is slow, error‑prone, and causes missed entries. We need an engineering solution with clear acceptance criteria: automatically detect liquidity zones on a chosen higher timeframe, project those zones onto the current chart, and generate a single, non‑repeating entry alert only when price returns into a zone and a formalized lower‑timeframe reversal condition is met. Inputs and constraints must be explicit (ZoneTimeframe, LookbackBars, RatioMultiplier, ExtendBars, permitted reversal patterns, and alert throttling).
To solve this, we adopt a layered architecture:
- Zone Detection — scan a selected HTF for base→impulse patterns using a configurable ratio to define supply/demand zones;
- Visual Layer — persistently draw rectangle objects on the current chart so zones remain visible across timeframe changes; (
- Reaction Monitoring — evaluate every closed lower‑timeframe bar for zone overlap and for one of a small, formalized set of reversal patterns (engulfing, pin bar, inside‑bar breakout).
Operationally the indicator uses a two‑pass OnCalculate: one pass to populate historical arrows for analysis, and a second pass to generate a single real‑time alert per zone using per‑zone triggered flags and alert throttling. The result is a clear, measurable tool that replaces noisy manual MTF checks with an automated, testable workflow.
Contents
Introduction
Multi-timeframe analysis isn't just about checking a "higher chart" to confirm direction—real context goes much deeper. It involves understanding how the broader market intent drives the smaller price moves you trade. The macro context shows you where large institutions have positioned themselves, where major liquidity zones exist, and what broader trend or sentiment dominates. The intraday context focuses on the developing structure of the day, whether the market is balanced or trending. And the micro context is your execution layer, where you watch real-time order flow, absorption, and traps.
In institutional trading, every layer of context influences the others. When the macro, intraday, and micro contexts all point in the same direction, you gain a statistical edge in your trades. However, when these contexts conflict—for example, a short setup on the 1-minute chart transitioning directly into a higher timeframe support area—the trade loses its edge even if it appears technically perfect.
This is where ICT-style Smart Money Concepts (SMC) come into play: liquidity zones are areas where institutional traders have positioned significant orders. These zones typically form around equal highs and lows, previous-day highs and lows, major-session highs and lows (London and New York sessions), and big round numbers. When the price trades into these liquidity pools—taking out equal highs, for example—it often reverses from a nearby order block or structural zone.
The concept is simple but powerful: price often sweeps liquidity (takes out stops and triggers breakout traders) before reversing from a structural level where institutions have placed their orders. Order blocks themselves are typically defined as the last opposite-colored candle (or small cluster) before a strong displacement move that breaks market structure. For a bullish order block, this means the last down candle before a strong move up that causes a bullish break of structure. For a bearish order block, it's the last up candle before a strong move down that causes a bearish break of structure.
What makes this approach particularly powerful is the concept of premium and discount zones. By drawing a Fibonacci retracement from swing low to swing high, the 50% line becomes the equilibrium. Below 50% is the discount zone (cheaper prices), while above 50% is the premium zone (more expensive prices). In a bullish context, you want to buy at a discount from a bullish order block. In a bearish context, you want to sell at a premium from a bearish order block.
With this framework in mind, I developed the original Liquidity Zone Indicator—a tool designed to automatically identify and visualize these critical zones directly on the chart. This foundational work, detailed in my previous article, "From Novice to Expert: Creating a Liquidity Zone Indicator," was built on a crucial quantitative insight: a measurable 3:1 relationship between the depth of a consolidation zone and the magnitude of the subsequent impulsive breakout.
Let's take a moment to examine the core logic from that original indicator, as it forms the basis of our current discussion:
//+------------------------------------------------------------------+
//|                                         Liquidity Zone Indicator |
//|                                Copyright © 2026 Clemence Benjamin|
//|             https://www.mql5.com/en/users/billionaire2024/seller |
//+------------------------------------------------------------------+
#property copyright "Clemence Benjamin"
#property link      "https://www.mql5.com/en/users/billionaire2024/seller"
#property version   "1.00"
#property strict
#property indicator_chart_window
#property indicator_buffers 8
#property indicator_plots   4

//+------------------------------------------------------------------+
//| Input  Variables                                                 |
//+------------------------------------------------------------------+
input int           LookbackBars      = 1000;     //--- Number of bars to look back for zones
input double        RatioMultiplier   = 3.0;      //--- Ratio multiplier (3x)
input int           ExtendBars        = 50;       //--- Bars to extend rectangle right
input bool          FillRectangles    = true;     //--- Fill or just border?
input color         DemandZoneColor   = clrLimeGreen;
input color         SupplyZoneColor   = clrRed;
input uchar         ZoneOpacity       = 40;       //--- 0-255 transparency
input bool          ShowBuffers       = true;     //--- Show buffer lines on chart
input ENUM_LINE_STYLE BufferStyle     = STYLE_DASH; //--- Buffer line style
input int           BufferWidth       = 1;        //--- Buffer line width

//+------------------------------------------------------------------+
//| Global Variables                                                 |
//+------------------------------------------------------------------+
double myPoint;
double Open[], Close[], High[], Low[];
datetime TimeArray[];

//--- Indicator Buffers
double DemandZoneHighBuffer[];
double DemandZoneLowBuffer[];
double SupplyZoneHighBuffer[];
double SupplyZoneLowBuffer[];
double DemandZoneSignalBuffer[];
double SupplyZoneSignalBuffer[];
double ZoneStartTimeBuffer[];
double ZoneEndTimeBuffer[];

//+------------------------------------------------------------------+
//| Candle range helper                                              |
//+------------------------------------------------------------------+
double CandleRange(const int i)
  {
   return(High[i] - Low[i]);
  }

//+------------------------------------------------------------------+
//| Draw a liquidity zone                                            |
//+------------------------------------------------------------------+
void DrawZone(const int base_idx, const bool isDemand, const int rates_total)
  {
   datetime start_time = TimeArray[base_idx];
   datetime end_time   = start_time + ExtendBars * PeriodSeconds();

   string obj_name = "LiqZone_" + IntegerToString(start_time);

   //--- Delete existing object if present
   if(ObjectFind(0, obj_name) >= 0)
     ObjectDelete(0, obj_name);

   //--- Determine zone top/bottom
   double top, bottom;
   if(isDemand)
     {
      top    = High[base_idx];
      bottom = Low[base_idx];
     }
   else
     {
      top    = High[base_idx];
      bottom = Low[base_idx];
     }

   //--- Create rectangle
   if(ObjectCreate(0, obj_name, OBJ_RECTANGLE, 0, start_time, top, end_time, bottom))
     {
      color zone_color = isDemand ? DemandZoneColor : SupplyZoneColor;
      ObjectSetInteger(0, obj_name, OBJPROP_COLOR, zone_color);
      ObjectSetInteger(0, obj_name, OBJPROP_STYLE, STYLE_SOLID);
      ObjectSetInteger(0, obj_name, OBJPROP_WIDTH, 1);
      ObjectSetInteger(0, obj_name, OBJPROP_FILL, FillRectangles);
      ObjectSetInteger(0, obj_name, OBJPROP_BACK, true);
      ObjectSetInteger(0, obj_name, OBJPROP_SELECTABLE, false);

      if(FillRectangles)
        {
         color fill_clr = (color)ColorToARGB(zone_color, ZoneOpacity);
         ObjectSetInteger(0, obj_name, OBJPROP_BGCOLOR, fill_clr);
        }
     }

   //--- Optional buffers for visualization
   if(ShowBuffers && base_idx < rates_total)
     {
      if(isDemand)
        {
         DemandZoneHighBuffer[base_idx] = top;
         DemandZoneLowBuffer[base_idx]  = bottom;
        }
      else
        {
         SupplyZoneHighBuffer[base_idx] = top;
         SupplyZoneLowBuffer[base_idx]  = bottom;
        }

      ZoneStartTimeBuffer[base_idx] = start_time;
      ZoneEndTimeBuffer[base_idx]   = end_time;
     }
  }

//+------------------------------------------------------------------+
//| Calculates indicator values                                      |
//+------------------------------------------------------------------+
int OnCalculate(const int rates_total,
                const int prev_calculated,
                const datetime &time[],
                const double &open[],
                const double &high[],
                const double &low[],
                const double &close[],
                const long &tick_volume[],
                const long &volume[],
                const int &spread[])
  {
   //--- Not enough bars to calculate
   if(rates_total < 5)
     return(0);

   //--- Copy data into series arrays
   int bars_to_process = MathMin(rates_total, 5000);
   CopyOpen(Symbol(), PERIOD_CURRENT, 0, bars_to_process, Open);
   CopyClose(Symbol(), PERIOD_CURRENT, 0, bars_to_process, Close);
   CopyHigh(Symbol(), PERIOD_CURRENT, 0, bars_to_process, High);
   CopyLow(Symbol(), PERIOD_CURRENT, 0, bars_to_process, Low);
   CopyTime(Symbol(), PERIOD_CURRENT, 0, bars_to_process, TimeArray);

   ArraySetAsSeries(Open, true);
   ArraySetAsSeries(Close, true);
   ArraySetAsSeries(High, true);
   ArraySetAsSeries(Low, true);
   ArraySetAsSeries(TimeArray, true);

   //--- Iterate over bars to detect zones
   for(int i = bars_to_process - 3; i >= 0; i--)
     {
      int base_idx    = i + 2;
      int impulse_idx = i + 1;

      double base_range    = CandleRange(base_idx);
      double impulse_range = CandleRange(impulse_idx);

      //--- Demand zone: both bars bullish, impulse breaks out
      if(Open[base_idx] < Close[base_idx] &&
         Open[impulse_idx] < Close[impulse_idx] &&
         impulse_range >= base_range * RatioMultiplier)
        {
         DrawZone(base_idx, true, rates_total);
        }

      //--- Supply zone: both bars bearish, impulse breaks out
      if(Open[base_idx] > Close[base_idx] &&
         Open[impulse_idx] > Close[impulse_idx] &&
         impulse_range >= base_range * RatioMultiplier)
        {
         DrawZone(base_idx, false, rates_total);
        }
     }

   //--- Return total number of processed bars
   return(rates_total);
  }
//+------------------------------------------------------------------+
Take a moment to critique this. The original indicator was a significant step forward, successfully translating a statistical observation into an automated, objective tool. Its core loop—identifying a base candle and validating a subsequent impulse candle against a ratio—is elegant and effective. The zones it draws accurately highlight key structural levels on the chart where institutional activity likely occurred. You may consider revisiting the testing section of the previous article where we originally developed the source code here.
However, as a practical trading tool, it has a fundamental limitation: it is a passive observer. It shows you the battlefield—where the institutions have deployed their forces—but it provides no signal for when to engage. It does not monitor the lower timeframe price action for entries as price returns to these critical zones. A trader must still watch multiple charts, waiting for a reaction, which is mentally exhausting and prone to missed opportunities. The original indicator answers the "where" but not the "when."
This gap between zone identification and actionable signals is where many trading tools fall short. We have a high-probability map, but no real-time guidance on when to pull the trigger.
In this article, we will architect and build a complete solution to this problem: a "multi-timeframe liquidity zone reaction system." Our enhanced indicator will not only detect zones on a higher timeframe (using the proven logic from the original indicator) but will also actively monitor the current, lower timeframe for price to return to those zones. When price enters a zone and simultaneously displays a confirmed reversal pattern—such as an engulfing candle, a pin bar, or an inside bar break—the indicator will plot an arrow directly on the chart and trigger an alert, giving you a clear, actionable signal that aligns higher timeframe structure with lower timeframe timing.
This new architecture requires a fundamental shift in thinking. The original indicator worked in isolation on a single chart. Our new system must think in layers:
- A Zone Detection Layer: Operating on a user-selected higher timeframe (e.g., H1), this layer will use the original base-impulse logic to identify and store liquidity zones.
- A Visual Layer: These zones must be drawn as persistent rectangles on the current chart, remaining visible regardless of the timeframe we are trading on.
- A Reaction Monitoring Layer: On the current, lower timeframe (e.g., M5), this layer will evaluate every closed bar. It will check if the bar's price range intersects with any active higher timeframe zone and if a reversal pattern is present. If both conditions are met, a signal is generated.
By the time you finish reading, you'll understand how to build such a system in MQL5, and also the deeper principles of multi-timeframe analysis that make it effective. You'll see how institutional traders think in layers, how liquidity zones form natural support and resistance levels, and how combining timeframe analysis with precise reversal patterns can dramatically improve your trading results.
Implementation
The journey from concept to working indicator requires careful planning and systematic implementation. Below, we'll walk through the complete development process, explaining each component and its role in the overall system. The final indicator we'll build represents a significant advancement over the original—it identifies zones, monitors them for reactions, and provides clear visual signals when trading opportunities arise.
Step 1: Setting Up the Indicator Framework and Input Parameters
Every MQL5 indicator begins with property declarations and input parameters. These define how the indicator appears on the chart, which data it uses, and the customization options available to traders. For our multi-timeframe reaction indicator, we need inputs that control both the zone detection on higher timeframes and the reaction monitoring on the current timeframe.
The first section of our code establishes these foundations. We declare the indicator as operating in the chart window (rather than a separate subwindow), allocate two buffers for our buy and sell arrows, and define two plots—one for each arrow type. The input parameters are organized logically: first, the higher timeframe zone detection settings (which timeframe to analyze, how many bars to look back, the expansion ratio for identifying zones, and how far to extend the rectangles), followed by visual customization options (colors, opacity, fill settings), and finally the reaction signal settings (arrow colors and sizes).
//+------------------------------------------------------------------+
//|                                 Liquidity Zone Reaction Indicator|
//|                                Copyright © 2026 Clemence Benjamin|
//|             https://www.mql5.com/en/users/billionaire2024/seller |
//+------------------------------------------------------------------+
#property copyright "Clemence Benjamin"
#property link      "https://www.mql5.com/en/users/billionaire2024/seller"
#property version   "3.0"
#property indicator_chart_window
#property indicator_buffers 2
#property indicator_plots   2

//--- Inputs for zone detection (higher timeframe)
input ENUM_TIMEFRAMES ZoneTimeframe   = PERIOD_H1;       // Timeframe for zone detection
input int             LookbackBars    = 1000;            // Number of bars on higher TF to look back
input double          RatioMultiplier = 3.0;             // Ratio Multiplier (3x)
input int             ExtendBars      = 50;              // Bars to extend rectangle right (on higher TF)
input bool            FillRectangles  = true;            // Fill or just border?
input color           DemandZoneColor = clrLimeGreen;    // Demand zone rectangle color
input color           SupplyZoneColor = clrTomato;       // Supply zone rectangle color
input uchar           ZoneOpacity     = 40;              // 0-255 transparency

//--- Inputs for reaction signals (current timeframe)
input color           DemandArrowColor = clrLimeGreen;   // Buy arrow color
input color           SupplyArrowColor = clrRed;         // Sell arrow color
input int             ArrowSize        = 1;              // Arrow width

//--- Arrow buffers
double BuyArrow[];
double SellArrow[];
//+------------------------------------------------------------------+
Step 2: Defining the Zone Structure and Global Variables
At the heart of our indicator is the LiquidityZone structure. This custom data type encapsulates everything we need to know about a zone: its price boundaries (high and low), its temporal boundaries (start time and expiry time), its type (demand or supply), and whether it has already triggered a signal. By storing zones in a dynamic array, we can manage an unlimited number of active zones simultaneously, each with its own properties and state.
//--- Current timeframe data arrays (for reversal patterns)
double Open[], Close[], High[], Low[];
datetime TimeArray[];

//--- Global variables
double    myPoint;
int       htfPeriodSeconds;               // period seconds of the higher timeframe
int       currentPeriodSeconds;           // current timeframe period in seconds
datetime  lastHtfUpdateTime = 0;          // last time zones were updated
datetime  lastAlertTime = 0;               // for alert throttling

//+------------------------------------------------------------------+
//| Zone structure                                                   |
//+------------------------------------------------------------------+
struct LiquidityZone
  {
   double            high;              // zone top price
   double            low;               // zone bottom price
   datetime          start_time;        // bar time where zone was formed
   datetime          expiry_time;       // time when zone expires (start + ExtendBars * htfPeriod)
   bool              demand;            // true = demand, false = supply
   bool              triggered;         // true if a signal already fired in this zone
  };

LiquidityZone zones[];          // dynamic array of currently active zones
//+------------------------------------------------------------------+
Step 3: Initialization and Buffer Configuration
The OnInit() function handles all setup tasks that need to occur once when the indicator first loads. This includes calculating the correct point value (accounting for 5-digit brokers), setting up the arrow buffers, configuring plot properties, and initializing time-period variables.
//+------------------------------------------------------------------+
//| Custom indicator initialization function                         |
//+------------------------------------------------------------------+
int OnInit()
  {
   myPoint = Point();
   if(_Digits == 5 || _Digits == 3)
      myPoint *= 10;

//--- Set arrow buffers
   SetIndexBuffer(0, BuyArrow, INDICATOR_DATA);
   SetIndexBuffer(1, SellArrow, INDICATOR_DATA);

//--- Make arrow buffers series so index 0 = newest bar
   ArraySetAsSeries(BuyArrow, true);
   ArraySetAsSeries(SellArrow, true);

   PlotIndexSetInteger(0, PLOT_DRAW_TYPE, DRAW_ARROW);
   PlotIndexSetInteger(0, PLOT_ARROW, 233);                 // up arrow
   PlotIndexSetString(0, PLOT_LABEL, "Buy");
   PlotIndexSetInteger(0, PLOT_LINE_COLOR, DemandArrowColor);
   PlotIndexSetInteger(0, PLOT_LINE_WIDTH, ArrowSize);

   PlotIndexSetInteger(1, PLOT_DRAW_TYPE, DRAW_ARROW);
   PlotIndexSetInteger(1, PLOT_ARROW, 234);                 // down arrow
   PlotIndexSetString(1, PLOT_LABEL, "Sell");
   PlotIndexSetInteger(1, PLOT_LINE_COLOR, SupplyArrowColor);
   PlotIndexSetInteger(1, PLOT_LINE_WIDTH, ArrowSize);

   ArrayInitialize(BuyArrow, EMPTY_VALUE);
   ArrayInitialize(SellArrow, EMPTY_VALUE);

//--- Period seconds for time calculations
   currentPeriodSeconds = PeriodSeconds();
   htfPeriodSeconds = PeriodSeconds(ZoneTimeframe);
   if(htfPeriodSeconds <= 0)
      htfPeriodSeconds = 3600;       // fallback to 1 hour

//--- Initial update of zones (will be done in OnCalculate)
   lastHtfUpdateTime = 0;

   return(INIT_SUCCEEDED);
  }
//+------------------------------------------------------------------+
Step 4: Cleanup and Object Management
Proper cleanup is essential for professional-grade indicators. When the indicator is removed from the chart, any objects it created—in our case, the zone rectangles—should be deleted to keep the chart clean. The OnDeinit() function handles this automatically, calling DeleteAllZones() to remove every object whose name begins with "LiqZone_."
//+------------------------------------------------------------------+
//| Deinitialization                                                 |
//+------------------------------------------------------------------+
void OnDeinit(const int reason)
  {
   DeleteAllZones();
  }

//+------------------------------------------------------------------+
//| Delete all drawn zone rectangles                                 |
//+------------------------------------------------------------------+
void DeleteAllZones()
  {
   for(int i = ObjectsTotal(0, 0, -1) - 1; i >= 0; i--)
     {
      string name = ObjectName(0, i);
      if(StringFind(name, "LiqZone_") == 0)
         ObjectDelete(0, name);
     }
   ChartRedraw();
  }
//+------------------------------------------------------------------+
Step 5: Drawing Zone Rectangles for Visual Reference
Visual feedback is essential for any trading tool. Traders need to see at a glance where zones are located, how far they extend into the future, and whether they're demand or supply areas. The DrawZone() function handles this by creating a rectangle object with the appropriate properties—color, fill style, transparency, and positioning behind price action—so it doesn't obscure the candlesticks.
//+------------------------------------------------------------------+
//| Draw a single zone rectangle                                     |
//+------------------------------------------------------------------+
void DrawZone(datetime start_time, datetime expiry_time,
              double price_top, double price_bottom, bool isDemand)
  {
   string obj_name = "LiqZone_" + IntegerToString(start_time) + "_" + IntegerToString(expiry_time);
   if(ObjectFind(0, obj_name) >= 0)
      ObjectDelete(0, obj_name);

   color zone_color = isDemand ? DemandZoneColor : SupplyZoneColor;

   if(ObjectCreate(0, obj_name, OBJ_RECTANGLE, 0,
                   start_time, price_top, expiry_time, price_bottom))
     {
      ObjectSetInteger(0, obj_name, OBJPROP_COLOR, zone_color);
      ObjectSetInteger(0, obj_name, OBJPROP_STYLE, STYLE_SOLID);
      ObjectSetInteger(0, obj_name, OBJPROP_WIDTH, 1);
      ObjectSetInteger(0, obj_name, OBJPROP_FILL, FillRectangles);
      ObjectSetInteger(0, obj_name, OBJPROP_BACK, true);           // behind price
      ObjectSetInteger(0, obj_name, OBJPROP_SELECTABLE, false);

      if(FillRectangles)
        {
         color fill_clr = (color)ColorToARGB(zone_color, ZoneOpacity);
         ObjectSetInteger(0, obj_name, OBJPROP_BGCOLOR, fill_clr);
        }
     }
  }
//+------------------------------------------------------------------+
Step 6: Higher Timeframe Zone Detection
The heart of our multi-timeframe approach lies in UpdateZones(). This function is called whenever a new bar appears on the selected higher timeframe. It copies the necessary price data, scans for base-impulse patterns, creates LiquidityZone structures for each valid pattern, and draws the corresponding rectangles on the chart.
//+------------------------------------------------------------------+
//| Update zones from higher timeframe data                          |
//+------------------------------------------------------------------+
void UpdateZones()
  {
//--- Delete old rectangles and clear zone array
   DeleteAllZones();
   ArrayResize(zones, 0);

//--- Copy higher timeframe data
   double htf_open[], htf_close[], htf_high[], htf_low[];
   datetime htf_time[];
   int htf_bars = CopyOpen(Symbol(), ZoneTimeframe, 0, LookbackBars, htf_open);
   if(htf_bars <= 0)
      return;
   CopyClose(Symbol(), ZoneTimeframe, 0, LookbackBars, htf_close);
   CopyHigh(Symbol(), ZoneTimeframe, 0, LookbackBars, htf_high);
   CopyLow(Symbol(), ZoneTimeframe, 0, LookbackBars, htf_low);
   CopyTime(Symbol(), ZoneTimeframe, 0, LookbackBars, htf_time);

//--- Work with series (index 0 = most recent)
   ArraySetAsSeries(htf_open,  true);
   ArraySetAsSeries(htf_close, true);
   ArraySetAsSeries(htf_high,  true);
   ArraySetAsSeries(htf_low,   true);
   ArraySetAsSeries(htf_time,  true);

//--- Scan higher timeframe bars for zones
   for(int i = htf_bars - 5; i >= 2; i--)
     {
      int base_idx    = i + 2;
      int impulse_idx = i + 1;

      if(base_idx >= htf_bars)
         continue;

      double base_range    = htf_high[base_idx] - htf_low[base_idx];
      double impulse_range = htf_high[impulse_idx] - htf_low[impulse_idx];

      if(base_range <= 0)
         continue;
      //+------------------------------------------------------------------+
When a valid zone is found, we create a new LiquidityZone structure, populate it with the relevant data (high, low, start time calculated as base bar time, expiry time calculated as start time plus ExtendBars multiplied by the higher timeframe period in seconds), add it to our dynamic array, and draw the corresponding rectangle on the chart.
//--- Creating a new liquidity Zone

if(htf_open[base_idx] < htf_close[base_idx] &&
   htf_open[impulse_idx] < htf_close[impulse_idx] &&
   impulse_range >= base_range * RatioMultiplier)
  {
   LiquidityZone z;
   z.high        = htf_high[base_idx];
   z.low         = htf_low[base_idx];
   z.start_time  = htf_time[base_idx];
   z.expiry_time = z.start_time + ExtendBars * htfPeriodSeconds;
   z.demand      = true;
   z.triggered   = false;

   int size = ArraySize(zones);
   ArrayResize(zones, size + 1);
   zones[size] = z;

   DrawZone(z.start_time, z.expiry_time, z.high, z.low, true);
  }
//+------------------------------------------------------------------+
Step 7: Defining Reversal Patterns for Entry Confirmation
Identifying zones is only half the battle. The other half is knowing when to act when the price returns to those zones. For this, we need a reliable set of reversal patterns that signal a potential change in direction. Our indicator includes three classic reversal patterns for both bullish and bearish scenarios: engulfing patterns, pin bars, and inside bar breaks.
//+------------------------------------------------------------------+
//| Bullish Engulfing Pattern                                        |
//| Detects bullish reversal when current candle engulfs previous    |
//| bearish candle body                                              |
//+------------------------------------------------------------------+
bool BullishEngulfing(int i)
  {
   if(Close[i] > Open[i] &&
      Close[i+1] < Open[i+1] &&
      Close[i] > Open[i+1] &&
      Open[i] < Close[i+1])
      return true;
   return false;
  }

//+------------------------------------------------------------------+
//| Bearish Engulfing Pattern                                        |
//| Detects bearish reversal when current candle engulfs previous    |
//| bullish candle body                                              |
//+------------------------------------------------------------------+
bool BearishEngulfing(int i)
  {
   if(Close[i] < Open[i] &&
      Close[i+1] > Open[i+1] &&
      Open[i] > Close[i+1] &&
      Close[i] < Open[i+1])
      return true;
   return false;
  }

//+------------------------------------------------------------------+
//| Bullish Pin Bar Pattern                                          |
//| Long lower wick indicating rejection of lower prices             |
//+------------------------------------------------------------------+
bool BullishPinBar(int i)
  {
   double body = MathAbs(Close[i] - Open[i]);
   double lower = MathMin(Open[i], Close[i]) - Low[i];
   if(lower > body * 2)
      return true;
   return false;
  }

//+------------------------------------------------------------------+
//| Bearish Pin Bar Pattern                                          |
//| Long upper wick indicating rejection of higher prices            |
//+------------------------------------------------------------------+
bool BearishPinBar(int i)
  {
   double body = MathAbs(Close[i] - Open[i]);
   double upper = High[i] - MathMax(Open[i], Close[i]);
   if(upper > body * 2)
      return true;
   return false;
  }

//+------------------------------------------------------------------+
//| Bullish Inside Bar Breakout                                      |
//| Inside bar structure followed by bullish breakout                |
//+------------------------------------------------------------------+
bool BullishInsideBreak(int i)
  {
   if(High[i] < High[i+1] && Low[i] > Low[i+1])
      if(Close[i] > High[i+1])
         return true;
   return false;
  }

//+------------------------------------------------------------------+
//| Bearish Inside Bar Breakout                                      |
//| Inside bar structure followed by bearish breakout                |
//+------------------------------------------------------------------+
bool BearishInsideBreak(int i)
  {
   if(High[i] < High[i+1] && Low[i] > Low[i+1])
      if(Close[i] < Low[i+1])
         return true;
   return false;
  }

//+------------------------------------------------------------------+
//| Demand Zone Reversal Detector                                    |
//| Combines bullish reversal patterns for demand zones              |
//+------------------------------------------------------------------+
bool DemandReversal(int i)
  {
   if(BullishEngulfing(i))
      return true;
   if(BullishPinBar(i))
      return true;
   if(BullishInsideBreak(i))
      return true;
   return false;
  }

//+------------------------------------------------------------------+
//| Supply Zone Reversal Detector                                    |
//| Combines bearish reversal patterns for supply zones              |
//+------------------------------------------------------------------+
bool SupplyReversal(int i)
  {
   if(BearishEngulfing(i))
      return true;
   if(BearishPinBar(i))
      return true;
   if(BearishInsideBreak(i))
      return true;
   return false;
  }
//+------------------------------------------------------------------+
Step 8: The Two-Pass OnCalculate Logic
The OnCalculate function is where everything comes together. It implements a two-pass approach that handles both historical signal display and real-time alert generation. This dual strategy ensures that traders can see all past signals when they load the indicator (crucial for backtesting and understanding how the system would have performed), while also receiving timely alerts for new opportunities as they develop.
//+------------------------------------------------------------------+
//| Calculates indicator values and updates zones                    |
//+------------------------------------------------------------------+
int OnCalculate(const int rates_total,
                const int prev_calculated,
                const datetime &time[],
                const double &open[],
                const double &high[],
                const double &low[],
                const double &close[],
                const long &tick_volume[],
                const long &volume[],
                const int &spread[])
  {
   //--- Not enough bars to calculate
   if(rates_total < 5)
     return(0);

   //--- Copy current timeframe data into global arrays (as series)
   int barsNeeded = MathMin(rates_total, 5000);  // safe upper limit
   CopyOpen(Symbol(), PERIOD_CURRENT, 0, barsNeeded, Open);
   CopyClose(Symbol(), PERIOD_CURRENT, 0, barsNeeded, Close);
   CopyHigh(Symbol(), PERIOD_CURRENT, 0, barsNeeded, High);
   CopyLow(Symbol(), PERIOD_CURRENT, 0, barsNeeded, Low);
   CopyTime(Symbol(), PERIOD_CURRENT, 0, barsNeeded, TimeArray);

   ArraySetAsSeries(Open,      true);
   ArraySetAsSeries(Close,     true);
   ArraySetAsSeries(High,      true);
   ArraySetAsSeries(Low,       true);
   ArraySetAsSeries(TimeArray, true);

   //--- Update zones if a new higher timeframe bar appears
   datetime latestHtfTime = iTime(Symbol(), ZoneTimeframe, 0);
   if(latestHtfTime != lastHtfUpdateTime)
     {
      UpdateZones();
      lastHtfUpdateTime = latestHtfTime;
     }

   //--- further calculations continue here...

   return(rates_total);
  }
//+------------------------------------------------------------------+
The first pass loops through every completed bar from the oldest to the newest, checking for any bar that lies within a zone's time window, has the price inside that zone, and displays a matching reversal pattern. For each such bar, it sets the corresponding arrow buffer value to a price just below (for buys) or above (for sells) the bar's extreme, creating a visual marker directly on the chart.
//---------------------------------------------------------------
// 1) Loop over ALL completed bars (oldest to newest) and set arrows
//    This makes historical signals appear on the chart.
//---------------------------------------------------------------
for(int i = rates_total - 2; i >= 0; i--)   // i = bar index (0 = newest)
  {
   bool buySignal  = false;
   bool sellSignal = false;

// Check every active zone
   for(int z = 0; z < ArraySize(zones); z++)
     {
      // --- Time validity: bar must be within zone's lifetime ---
      if(TimeArray[i] < zones[z].start_time || TimeArray[i] > zones[z].expiry_time)
         continue;

      // --- Price inside zone? ---
      if(!PriceInsideZone(i, zones[z], High, Low))
         continue;

      // --- Reversal pattern? ---
      if(zones[z].demand && DemandReversal(i))
         buySignal = true;
      if(!zones[z].demand && SupplyReversal(i))
         sellSignal = true;
     }

// Set arrow (or EMPTY_VALUE if no signal)
   BuyArrow[i]  = buySignal  ? Low[i] - 5 * myPoint : EMPTY_VALUE;
   SellArrow[i] = sellSignal ? High[i] + 5 * myPoint : EMPTY_VALUE;
  }
//+------------------------------------------------------------------+
The second pass focuses only on the most recent completed bar (index 1). It performs the same checks but additionally respects the triggered flag—once a zone generates an alert, it won't generate another. This prevents repeated alerts from the same zone as new bars form while the price remains within it. When a valid signal is found, an alert is triggered with the relevant information.
//--------------------------------------------------------------------------
//     2)   Real-time alert handling (only for the most recent closed bars |
//   Uses the 'triggered' flag to avoid repeated alerts from the same zone.|
//--------------------------------------------------------------------------
int signal_bar = 1;   // last closed bar
if(signal_bar < rates_total)
  {
   for(int z = 0; z < ArraySize(zones); z++)
     {
      // Skip if zone already triggered
      if(zones[z].triggered)
         continue;

      // Time validity (using the bar's time, not TimeCurrent)
      if(TimeArray[signal_bar] < zones[z].start_time || TimeArray[signal_bar] > zones[z].expiry_time)
         continue;

      // Price inside?
      if(!PriceInsideZone(signal_bar, zones[z], High, Low))
         continue;

      // Reversal?
      if(zones[z].demand && DemandReversal(signal_bar))
        {
         zones[z].triggered = true;
         if(TimeArray[signal_bar] != lastAlertTime)
           {
            Alert("Demand Zone BUY Reaction ", Symbol(), " ", EnumToString(_Period));
            lastAlertTime = TimeArray[signal_bar];
           }
        }
      else
         if(!zones[z].demand && SupplyReversal(signal_bar))
           {
            zones[z].triggered = true;
            if(TimeArray[signal_bar] != lastAlertTime)
              {
               Alert("Supply Zone SELL Reaction ", Symbol(), " ", EnumToString(_Period));
               lastAlertTime = TimeArray[signal_bar];
              }
           }
     }
  }

return(rates_total);
  }
//+------------------------------------------------------------------+
Step 9: Price Inside Zone Validation
The final piece of the puzzle is a simple but crucial helper function that checks whether a given bar's price range overlaps with a zone. This function is called repeatedly throughout the OnCalculate logic and must be both accurate and efficient.
//+------------------------------------------------------------------+
//| Check if a bar is inside a zone                                  |
//+------------------------------------------------------------------+
bool PriceInsideZone(int bar, const LiquidityZone &z,
                     const double &high[], const double &low[])
  {
   if(high[bar] >= z.low && low[bar] <= z.high)
      return true;
   return false;
  }
//+------------------------------------------------------------------+
With all these components working together, we've created a comprehensive multi-timeframe liquidity zone reaction indicator that identifies institutional zones, monitors them for actionable trading opportunities, and alerts the trader when those opportunities arise.
Testing and Results
When testing a multi-timeframe indicator, a systematic approach is required that verifies both the zone detection logic and the reaction monitoring functionality. The testing procedure should cover historical accuracy, real-time performance, and edge case handling. To achieve comprehensive validation efficiently, we employ two complementary testing modes: the Strategy Tester for rapid historical evaluation and live chart observation for real-time confirmation.
Figure 1 shows how the Strategy Tester compresses months of historical price action into minutes for rapid performance assessment.
Testing Approaches
Strategy Tester Mode: Live charts require waiting days or weeks to accumulate enough signals for meaningful analysis. The Strategy Tester solves this by simulating months of historical data in minutes. You can observe how the indicator would have performed across various market conditions—trending, ranging, high volatility, low volatility—simply by selecting different date ranges. This compressed feedback loop is essential for:
- Verifying that zones are correctly identified across diverse market phases
- Confirming that reaction arrows appear on all qualifying historical bars
- Fine-tuning input parameters (like RatioMultiplier) for specific instruments
- Building confidence in the indicator's logic before deploying it live
Live Chart Mode (Real-World Verification): While the Strategy Tester provides historical confidence, live testing validates real-time behavior:
- Confirming that alerts trigger correctly when new bars form
- Observing how the indicator handles the most recent, incomplete bar
- Ensuring that zone rectangles persist correctly as new price data arrives
- Experiencing the actual timing and frequency of signals in current market conditions
Both approaches are essential: the Strategy Tester gives you speed, while live testing gives you certainty. Below, we document both processes and their combined results.
Testing Procedure
Part A: Strategy Tester
1. Open the MetaTrader 5 Strategy Tester, select EURUSD as the symbol, choose M5 as the timeframe, and set a historical date range that includes significant price movements (e.g., January 2020–March 2020). Enable "Visual Mode" to observe the indicator's behavior bar by bar. Select the indicator in the Tester.
2. Configure the indicator inputs: Set ZoneTimeframe to PERIOD_H1 (higher timeframe analysis), RatioMultiplier to 2.25 (for testing on EURUSD), and other visual parameters as desired (Fig. 2 shows a typical configuration).
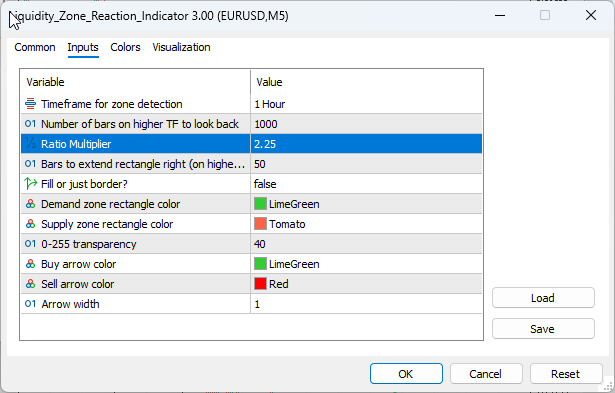
Fig. 2. Indicator input parameters—configured for H1 zone detection on EURUSD M5
3. Run the visual backtest. Observe zone rectangles appearing at significant structural points where a consolidation bar was followed by an impulse bar meeting or exceeding the 3× ratio threshold. Note that zones are drawn based on higher timeframe data but appear on your M5 chart—the multi-timeframe visualization working as designed.
4. As the simulation progresses, watch for the price returning to existing zones. When price enters a demand zone (green rectangle) and forms a bullish reversal pattern, a buy arrow (up arrow) should appear. When price enters a supply zone (red rectangle) and forms a bearish reversal pattern, a sell arrow (down arrow) should appear.
5. After the simulation completes, scroll back through the chart history. Verify that arrows appear on every bar where conditions were met—this confirms the two-pass OnCalculate logic correctly populates historical signals, a verification that would take weeks on a live chart.
Part B: Live Chart
1. Attach the indicator to a live EURUSD M5 chart with the same input settings. Allow the indicator to run for several hours, and monitor its behavior.
2. Observe the live chart for new zone formations and reaction signals. Fig. 3 shows a live chart example where H1 zones are clearly visible, and M5 reaction arrows have been plotted at reversal points.
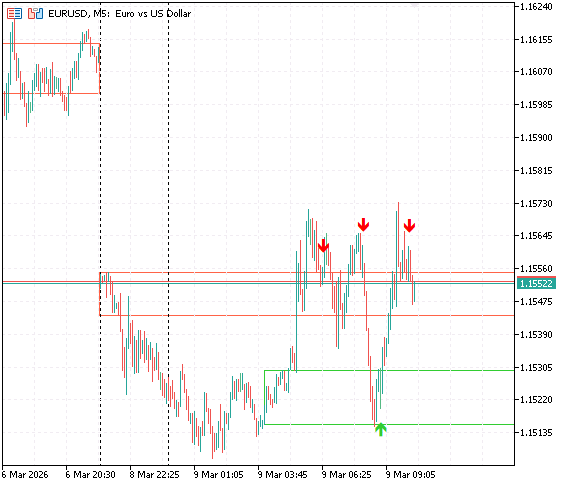
Fig. 3. H1 liquidity zones (rectangles) and M5 reaction arrows where reversal patterns occurred inside zones.
3. Monitor the terminal window for alert messages. When a new bar closes inside a zone with a reversal pattern, an alert should trigger with the format "Demand Zone BUY Reaction EURUSD PERIOD_M5" or "Supply Zone SELL Reaction EURUSD PERIOD_M5." Fig. 4 shows a collection of such alerts captured during live testing.

Fig. 4. Real-time notifications were generated as price entered zones with reversal patterns (captured after extended live observation).
Observed Results
The combined testing approach yielded consistent findings across both historical simulation and live observation:
Zone Detection Accuracy: In both Strategy Tester and live modes, higher timeframe zones consistently aligned with significant structural levels. When price revisited these zones, it frequently showed reactions—confirming the institutional relevance of these areas. We used a 2.25 ratio instead of the default 3.0 ratio on EURUSD and XAUUSD, while more volatile instruments like the Volatility 10 (1s) Index required a lower ratio (2.0) to generate meaningful zones—exactly as the original research suggested.
Signal Quality and Frequency: Not every zone visit generated a signal—only those with clear reversal patterns. This filtering produced relatively rare but high-conviction signals, aligning with reduced overtrading. The Strategy Tester revealed that on EURUSD, the indicator generated signals only at structurally significant levels.
Historical Signal Visualization: The two-pass design worked flawlessly in the Strategy Tester, with arrows visible on all historical reaction bars. This made backtesting intuitive—immediately seeing where the system would have signaled entries in the past provides powerful insight into its behavior.
Alert Reliability: During live testing, alerts triggered consistently on new signals without spamming, thanks to the triggered flag mechanism and lastAlertTime throttling. Fig. 4 above shows a representative sample of alerts captured over a few hours of live observation.
These observations reinforce a crucial conclusion from our original research: while the 3:1 ratio provides a statistically strong baseline, optimal performance requires adaptability to the specific instrument. The adjustable RatioMultiplier input empowers traders to calibrate the indicator to their preferred markets, making it a flexible tool rather than a rigid formula.
The successful testing phase confirms that our multi-timeframe architecture works as intended: higher timeframe zones are detected and visualized, lower timeframe reactions are monitored, and clear signals are generated only when both structural context and entry confirmation align. This transforms the original passive zone indicator into an active trading companion that guides entries with precision.
Conclusion
Throughout this article, we have transformed a simple zone detection indicator into a comprehensive multi-timeframe reaction system. We started with the core concept—that higher timeframe liquidity zones provide context while lower timeframe reversal patterns provide timing—and built a complete MQL5 implementation around it.
We have created a tool that embodies institutional trading principles: top-down analysis, structural confirmation, and precise execution timing. The indicator automatically scans higher timeframes for zones where institutions have likely placed orders, draws these zones directly on the current chart so they remain visible regardless of the timeframe you're viewing, and then monitors every bar for potential reactions. When price enters a zone and displays a confirmed reversal pattern—an engulfing candle, a pin bar, or an inside bar break—the indicator plots an arrow and triggers an alert, giving you a clear, actionable signal.
The two-pass design ensures you can see all historical signals when you load the indicator, making backtesting intuitive and informative. You can scroll back through price history and see exactly where the system would have signaled entries, how those signals performed, and under what market conditions the system excels or struggles.
The principles we've implemented here apply to any trading approach: start with the bigger picture, identify key levels where institutions are likely active, wait for the price to return to those levels, and look for confirmation before acting. This top-down approach separates professional traders from amateurs who trade in isolation on a single timeframe.
Looking to the future, this indicator could be extended in numerous ways. Additional reversal patterns could be added, such as morning/evening stars, harami patterns, or three-bar reversals. The zone detection logic could be enhanced to consider premium/discount zones using Fibonacci retracements. Session filters could be added to only generate signals during specific trading sessions like the London or New York opens. The possibilities are endless.
I encourage you to download the indicator, test it on your own charts, and adapt it to your trading style. Experiment with different timeframe combinations—try H4 zones with M15 entries for swing trading, or M15 zones with M1 entries for scalping. Adjust the ratio multiplier to control zone frequency. Modify the reversal patterns to match what works in your specific markets.
I attached the source code as both a learning resource and a practical tool. Study it, understand it, and make it your own. If you have questions, comments, or suggestions for improvements, please share them in the comments section below. The best trading tools evolve through community feedback and collaboration.
Remember: the market is a story told across multiple timeframes. Learn to read the whole story, not just the last paragraph, and your trading will never be the same.
Key Lessons
| Key Lesson | Description: |
|---|---|
| Multi-Timeframe Alignment: | Higher timeframes provide structural context and institutional bias, while lower timeframes offer precise entry timing. When both align, trade probability increases significantly. |
| Liquidity Zones as Structural Levels: | Areas where institutions place orders (demand/supply zones) act as natural support and resistance levels. Price often returns to these zones before continuing or reversing. |
| Reversal Patterns Provide Confirmation: | Being inside a zone isn't enough—wait for confirmation patterns (engulfing, pin bars, inside bar breaks) that show institutional reaction at the level. |
| Two-Pass Signal Processing: | Separate historical signal display from real-time alert generation. This allows traders to see past signals for analysis while preventing alert spam in the present. |
| Proper Buffer Indexing: | Arrow buffers must be set as series (ArraySetAsSeries) to align with price arrays. Without this, arrows appear on the wrong bars, and historical signals disappear. |
| Object-based visual feedback: | Using OBJ_RECTANGLE for zones ensures they remain visible across timeframe changes and can be customized with colors, fills, and transparency for optimal visibility. |
| Dynamic Array Management: | Using a dynamic array of zone structures allows handling an unlimited number of active zones, each with its own properties and triggered state. |
| Time-Based Expiry: | Zones should expire after a certain number of bars (ExtendBars) to prevent obsolete levels from cluttering the chart and generating false signals. |
| Alert throttling: | Track lastAlertTime to prevent multiple alerts for the same bar, ensuring clear, non-repetitive notifications. |
| Modular Pattern Functions: | Separate each reversal pattern into its own function, then combine them in DemandReversal/SupplyReversal. This makes adding new patterns simple and maintainable. |
Attachments
| File Name | Version | Type | Description |
|---|---|---|---|
| Liquidity_Zone_Reaction_Indicator.mq5 | 3.0 | MQL5 Indicator | Complete multi-timeframe liquidity zone reaction indicator with zone rectangles, arrow signals, and alerts. |
Warning: All rights to these materials are reserved by MetaQuotes Ltd. Copying or reprinting of these materials in whole or in part is prohibited.
This article was written by a user of the site and reflects their personal views. MetaQuotes Ltd is not responsible for the accuracy of the information presented, nor for any consequences resulting from the use of the solutions, strategies or recommendations described.

- Free trading apps
- Over 8,000 signals for copying
- Economic news for exploring financial markets
You agree to website policy and terms of use