
The Random Sandbox
This article is intended to help users gain a better understanding of the Expert Advisor performance measurements offered by MetaTrader, such as profit factor or relative drawdown. This is helped with the use of an interactive "sandbox game" mimicking the performance of EAs and their associated measurements.
Introduction
How do we know whether the performance of an Expert Advisor is actually any good?
MetaTrader offers a range of metrics by default to help us understand the performance of an EA during trading, backtesting and optimization. This data is sometimes ignored or misunderstood simply because new traders do not have a large enough pool of results to compare these numbers against. It may take months or even years for a trader to generate enough data and experience to fully understand what constitutes a good profit factor or an acceptable drawdown.
Even though there are plenty of places to find advice, it is human nature to ignore that and want to test things out ourselves to reach our own conclusions instead. Unfortunately this can lead to many costly mistakes. This article aims to offer a sandbox in which users can quickly, easily and safely explore the deeper meanings behind the performance metrics offered by MetaTrader, without having to blindly rely upon the advice of others or wait months or years to generate a large pool of test data from different EAs themselves.
There is a simple Excel file attached to this article (in a zip folder at the bottom of this page) which will instantly generate 1000 random trades and display the relevant performance metrics offered by MetaTrader, along with graphs. This repeatedly simulates the results of having written and tested a new Expert Advisor strategy at the click of a button. Various key input parameters can be changed and a large amount of relevant randomized simulated backtest data can be generated instantly. This creates a very quick and easy interactive experience which many traders might find interesting and useful.
The data in the results column are set to automatically generate a new output every time the worksheet is altered. To generate new data simply select any empty cell and press the "delete" button (this will not change the selected cell, but will cause the Excel worksheet to update, and so new random numbers will be generated). These random trades are displayed in three separate graphs alongside their standard metrics. There are three worksheets in the Excel file. The first worksheet contains the inputs, graphs and outputs. The second worksheet contains the simulated trade calculations. The third sheet contains the calculations for determining expected win rates for each trade.
The first worksheet contains 3 charts, alongside their relevant metrics:
- Running win/loss total (where win = 1, loss = -1).
- Running profit/loss when using a constant lot size.
- Running profit/loss when using a dynamically adjusted lot size based upon risking a set percentage of capital on each trade.
Inputs
- Starting Capital.
- Stop Loss (measured as a decimal).
- Risk:Reward Ratio (multiply the stop loss by this number then plus spread to get the take profit).
- Static Lot size (for the calculations for the second graph).
- % Capital Risked per Trade (for calculations for the third graph).
- Spread (measured as a decimal).
- £ per Pip per 1 Standard Lot (for calculations for the third graph. 1 lot = 100,000).
- Force Better Performance (artificially increase win % by this amount over that expected by random chance alone).
Outputs
- Expected Win Percentage (% win chance for the given SL:TP ratio and spread per trade).
- Actual Results Win Percentage (actual outcome of randomization).
- Maximum Wins in a Row.
- Maximum Losses in a Row.
- Profit Factor (gross gains / gross losses).
- Relative Drawdown (largest % drawdown).
- ROI % (% return on investment).
Assumptions
- Only one open position at any one time.
- Each trade runs to either the stop loss or take profit, with no trailing stop.
- Each trade uses the same stop loss.
- The take profit is always set to be a multiple of the stop loss.
- The percentage of winners is based upon the ratio of SL:TP and spread, assuming a random distribution.
- Fixed spread.
Randomly Generated Data
The calculations of the results in the Excel worksheet assume that the markets are perfectly random, and that trades are placed at random in that market (this is assumed for the sake of simplicity, and is not necessarily a statement about any market truth).
Sometimes people assume that since the outcome of each trade can only be either a win or a loss, then if the stop loss and take profit are both the same size it means that random chance should provide 50% winners and 50% losers. It is tempting to assume that simply reversing the direction of trades of such a system would turn a losing strategy into a winning strategy. Reality quickly dispels this assumption.
Regardless of whether the markets are indeed random or not, traders must pay spread on their trades which automatically skews the odds against the trader. The chances of winning or losing are therefore based upon how far the stop loss and take profit are placed away from the open price, and how much these two distances are skewed by spread. The calculations are shown on the second worksheet in the file.
For example: assume the stop loss is 10 pips, the take profit is 10 pips and the spread is 2 pips. If the market moves 10 pips in the trade's favor then the gain is 10 pips up to the take profit, and then 2 pips are paid in spread, so effectively the net gain is 8 pips. If the market moves 10 pips against the trade then the loss is 10 pips down to the stop loss, and then 2 pips are still paid in spread, so effectively the net loss is 12 pips. The ratio of the distance moved in pips by the market in either direction is 10:10, but the equivalent pips gained or lost is 8:12.
To ensure that the amount of money lost on a stop loss is equal to the
amount of money gained on a take profit, we can simply let the take profit run
a bit longer so that it covers the spread as well and close the stop loss
earlier by the same amount. Therefore the stop loss would be set to 8 pips (for
a loss of 10 pips), and the take profit would be set to 12 pips (for a gain of
10 pips). Given an even chance of the price "landing" at any point in that
range, then the chance of hitting the take profit is: 1- (12 / (8+12)) =
0.4 = 40% The chance of hitting the stop loss is therefore the reverse of this, ie. 60%.
The table and chart under the calculations on the third worksheet give some examples. The greater the ratio of stop loss to take profit, the smaller the affect of spread on the expected percentage win rate.
Percentage Win Rate is Related to the SL:TP Ratio
It is clear that the expected percentage win rate is determined by the ratio between the stop loss and the take profit, and the extent to which these are both affected by spread. The degree to which this is true of different markets may alter, but the underlying concept is the same. Two important points can be noted here:
- It is irrelevant to talk about percentage win rate without also knowing the stop loss to take profit ratio, the spread, and whether the ratios between them remain the same in each trade across the life of the EA.
- A high percentage win rate does not necessarily mean a profitable strategy, and conversely a low percentage win rate does not automatically mean a losing strategy.
Examples:
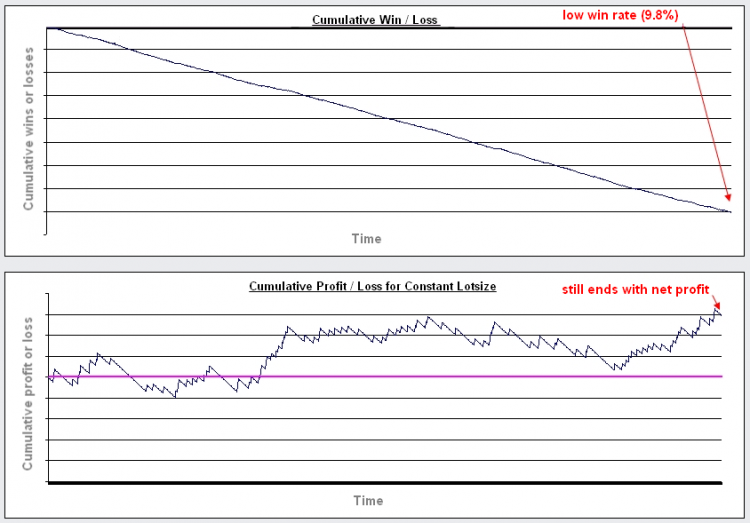
Image 1. Scenario 1: Risk:Reward Ratio = 10.
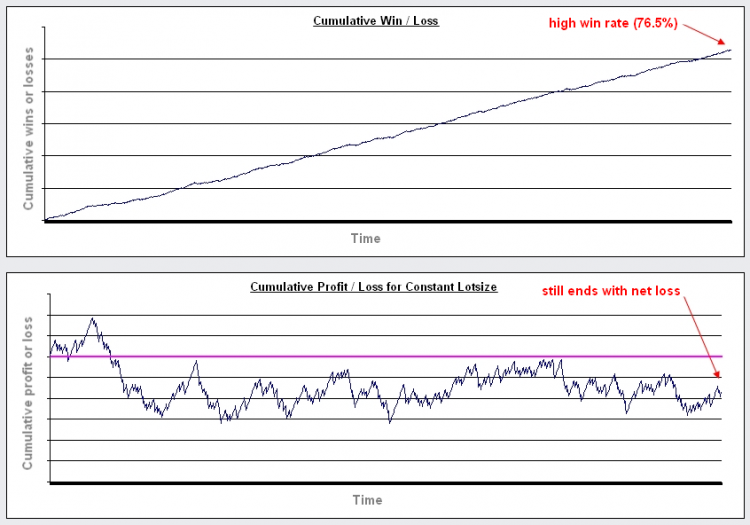
Image 2. Scenario 2: Risk:Reward Ratio = 0.1.
The Effect of Increasing Risk
It is often said that successful traders never risk more than n% of their account in any one trade. Usually this is somewhere around 3-10%. It is not normally explained why this is the case. Certainly it has the advantage of preventing a few major losses from wiping out an account. Perhaps more importantly, it has a surprisingly large impact on the affect of "compounding lot size".
When traders talk in terms of "risking" n%, they refer to the percentage of the account which would be lost if any given stop loss is triggered. Generally the distance of the stop loss is chosen before the trade is opened, and the lot size is calculated in order to make that distance in pips worth n% of the account. As profits increase then the amount available for opening each new position increases, which causes the lot sizes to increase, and causes the resulting potential gains to increase. In this way the gains are "compounded" (it is of course important to note that the affects of any losses are also compounded).
The third chart displays the results of this method. Using the third chart we can observe the effect of changing the risk on the profitability of any system. The risk is set to 1% by default.
With risk set to 1%, the performance is very similar to using a constant lotsize. As the risk is increased then the maximum potential profit is also increased. However, given a random performance, it is clear that the larger the risk is then the more likely it is that the strategy will crash out before the end. It also causes the relative drawdown to increase massively.
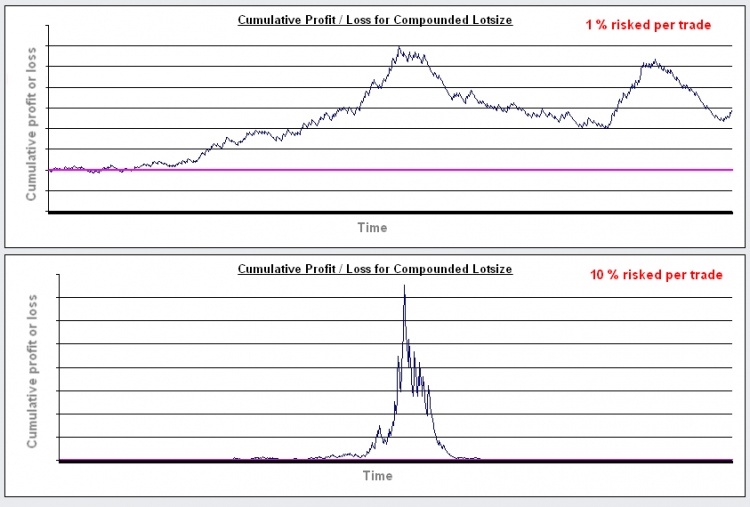
Image 3. This image shows exactly the same set of trades traded first by risking 1% per trade, and then secondly traded risking 10% per trade.
While there are some benefits to increasing % risk above 1%, this shows that beyond a certain point, rather than increasing profitability by increasing risk, you can actually decrease expected profitability by increasing risk.
Changing the risk:reward ratio or increasing the start capital may not alter this much. One thing that will significantly change this is increasing the win percentage (to reduce the likelihood of large numbers of losses in a row). Therefore there is an input box called "Force Better Performance". By increasing this value you can test what would happen if an EA performed better than would be expected simply due to chance.
It is set to a 15% improvement by default (because otherwise most randomizations would consistently fail to make net gains due to the effect of spread on the expected win rate as explained above). However, there will still be a % risk past which a strategy is almost guaranteed to crash out.
Hopefully this will make it easier to compare the increase in performance necessary to give a healthy looking graph at any % risk to the expected performance of a real life EA.
Using an EA to Simulate Placing Trades at Random (During Backtest)
The use of randomness could be extended further. An EA which actually does place trades at random in a backtest can easily be written. The performance of a real EA can be compared against this random performance over the same period, in much the same way that scientific experiments are run alongside a "control" test. Any trader who hasn't already tried this may be surprised by what can be achieved with simply placing trades at random.
For this purpose, a very simple EA is included with this article, called "Random EA" (see below). This EA is intended to place trades at random only in backtests or optimizations (this EA is not intended for live trading or even for trading on a live demo account).
The input parameters allow the percentage chance of placing a trade in any given bar to be set (up to 100% chance). Only one trade can be opened at any one time. Only one trade can occur per bar. Trades are placed at the start of the bar.
It is possible to select the stop loss and take profit distances (in points). These distances equate to the actual loss experienced from the account (and therefore already include the effects of the spread). A take profit of 300 points is equivalent in deposit currency to a stop loss of 300 here. It is also possible to select random stop losses and take profits to be used with each trade, randomized between the values of 100 to 1000 points each trade. It is designed to have an equal chance of opening a long or short trade.
The lot size can be changed between a constant (static) lot size and a dynamic lot size which risks a pre-determined percentage of the account balance per trade.
The randomization will work for multiple back tests. If optimizations are required, then simply select the "OptimizationNumber" as an optimization variable, and enter the required number of optimizations to run.
There are two important lessons that can be learned from actually placing trades at random like this:
- The SL:TP ratio can make even random trades consistently profitable over a given history period.
Users will note that changing the SL:TP ratio, so that the take profit is either significantly greater or smaller than the stop loss, will have a large effect on the performance characteristics. Importantly, it is sometimes possible to pick such a favorable SL:TP ratio for a given history period that a majority of random passes will make money. For example, if the history period being tested contains mainly a bull market, then by making the take profit significantly greater than the stop loss the user is able to skew the odds in their favor. In cases such as these it does not matter much when the trades are placed - they can literally be placed at random - and the net result will most likely be positive.
In this situation, it is therefore the SL:TP ratio which is having the main effect on the profitability of the system during back testing, and the manner in which the trades are being chosen has little importance. It is for this reason that it is often useful to test the performance of a successful EA against the performance of an EA which places trades at random over the same test period and which uses the same SL:TP ratio.
Traders have been known to congratulate themselves for having created a seemingly successful combination of indicators for their EA (according to back test results), when in fact it is the SL:TP ratio which is doing most of the "work" in their system because they tested it over a history period with a significant trend. When such systems are tested in flat markets then the good performance can disappear. Remember, it is possible for currency pairs to trend strongly for a year or more.
If you test the performance of an EA over the same history period against a randomly trading EA (with the same SL:TP ratios and lot size rules), and the performances are similar, then that may tell you something interesting about your strategy. - Placing trades at random can remain profitable for hundreds of trades.
After several backtests you may notice that some passes actually remain profitable over long periods, even when placing trades at random. This has implications for how you might go about judging the success of any given strategy when there are only a small number of trades to base that decision on. An EA placing trades at random can sometimes be seen to produce consistently profitable results during 300 trades for example, only to crash out over the next 50. Users may find this information useful for judging the performance of other strategies.
Conclusions
This article is not intended to offer advice. It is simply intended to provide a sandbox for exploration. Users must draw their own conclusions.
Notes
- Written in Excel 2003.
- Sometimes the random number generator seems to run out of numbers and stops being random. If you notice this happening then simply close and re-open the excel file.
- The calculations are designed to simulate currencies with 4 or 5 decimal places (i.e. not intended for JPY pairings).
- The randomness of the results are admittedly based upon the quality of the random number generator in excel and the crude calculations for predicting expected win rates, and therefore will not perfectly mirror results in the real world. However, for the purposes of this article that should be sufficient.
Warning: All rights to these materials are reserved by MetaQuotes Ltd. Copying or reprinting of these materials in whole or in part is prohibited.
This article was written by a user of the site and reflects their personal views. MetaQuotes Ltd is not responsible for the accuracy of the information presented, nor for any consequences resulting from the use of the solutions, strategies or recommendations described.
 Three Aspects of Manual Trading Automation. Part 1: Trading
- Free trading apps
- Over 8,000 signals for copying
- Economic news for exploring financial markets
You agree to website policy and terms of use