
Developing a Custom Market Sentiment Indicator

Introduction
Identifying the true direction of the market is challenging, especially when different timeframes tell conflicting stories. A trader may see a strong bullish move on the 30-minute chart, while the 4-hour chart still signals bearish pressure. This often leads to confusion, misaligned trades, or entering positions against the dominant market bias. Without a structured way of aligning higher and lower timeframe signals, traders risk making impulsive decisions based on incomplete information, ultimately reducing consistency and profitability.
The Market Sentiment custom indicator addresses this issue by combining signals from multiple timeframes into a single, easy-to-read panel. By analyzing higher timeframe trends alongside lower timeframe structures, it classifies the market into five clear sentiments: bullish, bearish, risk-on, risk-off, or neutral. This multi-layered approach helps traders stay aligned with the bigger picture while timing entries with short-term confirmations. As a result, it simplifies decision-making, reduces uncertainty, and improves trade alignment with prevailing market conditions.
Development and Logic
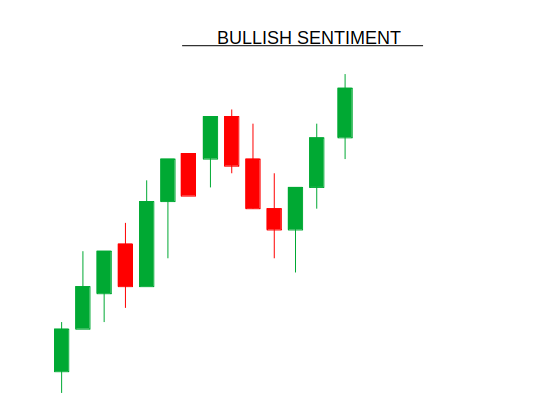
Bullish Sentiment:
Occurs when traders and investors generally expect prices to rise. This is marked by stronger buying pressure compared to selling pressure. Common signs include higher highs and higher lows in price action, strong volume on upward moves, and a positive economic or news outlook. In its extreme form, bullish sentiment can lead to euphoria, where optimism becomes excessive, often near the end of a bull run.
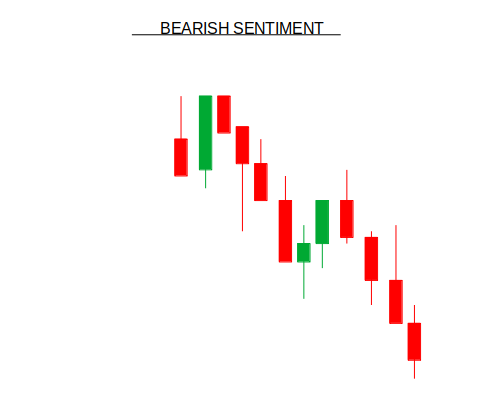
Bearish Sentiment:
Reflects an expectation that prices will fall, with more selling pressure than buying pressure. It is commonly identified through lower highs and lower lows in price action, strong volume during downward moves, and negative economic or news developments. At its extreme, bearish sentiment can manifest as panic, driving aggressive selling that often occurs at or near market bottoms.
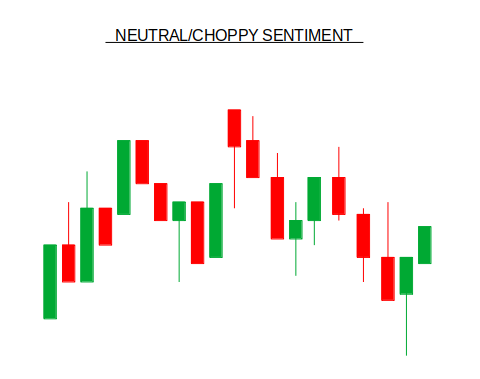
Neutral Sentiment:
Emerges when market participants are indecisive or perceive balance between buyers and sellers. In this environment, prices typically move within a range without forming a clear uptrend or downtrend. Key signs include consolidation phases, low volatility, and traders waiting on confirmation before committing to positions.
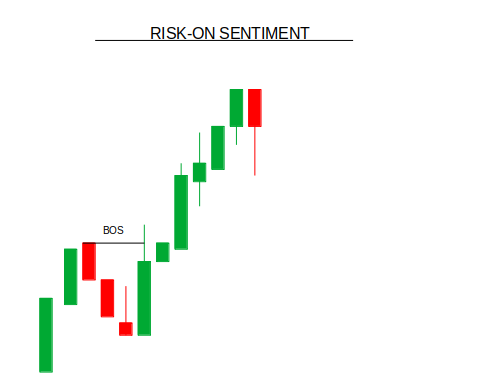
Risk-on Sentiment:
Describes a market mood in which investors are more willing to take risks, often moving into stocks, commodities, and high-yield assets. Capital flows into instruments with higher return potential. Typical signs include rising stock indices and weak demand for safe-haven assets such as gold or government bonds.
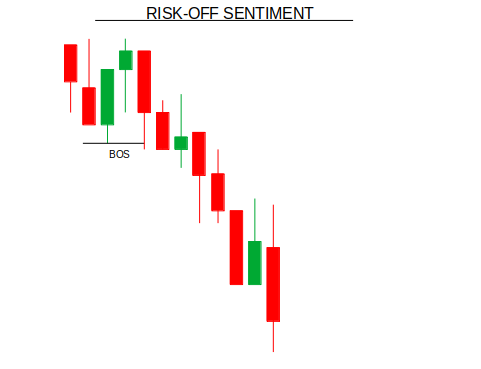
Risk-off Sentiment:
On the other hand, it arises when investors seek safety due to fear or uncertainty. In this case, capital shifts toward traditionally safer assets such as gold, the U.S. dollar, the Swiss franc, or government bonds. It is typically characterized by falling stock indices and increasing demand for safe-haven currencies and assets.
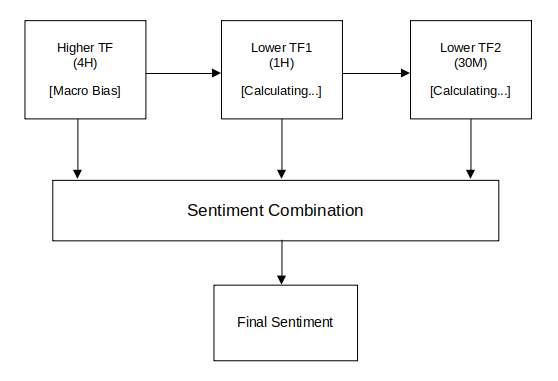
Timeframe Relationship:
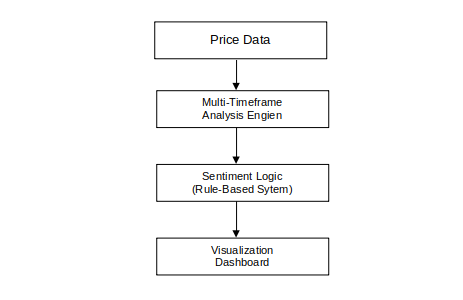
Architecture Diagram:
Getting Started
//+------------------------------------------------------------------+
//|                                                  Market_Sent.mq5 |
//|                        GIT under Copyright 2025, MetaQuotes Ltd. |
//|                     https://www.mql5.com/en/users/johnhlomohang/ |
//+------------------------------------------------------------------+
#property copyright "GIT under Copyright 2025, MetaQuotes Ltd."
#property link      "https://www.mql5.com/en/users/johnhlomohang/"
#property version   "1.00"
#property strict
#property indicator_chart_window
#property indicator_buffers 0
#property indicator_plots   0


//+------------------------------------------------------------------+
//| Input parameters                                                 |
//+------------------------------------------------------------------+
input group "Timeframe Settings"
input ENUM_TIMEFRAMES HigherTF = PERIOD_H4;
input ENUM_TIMEFRAMES LowerTF1 = PERIOD_H1;
input ENUM_TIMEFRAMES LowerTF2 = PERIOD_M30;

input group "Indicator Settings"
input int MAPeriod = 200;
input int SwingLookback = 5;
input double ATRThreshold = 0.002;

input group "Visual Settings"
// force top-left dark theme
input int PanelCorner = 0;
input int PanelX = 10;
input int PanelY = 10;
input string FontFace = "Arial";
input int FontSize = 10;
input color BullishColor = clrLimeGreen;
input color BearishColor = clrRed;
input color RiskOnColor = clrDodgerBlue;
input color RiskOffColor = clrOrangeRed;
input color NeutralColor = clrGold;
We start by setting up the framework for a custom market sentiment indicator in MQL5. The top section includes metadata such as copyright, version, and link, along with directives that define the indicator’s properties. The indicator_buffers 0 and indicator_plots 0 mean no standard buffers or plots are used, since this indicator is designed more as a panel-style visual tool rather than plotting lines or histograms. These initial settings essentially establish the environment in which the custom sentiment analysis logic will run.
The input parameters provide traders with flexibility in configuring the indicator. The “Timeframe Settings” group allows the user to select a higher timeframe (default H4) and two lower timeframes (H1 and M30) for sentiment analysis. Under “Indicator Settings,” traders can adjust technical parameters such as the moving average period, swing look-back range, and ATR threshold, which are used to interpret price behavior and volatility. Lastly, the “Visual Settings” group controls how the sentiment panel will be displayed on the chart, including its position, font style, size, and the specific colors used to represent bullish, bearish, risk-on, risk-off, and neutral conditions. Together, these inputs create a flexible foundation for detecting and visualizing market sentiment across multiple timeframes.
//+------------------------------------------------------------------+
//| Global variables                                                 |
//+------------------------------------------------------------------+
int higherTFHandle, lowerTF1Handle, lowerTF2Handle;
double higherTFMA[], lowerTF1MA[], lowerTF2MA[];
datetime lastUpdateTime = 0;
string indicatorName = "MarketSentiment";

//--- helper: convert timeframe to string
string TFtoString(int tf)
{
   switch(tf)
   {
      case PERIOD_M1:  return "M1";
      case PERIOD_M5:  return "M5";
      case PERIOD_M15: return "M15";
      case PERIOD_M30: return "M30";
      case PERIOD_H1:  return "H1";
      case PERIOD_H4:  return "H4";
      case PERIOD_D1:  return "D1";
      case PERIOD_W1:  return "W1";
      case PERIOD_MN1: return "MN";
      default: return "TF?";
   }
}
This section defines the global variables and helper function required for the market sentiment indicator. The three handle variables (higherTFHandle, lowerTF1Handle, and lowerTF2Handle) are used to store references to moving average calculations on different timeframes, while the arrays (higherTFMA[], lowerTF1MA[], lowerTF2MA[]) hold their corresponding data values. A lastUpdateTime variable is initialized to track when the indicator was last refreshed, ensuring efficient updates, and indicatorName provides a consistent label for objects drawn on the chart. Additionally, the TFtoString() helper function converts numeric timeframe constants into readable strings (e.g., PERIOD_H1 -> "H1"), which is useful for labeling or displaying information in the indicator panel.
//+------------------------------------------------------------------+
//| OnInit                                                           |
//+------------------------------------------------------------------+
int OnInit()
{
    indicatorName = "MarketSentiment_" + IntegerToString(ChartID());

    higherTFHandle = iMA(_Symbol, HigherTF, MAPeriod, 0, MODE_EMA, PRICE_CLOSE);
    lowerTF1Handle = iMA(_Symbol, LowerTF1, MAPeriod, 0, MODE_EMA, PRICE_CLOSE);
    lowerTF2Handle = iMA(_Symbol, LowerTF2, MAPeriod, 0, MODE_EMA, PRICE_CLOSE);

    ArraySetAsSeries(higherTFMA, true);
    ArraySetAsSeries(lowerTF1MA, true);
    ArraySetAsSeries(lowerTF2MA, true);

    CreatePanel();
    return(INIT_SUCCEEDED);
}
The OnInit() function initializes the market sentiment indicator by setting up unique naming for chart objects using the chart ID and creating moving average handles for the higher and lower timeframes with the specified period and EMA method. It also configures the MA arrays to be time-series oriented, which ensures easier indexing when accessing recent values. Finally, it calls the CreatePanel() function to draw the sentiment display panel on the chart, and then returns INIT_SUCCEEDED to confirm successful initialization.
//+------------------------------------------------------------------+
void OnDeinit(const int reason)
{
    ObjectsDeleteAll(0, indicatorName);
    IndicatorRelease(higherTFHandle);
    IndicatorRelease(lowerTF1Handle);
    IndicatorRelease(lowerTF2Handle);
}
The OnDeinit() function ensures proper cleanup when the indicator is removed by deleting all chart objects associated with its unique indicatorName and releasing the handles of the higher and lower timeframe moving averages, thereby preventing memory leaks and keeping the chart environment clean.
//+------------------------------------------------------------------+
int OnCalculate(const int rates_total,
                const int prev_calculated,
                const datetime &time[],
                const double &open[],
                const double &high[],
                const double &low[],
                const double &close[],
                const long &tick_volume[],
                const long &volume[],
                const int &spread[])
{
    if (TimeCurrent() - lastUpdateTime < 10 && prev_calculated > 0)
        return(rates_total);

    lastUpdateTime = TimeCurrent();

    CopyBuffer(higherTFHandle, 0, 0, 3, higherTFMA);
    CopyBuffer(lowerTF1Handle, 0, 0, 3, lowerTF1MA);
    CopyBuffer(lowerTF2Handle, 0, 0, 3, lowerTF2MA);

    double higherTFPrice = iClose(_Symbol, HigherTF, 0);
    double lowerTF1Price = iClose(_Symbol, LowerTF1, 0);
    double lowerTF2Price = iClose(_Symbol, LowerTF2, 0);

    int higherTFBias = GetHigherTFBias(higherTFPrice, higherTFMA[0]);

    bool lowerTF1Bullish = IsBullishStructure(LowerTF1, SwingLookback);
    bool lowerTF1Bearish = IsBearishStructure(LowerTF1, SwingLookback);
    bool lowerTF2Bullish = IsBullishStructure(LowerTF2, SwingLookback);
    bool lowerTF2Bearish = IsBearishStructure(LowerTF2, SwingLookback);

    bool lowerTF1Breakout = HasBreakout(LowerTF1, SwingLookback, higherTFBias);
    bool lowerTF2Breakout = HasBreakout(LowerTF2, SwingLookback, higherTFBias);

    int sentiment = DetermineSentiment(
        higherTFBias,
        lowerTF1Bullish, lowerTF1Bearish, lowerTF1Breakout,
        lowerTF2Bullish, lowerTF2Bearish, lowerTF2Breakout
    );

    UpdatePanel(higherTFBias,
                lowerTF1Bullish, lowerTF1Bearish,
                lowerTF2Bullish, lowerTF2Bearish,
                sentiment);

    return(rates_total);
}
The OnCalculate() function acts as the main processing loop of the indicator, running each time new price data or ticks arrive. It starts with an update throttle, ensuring calculations only occur if at least 10 seconds have passed since the last update, improving efficiency. The function then copies moving average values from higher and lower timeframe buffers and fetches the latest close prices for each timeframe, which form the foundation for sentiment evaluation.
After gathering price and MA data, the function determines directional bias on the higher timeframe and checks structural conditions (bullish or bearish patterns) on the lower ones. It also validates potential breakouts in alignment with the higher timeframe bias. These conditions are combined in the DetermineSentiment() function to classify the market into bullish, bearish, risk-on, risk-off, or neutral states. Finally, the results are visually reflected on the chart via UpdatePanel(), giving traders a real-time sentiment dashboard across multiple timeframes.
//+------------------------------------------------------------------+
//| Determine higher timeframe bias                                  |
//+------------------------------------------------------------------+
int GetHigherTFBias(double price, double maValue)
{
    double deviation = MathAbs(price - maValue) / maValue;
    if (price > maValue && deviation > ATRThreshold) return 1;
    else if (price < maValue && deviation > ATRThreshold) return -1;
    else return 0;
}
This function evaluates the higher timeframe trend direction by comparing the current price to its moving average value. If the price is above the MA and the deviation exceeds the defined ATR threshold, it returns 1 (bullish bias), while if the price is below with sufficient deviation, it returns -1 (bearish bias). If neither condition is met, it returns 0, signaling a neutral or indecisive higher timeframe bias.
//+------------------------------------------------------------------+
//| Bullish structure                                                |
//+------------------------------------------------------------------+
bool IsBullishStructure(ENUM_TIMEFRAMES tf, int lookback)
{
    int swingHighIndex = iHighest(_Symbol, tf, MODE_HIGH, lookback * 2, 1);
    int swingLowIndex  = iLowest (_Symbol, tf, MODE_LOW,  lookback * 2, 1);
    int prevHigh = iHighest(_Symbol, tf, MODE_HIGH, lookback, lookback+1);
    int prevLow  = iLowest (_Symbol, tf, MODE_LOW,  lookback, lookback+1);
    if (swingHighIndex==-1 || swingLowIndex==-1 || prevHigh==-1 || prevLow==-1) return false;
    return (iHigh(_Symbol, tf, swingHighIndex) > iHigh(_Symbol, tf, prevHigh) &&
            iLow(_Symbol, tf, swingLowIndex)   > iLow (_Symbol, tf, prevLow));
}
//+------------------------------------------------------------------+
//| Bearish structure                                                |
//+------------------------------------------------------------------+
bool IsBearishStructure(ENUM_TIMEFRAMES tf, int lookback)
{
    int swingHighIndex = iHighest(_Symbol, tf, MODE_HIGH, lookback * 2, 1);
    int swingLowIndex  = iLowest (_Symbol, tf, MODE_LOW,  lookback * 2, 1);
    int prevHigh = iHighest(_Symbol, tf, MODE_HIGH, lookback, lookback+1);
    int prevLow  = iLowest (_Symbol, tf, MODE_LOW,  lookback, lookback+1);
    if (swingHighIndex==-1 || swingLowIndex==-1 || prevHigh==-1 || prevLow==-1) return false;
    return (iHigh(_Symbol, tf, swingHighIndex) < iHigh(_Symbol, tf, prevHigh) &&
            iLow(_Symbol, tf, swingLowIndex)   < iLow (_Symbol, tf, prevLow));
}
The IsBullishStructure() function identifies a bullish price pattern on a given timeframe by comparing the most recent swing highs and lows with the previous swing points. It first locates the current and previous swing highs and lows using the iHighest and iLowest functions. If the current high is higher than the previous high and the current low is higher than the previous low, the function returns true, signaling a bullish structure; otherwise, it returns false.
Similarly, the IsBearishStructure() function detects a bearish pattern by comparing recent swing points to prior swings. If the current high is lower than the previous high and the current low is lower than the previous low, it returns true, indicating a bearish structure. Both functions rely on swing analysis over a specified lookback period, providing the indicator with a method to assess short-term price trends relative to their previous movements.
//+------------------------------------------------------------------+
bool HasBreakout(ENUM_TIMEFRAMES tf, int lookback, int higherTFBias)
{
    int swingHighIndex = iHighest(_Symbol, tf, MODE_HIGH, lookback, 1);
    int swingLowIndex  = iLowest (_Symbol, tf, MODE_LOW,  lookback, 1);
    if (swingHighIndex==-1 || swingLowIndex==-1) return false;
    double swingHigh = iHigh(_Symbol, tf, swingHighIndex);
    double swingLow  = iLow (_Symbol, tf, swingLowIndex);
    double price = iClose(_Symbol, tf, 0);
    if (higherTFBias==1) return (price > swingHigh);
    if (higherTFBias==-1) return (price < swingLow);
    return false;
}
This function checks whether the current price has broken above or below recent swing points on a specified timeframe, considering the higher timeframe bias. It identifies the most recent swing high and low, and if either is unavailable, it returns false. For a bullish higher timeframe bias, it returns true if the current price exceeds the swing high, while for a bearish bias, it returns true if the price falls below the swing low. If the higher timeframe bias is neutral, no breakout is considered, and the function returns false.
//+------------------------------------------------------------------+
int DetermineSentiment(int higherTFBias,
                      bool tf1Bullish, bool tf1Bearish, bool tf1Breakout,
                      bool tf2Bullish, bool tf2Bearish, bool tf2Breakout)
{
    if (higherTFBias==1 && tf1Bullish && tf2Bullish) return 1;
    if (higherTFBias==-1 && tf1Bearish && tf2Bearish) return -1;
    if (higherTFBias==1 && (tf1Breakout||tf2Breakout)) return 2;
    if (higherTFBias==-1 && (tf1Breakout||tf2Breakout)) return -2;
    return 0;
}
The DetermineSentiment() function synthesizes the market conditions across multiple timeframes to classify overall market sentiment. It returns 1 for bullish sentiment if the higher timeframe is bullish and both lower timeframes show bullish structures, -1 for bearish sentiment under the opposite conditions, 2 for risk-on if a bullish higher timeframe experiences breakouts in the lower timeframes, and -2 for risk-off if a bearish higher timeframe sees similar breakouts. If none of these conditions are met, it returns 0, indicating a neutral or choppy market state.
//+------------------------------------------------------------------+
//| Panel Creation (dark theme, top-left)                            |
//+------------------------------------------------------------------+
void CreatePanel()
{
   string bg = indicatorName + "_BG";
   ObjectCreate(0, bg, OBJ_RECTANGLE_LABEL, 0, 0, 0);
   ObjectSetInteger(0, bg, OBJPROP_XDISTANCE, PanelX);
   ObjectSetInteger(0, bg, OBJPROP_YDISTANCE, PanelY);
   ObjectSetInteger(0, bg, OBJPROP_XSIZE, 200);
   ObjectSetInteger(0, bg, OBJPROP_YSIZE, 120);
   ObjectSetInteger(0, bg, OBJPROP_CORNER, 0);
   ObjectSetInteger(0, bg, OBJPROP_BGCOLOR, clrBlack);
   ObjectSetInteger(0, bg, OBJPROP_BORDER_COLOR, clrGray);
   ObjectSetInteger(0, bg, OBJPROP_BACK, true);
   ObjectSetInteger(0, bg, OBJPROP_SELECTABLE, false);
   ObjectSetInteger(0, bg, OBJPROP_HIDDEN, true);

   string title = indicatorName + "_Title";
   ObjectCreate(0, title, OBJ_LABEL, 0, 0, 0);
   ObjectSetInteger(0, title, OBJPROP_XDISTANCE, PanelX+10);
   ObjectSetInteger(0, title, OBJPROP_YDISTANCE, PanelY+10);
   ObjectSetInteger(0, title, OBJPROP_CORNER, 0);
   ObjectSetString (0, title, OBJPROP_TEXT, "Market Sentiment");
   ObjectSetInteger(0, title, OBJPROP_COLOR, clrWhite);
   ObjectSetString (0, title, OBJPROP_FONT, FontFace);
   ObjectSetInteger(0, title, OBJPROP_FONTSIZE, FontSize);

   string tfs[3] = { TFtoString(HigherTF), TFtoString(LowerTF1), TFtoString(LowerTF2) };
   for(int i=0;i<3;i++)
   {
      string tfLabel = indicatorName+"_TF"+(string)i;
      ObjectCreate(0, tfLabel, OBJ_LABEL, 0,0,0);
      ObjectSetInteger(0, tfLabel, OBJPROP_XDISTANCE, PanelX+10);
      ObjectSetInteger(0, tfLabel, OBJPROP_YDISTANCE, PanelY+30+i*20);
      ObjectSetInteger(0, tfLabel, OBJPROP_CORNER, 0);
      ObjectSetString (0, tfLabel, OBJPROP_TEXT, tfs[i]+":");
      ObjectSetInteger(0, tfLabel, OBJPROP_COLOR, clrLightGray);
      ObjectSetString (0, tfLabel, OBJPROP_FONT, FontFace);
      ObjectSetInteger(0, tfLabel, OBJPROP_FONTSIZE, FontSize);

      string sentLabel = indicatorName+"_Sentiment"+(string)i;
      ObjectCreate(0, sentLabel, OBJ_LABEL, 0,0,0);
      ObjectSetInteger(0, sentLabel, OBJPROP_XDISTANCE, PanelX+100);
      ObjectSetInteger(0, sentLabel, OBJPROP_YDISTANCE, PanelY+30+i*20);
      ObjectSetInteger(0, sentLabel, OBJPROP_CORNER, 0);
      ObjectSetString (0, sentLabel, OBJPROP_TEXT, "N/A");
      ObjectSetInteger(0, sentLabel, OBJPROP_COLOR, NeutralColor);
      ObjectSetString (0, sentLabel, OBJPROP_FONT, FontFace);
      ObjectSetInteger(0, sentLabel, OBJPROP_FONTSIZE, FontSize);
   }

   string fnl = indicatorName+"_Final";
   ObjectCreate(0, fnl, OBJ_LABEL, 0,0,0);
   ObjectSetInteger(0, fnl, OBJPROP_XDISTANCE, PanelX+10);
   ObjectSetInteger(0, fnl, OBJPROP_YDISTANCE, PanelY+100);
   ObjectSetInteger(0, fnl, OBJPROP_CORNER, 0);
   ObjectSetString (0, fnl, OBJPROP_TEXT, "Final: Neutral");
   ObjectSetInteger(0, fnl, OBJPROP_COLOR, NeutralColor);
   ObjectSetString (0, fnl, OBJPROP_FONT, FontFace);
   ObjectSetInteger(0, fnl, OBJPROP_FONTSIZE, FontSize+2);
}
The CreatePanel() function initializes a visually organized panel on the chart’s top-left corner, using a dark theme suitable for black-on-white chart backgrounds. It first creates a background rectangle with a black fill and gray border, ensuring it sits behind other chart objects and is non-selectable. A title label is then added on top of the panel, clearly identifying it as the "Market Sentiment" indicator, using white text for visibility against the dark background.
Below the title, the function generates labels for each of the three monitored timeframes—higher and lower—displaying their names alongside placeholder sentiment values initialized as "N/A" in a neutral color. Finally, a larger label at the bottom summarizes the final market sentiment, initially set to "Neutral." This setup allows for easy visual tracking of market bias across multiple timeframes in a single, compact panel.
//+------------------------------------------------------------------+
//| Panel Update                                                     |
//+------------------------------------------------------------------+
void UpdatePanel(int higherTFBias,
                 bool tf1Bullish, bool tf1Bearish,
                 bool tf2Bullish, bool tf2Bearish,
                 int sentiment)
{
    // Higher TF
    string txt="Neutral"; color col=NeutralColor;
    if(higherTFBias==1){txt="Bullish"; col=BullishColor;}
    else if(higherTFBias==-1){txt="Bearish"; col=BearishColor;}
    ObjectSetString(0, indicatorName+"_Sentiment0", OBJPROP_TEXT, txt);
    ObjectSetInteger(0, indicatorName+"_Sentiment0", OBJPROP_COLOR, col);

    // Lower TF1
    txt="Neutral"; col=NeutralColor;
    if(tf1Bullish){txt="Bullish"; col=BullishColor;}
    else if(tf1Bearish){txt="Bearish"; col=BearishColor;}
    ObjectSetString(0, indicatorName+"_Sentiment1", OBJPROP_TEXT, txt);
    ObjectSetInteger(0, indicatorName+"_Sentiment1", OBJPROP_COLOR, col);

    // Lower TF2
    txt="Neutral"; col=NeutralColor;
    if(tf2Bullish){txt="Bullish"; col=BullishColor;}
    else if(tf2Bearish){txt="Bearish"; col=BearishColor;}
    ObjectSetString(0, indicatorName+"_Sentiment2", OBJPROP_TEXT, txt);
    ObjectSetInteger(0, indicatorName+"_Sentiment2", OBJPROP_COLOR, col);

    // Final
    string finalSent="Neutral"; color finalCol=NeutralColor;
    switch(sentiment){
        case 1: finalSent="Bullish"; finalCol=BullishColor; break;
        case -1: finalSent="Bearish"; finalCol=BearishColor; break;
        case 2: finalSent="Risk-On"; finalCol=RiskOnColor; break;
        case -2: finalSent="Risk-Off"; finalCol=RiskOffColor; break;
    }
    ObjectSetString(0, indicatorName+"_Final", OBJPROP_TEXT, "Final: "+finalSent);
    ObjectSetInteger(0, indicatorName+"_Final", OBJPROP_COLOR, finalCol);
}
The UpdatePanel() function dynamically refreshes the market sentiment panel based on the latest analysis. It first evaluates the higher timeframe bias, updating its corresponding label with either "Bullish," "Bearish," or "Neutral" and coloring it appropriately. Then, it does the same for the two lower timeframes, checking their bullish or bearish structures and reflecting the results in their respective labels with the correct color coding.
Finally, the function determines the overall market sentiment by evaluating the combined biases and breakouts across all timeframes. The final sentiment label is updated to show "Bullish," "Bearish," "Risk-On," "Risk-Off," or "Neutral," with a corresponding color to provide a quick, visually clear summary of the current market condition. This ensures traders can instantly gauge market direction across multiple timeframes at a glance.
Conclusion
In summary, we developed a custom market sentiment indicator that integrates multiple timeframes to provide a clear, visual representation of market conditions. The indicator calculates moving averages on higher and lower timeframes, identifies bullish or bearish structures using swing highs and lows, detects potential breakouts, and determines an overall sentiment. A top-left, dark-themed panel displays the sentiment for each timeframe as well as a combined final sentiment, with color coding to quickly distinguish bullish, bearish, risk-on, risk-off, and neutral conditions.
In conclusion, this indicator helps traders make more informed decisions by consolidating complex market data into an easy-to-read, visual format. By providing multi-timeframe sentiment analysis in real time, it allows traders to quickly assess market trends, identify potential trade opportunities, and align their strategies with the prevailing market conditions, reducing uncertainty and enhancing decision-making efficiency.
Warning: All rights to these materials are reserved by MetaQuotes Ltd. Copying or reprinting of these materials in whole or in part is prohibited.
This article was written by a user of the site and reflects their personal views. MetaQuotes Ltd is not responsible for the accuracy of the information presented, nor for any consequences resulting from the use of the solutions, strategies or recommendations described.

- Free trading apps
- Over 8,000 signals for copying
- Economic news for exploring financial markets
You agree to website policy and terms of use