Articles with MQL5 programming examples
Access a huge collection of articles with code examples showing how to create indicators and trading robots for the MetaTrader platform in the MQL5 language. Source codes are attached to the articles, so you can open them in MetaEditor and run them to see how the applications work.
These articles will be useful both for those who have just started exploring automated trading and for professional traders with programming experience. They feature not only examples, but also contain new ideas.
Add a new article

You are missing trading opportunities:
- Free trading apps
- Over 8,000 signals for copying
- Economic news for exploring financial markets
Registration
Log in
You agree to website policy and terms of use
If you do not have an account, please register
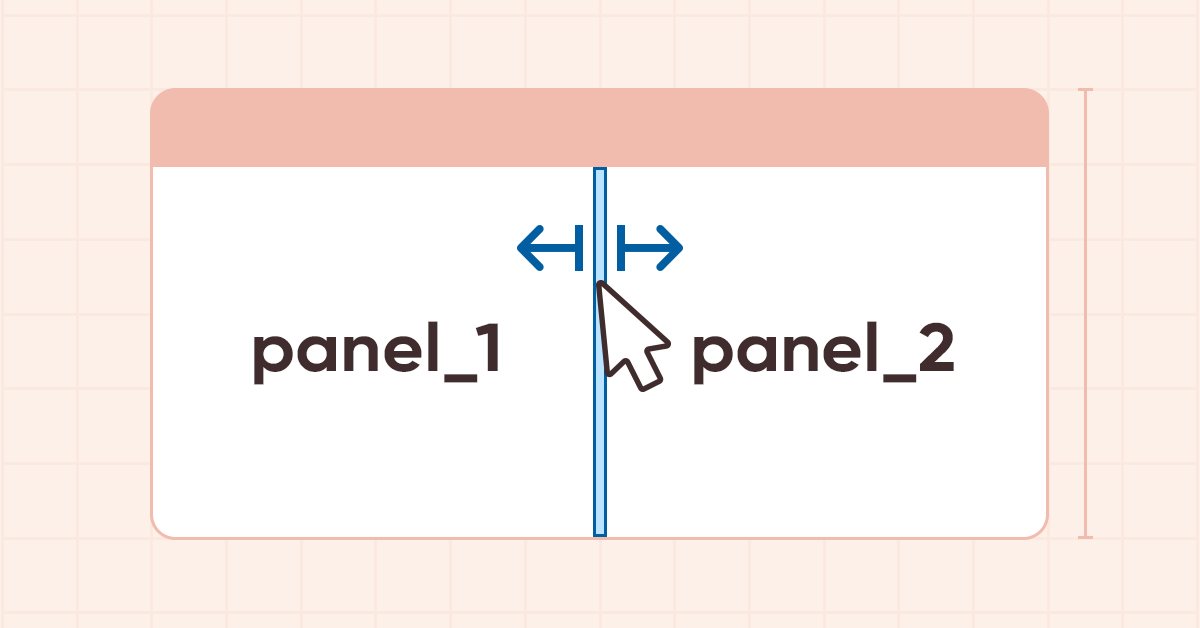
DoEasy. Controls (Part 24): Hint auxiliary WinForms object
In this article, I will revise the logic of specifying the base and main objects for all WinForms library objects, develop a new Hint base object and several of its derived classes to indicate the possible direction of moving the separator.

DoEasy. Controls (Part 27): Working on ProgressBar WinForms object
In this article, I will continue the development of the ProgressBar control. In particular, I will create the functionality for managing the progress bar and visual effects.

Price Action Analysis Toolkit Development (Part 34): Turning Raw Market Data into Predictive Models Using an Advanced Ingestion Pipeline
Have you ever missed a sudden market spike or been caught off‑guard when one occurred? The best way to anticipate live events is to learn from historical patterns. Intending to train an ML model, this article begins by showing you how to create a script in MetaTrader 5 that ingests historical data and sends it to Python for storage—laying the foundation for your spike‑detection system. Read on to see each step in action.

Implementation of the Augmented Dickey Fuller test in MQL5
In this article we demonstrate the implementation of the Augmented Dickey-Fuller test, and apply it to conduct cointegration tests using the Engle-Granger method.

Population optimization algorithms: Bat algorithm (BA)
In this article, I will consider the Bat Algorithm (BA), which shows good convergence on smooth functions.

Indicator of historical positions on the chart as their profit/loss diagram
In this article, I will consider the option of obtaining information about closed positions based on their trading history. Besides, I will create a simple indicator that displays the approximate profit/loss of positions on each bar as a diagram.

From Basic to Intermediate: Array (I)
This article is a transition between what has been discussed so far and a new stage of research. To understand this article, you need to read the previous ones. The content presented here is intended solely for educational purposes. Under no circumstances should the application be viewed for any purpose other than to learn and master the concepts presented.

From Novice to Expert: Revealing the Candlestick Shadows (Wicks)
In this discussion, we take a step forward to uncover the underlying price action hidden within candlestick wicks. By integrating a wick visualization feature into the Market Periods Synchronizer, we enhance the tool with greater analytical depth and interactivity. This upgraded system allows traders to visualize higher-timeframe price rejections directly on lower-timeframe charts, revealing detailed structures that were once concealed within the shadows.

Data label for time series mining (Part 6):Apply and Test in EA Using ONNX
This series of articles introduces several time series labeling methods, which can create data that meets most artificial intelligence models, and targeted data labeling according to needs can make the trained artificial intelligence model more in line with the expected design, improve the accuracy of our model, and even help the model make a qualitative leap!

Developing a Replay System — Market simulation (Part 17): Ticks and more ticks (I)
Here we will see how to implement something really interesting, but at the same time very difficult due to certain points that can be very confusing. The worst thing that can happen is that some traders who consider themselves professionals do not know anything about the importance of these concepts in the capital market. Well, although we focus here on programming, understanding some of the issues involved in market trading is paramount to what we are going to implement.

Population optimization algorithms: Binary Genetic Algorithm (BGA). Part II
In this article, we will look at the binary genetic algorithm (BGA), which models the natural processes that occur in the genetic material of living things in nature.

Black Hole Algorithm (BHA)
The Black Hole Algorithm (BHA) uses the principles of black hole gravity to optimize solutions. In this article, we will look at how BHA attracts the best solutions while avoiding local extremes, and why this algorithm has become a powerful tool for solving complex problems. Learn how simple ideas can lead to impressive results in the world of optimization.

Brain Storm Optimization algorithm (Part II): Multimodality
In the second part of the article, we will move on to the practical implementation of the BSO algorithm, conduct tests on test functions and compare the efficiency of BSO with other optimization methods.

Moving to MQL5 Algo Forge (Part 3): Using External Repositories in Your Own Projects
Let's explore how you can start integrating external code from any repository in the MQL5 Algo Forge storage into your own project. In this article, we finally turn to this promising, yet more complex, task: how to practically connect and use libraries from third-party repositories within MQL5 Algo Forge.

Reusing Invalidated Orderblocks As Mitigation Blocks (SMC)
In this article, we explore how previously invalidated orderblocks can be reused as mitigation blocks within Smart Money Concepts (SMC). These zones reveal where institutional traders re-enter the market after a failed orderblock, providing high-probability areas for trade continuation in the dominant trend.

Price Action Analysis Toolkit Development (Part 59): Using Geometric Asymmetry to Identify Precision Breakouts from Fractal Consolidation
While studying a wide range of breakout setups, I noticed that failed breakouts were rarely caused by a lack of volatility, but more often by weak internal structure. That observation led to the framework presented in this article. The approach identifies patterns where the final price leg shows superior length, steepness, and speed—clear signs of momentum accumulation ahead of directional expansion. By detecting these subtle geometric imbalances within consolidation, traders can anticipate higher-probability breakouts before price exits the range. Continue reading to see how this fractal-based, geometric framework translates structural imbalance into precise breakout signals.

Building A Candlestick Trend Constraint Model (Part 9): Multiple Strategies Expert Advisor (II)
The number of strategies that can be integrated into an Expert Advisor is virtually limitless. However, each additional strategy increases the complexity of the algorithm. By incorporating multiple strategies, an Expert Advisor can better adapt to varying market conditions, potentially enhancing its profitability. Today, we will explore how to implement MQL5 for one of the prominent strategies developed by Richard Donchian, as we continue to enhance the functionality of our Trend Constraint Expert.

Creating a Trading Administrator Panel in MQL5 (Part V): Two-Factor Authentication (2FA)
Today, we will discuss enhancing security for the Trading Administrator Panel currently under development. We will explore how to implement MQL5 in a new security strategy, integrating the Telegram API for two-factor authentication (2FA). This discussion will provide valuable insights into the application of MQL5 in reinforcing security measures. Additionally, we will examine the MathRand function, focusing on its functionality and how it can be effectively utilized within our security framework. Continue reading to discover more!

DoEasy. Service functions (Part 1): Price patterns
In this article, we will start developing methods for searching for price patterns using timeseries data. A pattern has a certain set of parameters, common to any type of patterns. All data of this kind will be concentrated in the object class of the base abstract pattern. In the current article, we will create an abstract pattern class and a Pin Bar pattern class.


Simultaneous Displaying of the Signals of Several Indicators from the Four Timeframes
While manual trading you have to keep an eye on the values of several indicators. It is a little bit different from mechanical trading. If you have two or three indicators and you have chosen a one timeframe for trading, it is not a complicated task. But what will you do if you have five or six indicators and your trading strategy requires considering the signals on the several timeframes?

Idleness is the Stimulus to Progress. Semiautomatic Marking a Template
Among the dozens of examples of how to work with charts, there is a method of manual marking a template. Trend lines, channels, support/resistance levels, etc. are imposed in a chart. Surely, there are some special programs for this kind of work. Everyone decides on his/her own which method to use. In this article, I offer you for your consideration the methods of manual marking with subsequent automating some elements of the repeated routine actions.

Market Simulation (Part 14): Sockets (VIII)
Many programmers might assume we should abandon using Excel and move directly to Python, using some packages that allow Python to generate an Excel file for later analysis of results. However, as mentioned in the previous article, although this solution is the simplest for many programmers, it will not be accepted by some users. And in this particular case, the user is always right. As programmers, we must find a way to make everything work.

Custom Indicator: Plotting Partial Entry, Exit and Reversal Deals for Netting Accounts
In this article, we will look at a non-standard way of creating an indicator in MQL5. Instead of focusing on a trend or chart pattern, our goal will be to manage our own positions, including partial entries and exits. We will make extensive use of dynamic matrices and some trading functions related to trade history and open positions to indicate on the chart where these trades were made.

Functions for activating neurons during training: The key to fast convergence?
This article presents a study of the interaction of different activation functions with optimization algorithms in the context of neural network training. Particular attention is paid to the comparison of the classical ADAM and its population version when working with a wide range of activation functions, including the oscillating ACON and Snake functions. Using a minimalistic MLP (1-1-1) architecture and a single training example, the influence of activation functions on the optimization is isolated from other factors. The article proposes an approach to manage network weights through the boundaries of activation functions and a weight reflection mechanism, which allows avoiding problems with saturation and stagnation in training.

Websockets for MetaTrader 5: Asynchronous client connections with the Windows API
This article details the development of a custom dynamically linked library designed to facilitate asynchronous websocket client connections for MetaTrader programs.

Developing a Replay System (Part 74): New Chart Trade (I)
In this article, we will modify the last code shown in this series about Chart Trade. These changes are necessary to adapt the code to the current replay/simulation system model. The content presented here is intended solely for educational purposes. Under no circumstances should the application be viewed for any purpose other than to learn and master the concepts presented.

Combine Fundamental And Technical Analysis Strategies in MQL5 For Beginners
In this article, we will discuss how to integrate trend following and fundamental principles seamlessly into one Expert Advisors to build a strategy that is more robust. This article will demonstrate how easy it is for anyone to get up and running building customized trading algorithms using MQL5.

DoEasy. Controls (Part 22): SplitContainer. Changing the properties of the created object
In the current article, I will implement the ability to change the properties and appearance of the newly created SplitContainer control.
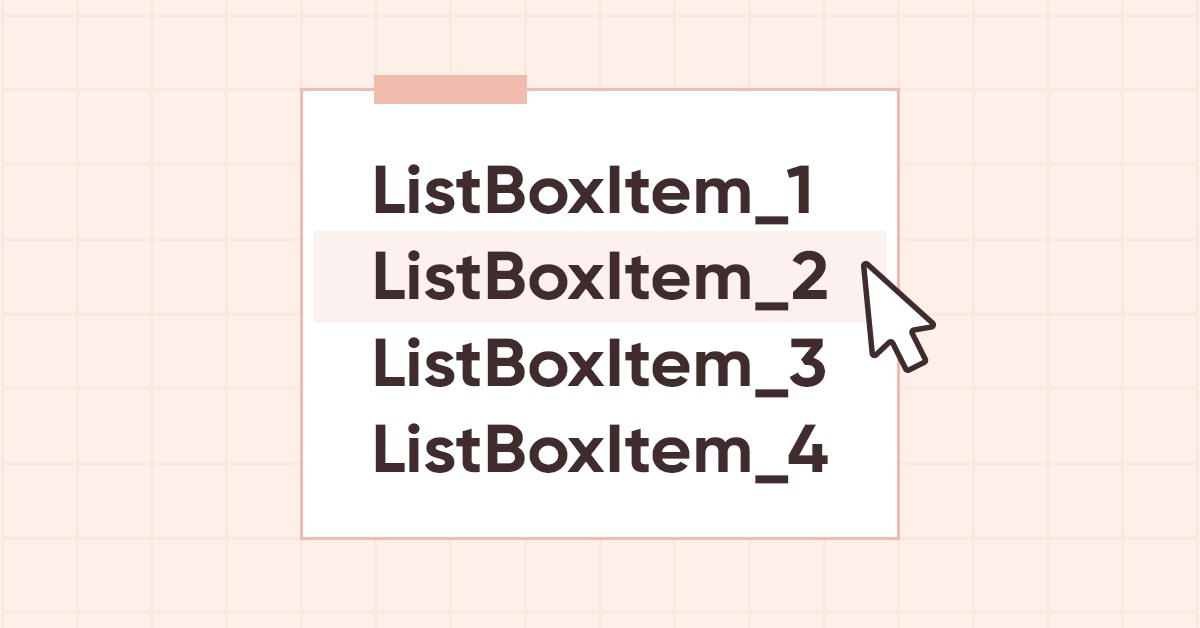
DoEasy. Controls (Part 12): Base list object, ListBox and ButtonListBox WinForms objects
In this article, I am going to create the base object of WinForms object lists, as well as the two new objects: ListBox and ButtonListBox.

Price Action Analysis Toolkit Development (Part 37): Sentiment Tilt Meter
Market sentiment is one of the most overlooked yet powerful forces influencing price movement. While most traders rely on lagging indicators or guesswork, the Sentiment Tilt Meter (STM) EA transforms raw market data into clear, visual guidance, showing whether the market is leaning bullish, bearish, or staying neutral in real-time. This makes it easier to confirm trades, avoid false entries, and time market participation more effectively.

Turtle Shell Evolution Algorithm (TSEA)
This is a unique optimization algorithm inspired by the evolution of the turtle shell. The TSEA algorithm emulates the gradual formation of keratinized skin areas, which represent optimal solutions to a problem. The best solutions become "harder" and are located closer to the outer surface, while the less successful solutions remain "softer" and are located inside. The algorithm uses clustering of solutions by quality and distance, allowing to preserve less successful options and providing flexibility and adaptability.

Developing a Replay System (Part 32): Order System (I)
Of all the things that we have developed so far, this system, as you will probably notice and eventually agree, is the most complex. Now we need to do something very simple: make our system simulate the operation of a trading server. This need to accurately implement the way the trading server operates seems like a no-brainer. At least in words. But we need to do this so that the everything is seamless and transparent for the user of the replay/simulation system.

DoEasy. Controls (Part 21): SplitContainer control. Panel separator
In this article, I will create the class of an auxiliary panel separator object for the SplitContainer control.

Creating a Trading Administrator Panel in MQL5 (Part VI):Trade Management Panel (II)
In this article, we enhance the Trade Management Panel of our multi-functional Admin Panel. We introduce a powerful helper function that simplifies the code, improving readability, maintainability, and efficiency. We will also demonstrate how to seamlessly integrate additional buttons and enhance the interface to handle a wider range of trading tasks. Whether managing positions, adjusting orders, or simplifying user interactions, this guide will help you develop a robust, user-friendly Trade Management Panel.

From Basic to Intermediate: Template and Typename (I)
In this article, we start considering one of the concepts that many beginners avoid. This is related to the fact that templates are not an easy topic, as many do not understand the basic principle underlying the template: overload of functions and procedures.

Grouped File Operations
It is sometimes necessary to perform identical operations with a group of files. If you have a list of files included into a group, then it is no problem. However, if you need to make this list yourself, then a question arises: "How can I do this?" The article proposes doing this using functions FindFirstFile() and FindNextFile() included in kernel32.dll.

Mastering Log Records (Part 1): Fundamental Concepts and First Steps in MQL5
Welcome to the beginning of another journey! This article opens a special series where we will create, step by step, a library for log manipulation, tailored for those who develop in the MQL5 language.

Elastic net regression using coordinate descent in MQL5
In this article we explore the practical implementation of elastic net regression to minimize overfitting and at the same time automatically separate useful predictors from those that have little prognostic power.

Developing a Replay System (Part 48): Understanding the concept of a service
How about learning something new? In this article, you will learn how to convert scripts into services and why it is useful to do so.

Creating a Trading Administrator Panel in MQL5 (Part II): Enhancing Responsiveness and Quick Messaging
In this article, we will enhance the responsiveness of the Admin Panel that we previously created. Additionally, we will explore the significance of quick messaging in the context of trading signals.