Articles with MQL5 programming examples

Access a huge collection of articles with code examples showing how to create indicators and trading robots for the MetaTrader platform in the MQL5 language. Source codes are attached to the articles, so you can open them in MetaEditor and run them to see how the applications work.
These articles will be useful both for those who have just started exploring automated trading and for professional traders with programming experience. They feature not only examples, but also contain new ideas.
Add a new article

You are missing trading opportunities:
- Free trading apps
- Over 8,000 signals for copying
- Economic news for exploring financial markets
Registration
Log in
You agree to website policy and terms of use
If you do not have an account, please register


DIY technical indicator
In this article, I will consider the algorithms allowing you to create your own technical indicator. You will learn how to obtain pretty complex and interesting results with very simple initial assumptions.


Moving Average in MQL5 from scratch: Plain and simple
Using simple examples, we will examine the principles of calculating moving averages, as well as learn about the ways to optimize indicator calculations, including moving averages.

LibMatrix: Library of Matrix Algebra (Part One)
The author familiarizes the readers with a simple library of matrix algebra and provides descriptions and peculiarities of the main functions.


Timeseries in DoEasy library (part 58): Timeseries of indicator buffer data
In conclusion of the topic of working with timeseries organise storage, search and sort of data stored in indicator buffers which will allow to further perform the analysis based on values of the indicators to be created on the library basis in programs. The general concept of all collection classes of the library allows to easily find necessary data in the corresponding collection. Respectively, the same will be possible in the class created today.

Growing Neural Gas: Implementation in MQL5
The article shows an example of how to develop an MQL5-program implementing the adaptive algorithm of clustering called Growing neural gas (GNG). The article is intended for the users who have studied the language documentation and have certain programming skills and basic knowledge in the area of neuroinformatics.

Graphics in DoEasy library (Part 94): Moving and deleting composite graphical objects
In this article, I will start the development of various composite graphical object events. We will also partially consider moving and deleting a composite graphical object. In fact, here I am going to fine-tune the things I implemented in the previous article.


From Novice to Expert: Programming Candlesticks
In this article, we take the first step in MQL5 programming, even for complete beginners. We'll show you how to transform familiar candlestick patterns into a fully functional custom indicator. Candlestick patterns are valuable as they reflect real price action and signal market shifts. Instead of manually scanning charts—an approach prone to errors and inefficiencies—we'll discuss how to automate the process with an indicator that identifies and labels patterns for you. Along the way, we’ll explore key concepts like indexing, time series, Average True Range (for accuracy in varying market volatility), and the development of a custom reusable Candlestick Pattern library for use in future projects.


Population optimization algorithms: Particle swarm (PSO)
In this article, I will consider the popular Particle Swarm Optimization (PSO) algorithm. Previously, we discussed such important characteristics of optimization algorithms as convergence, convergence rate, stability, scalability, as well as developed a test stand and considered the simplest RNG algorithm.


Neural networks made easy (Part 14): Data clustering
It has been more than a year since I published my last article. This is quite a lot time to revise ideas and to develop new approaches. In the new article, I would like to divert from the previously used supervised learning method. This time we will dip into unsupervised learning algorithms. In particular, we will consider one of the clustering algorithms—k-means.

Prices in DoEasy library (part 60): Series list of symbol tick data
In this article, I will create the list for storing tick data of a single symbol and check its creation and retrieval of required data in an EA. Tick data lists that are individual for each used symbol will further constitute a collection of tick data.

Better Programmer (Part 04): How to become a faster developer
Every developer wants to be able to write code faster, and being able to code faster and effective is not some kind of special ability that only a few people are born with. It's a skill that can be learned by every coder, regardless of years of experience on the keyboard.


Master MQL5 from Beginner to Pro (Part VI): Basics of Developing Expert Advisors
This article continues the series for beginners. Here we will discuss the basic principles of developing Expert Advisors (EAs). We will create two EAs: the first one will trade without indicators, using pending orders, and the second one will be based on the standard MA indicator, opening deals at the current price. Here I assume that you are no longer a complete beginner and have a relatively good command of the material from the previous articles.

Graphics in DoEasy library (Part 80): "Geometric animation frame" object class
In this article, I will optimize the code of classes from the previous articles and create the geometric animation frame object class allowing us to draw regular polygons with a given number of vertices.

Library for easy and quick development of MetaTrader programs (part IX): Compatibility with MQL4 - Preparing data
In the previous articles, we started creating a large cross-platform library simplifying the development of programs for MetaTrader 5 and MetaTrader 4 platforms. In the eighth part, we implemented the class for tracking order and position modification events. Here, we will improve the library by making it fully compatible with MQL4.


Structures in MQL5 and methods for printing their data
In this article we will look at the MqlDateTime, MqlTick, MqlRates and MqlBookInfo strutures, as well as methods for printing data from them. In order to print all the fields of a structure, there is a standard ArrayPrint() function, which displays the data contained in the array with the type of the handled structure in a convenient tabular format.

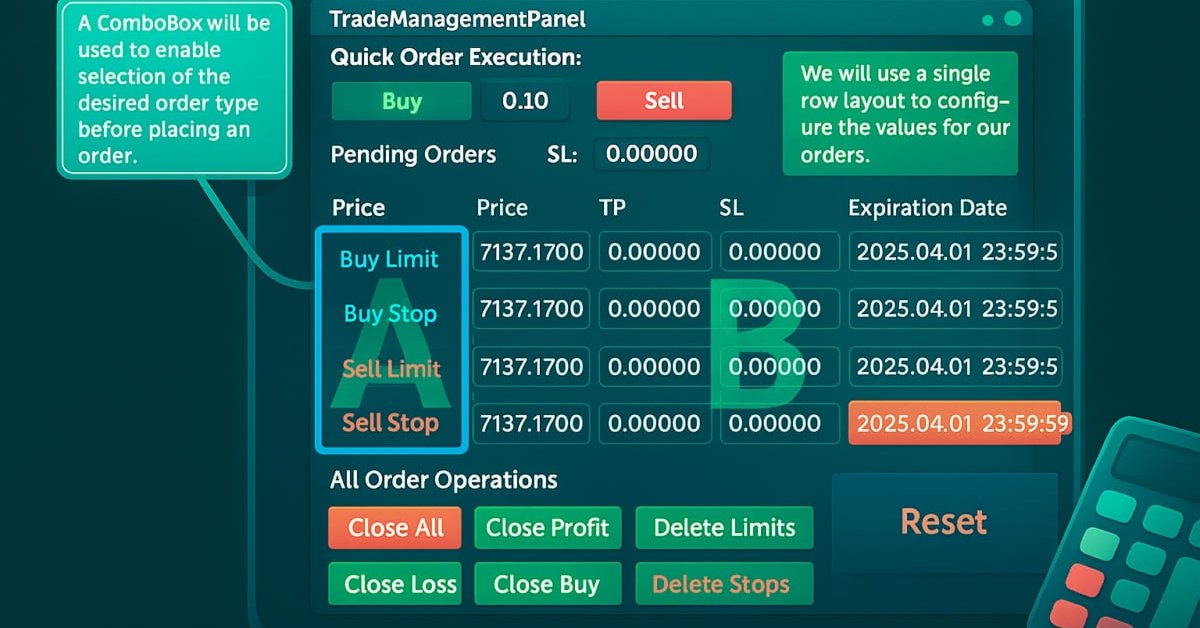
Creating a Trading Administrator Panel in MQL5 (Part XII): Integration of a Forex Values Calculator
Accurate calculation of key trading values is an indispensable part of every trader’s workflow. In this article, we will discuss, the integration of a powerful utility—the Forex Calculator—into the Trade Management Panel, further extending the functionality of our multi-panel Trading Administrator system. Efficiently determining risk, position size, and potential profit is essential when placing trades, and this new feature is designed to make that process faster and more intuitive within the panel. Join us as we explore the practical application of MQL5 in building advanced, trading panels.


Timeseries in DoEasy library (part 55): Indicator collection class
The article continues developing indicator object classes and their collections. For each indicator object create its description and correct collection class for error-free storage and getting indicator objects from the collection list.


From Novice to Expert: Creating a Liquidity Zone Indicator
The extent of liquidity zones and the magnitude of the breakout range are key variables that substantially affect the probability of a retest occurring. In this discussion, we outline the complete process for developing an indicator that incorporates these ratios.

Prices in DoEasy library (part 62): Updating tick series in real time, preparation for working with Depth of Market
In this article, I will implement updating tick data in real time and prepare the symbol object class for working with Depth of Market (DOM itself is to be implemented in the next article).


William Gann methods (Part II): Creating Gann Square indicator
We will create an indicator based on the Gann's Square of 9, built by squaring time and price. We will prepare the code and test the indicator in the platform on different time intervals.

Drawing Horizontal Break-Through Levels Using Fractals
The article describes creation of an indicator that would display the support/resistance levels using up/down fractals.


Reimagining Classic Strategies (Part 19): Deep Dive Into Moving Average Crossovers
This article revisits the classic moving average crossover strategy and examines why it often fails in noisy, fast-moving markets. It presents five alternative filtering methods designed to strengthen signal quality and remove weak or unprofitable trades. The discussion highlights how statistical models can learn and correct the errors that human intuition and traditional rules miss. Readers leave with a clearer understanding of how to modernize an outdated strategy and of the pitfalls of relying solely on metrics like RMSE in financial modeling.

Getting Started with MQL5 Algo Forge
We are introducing MQL5 Algo Forge — a dedicated portal for algorithmic trading developers. It combines the power of Git with an intuitive interface for managing and organizing projects within the MQL5 ecosystem. Here, you can follow interesting authors, form teams, and collaborate on algorithmic trading projects.


Swing Extremes and Pullbacks in MQL5 (Part 1): Developing a Multi-Timeframe Indicator
In this discussion we will Automate Swing Extremes and the Pullback Indicator, which transforms raw lower-timeframe (LTF) price action into a structured map of market intent, precisely identifying swing highs, swing lows, and corrective phases in real time. By programmatically tracking microstructure shifts, it anticipates potential reversals before they fully unfold—turning noise into actionable insight.

Other classes in DoEasy library (Part 67): Chart object class
In this article, I will create the chart object class (of a single trading instrument chart) and improve the collection class of MQL5 signal objects so that each signal object stored in the collection updates all its parameters when updating the list.


Backpropagation Neural Networks using MQL5 Matrices
The article describes the theory and practice of applying the backpropagation algorithm in MQL5 using matrices. It provides ready-made classes along with script, indicator and Expert Advisor examples.


Ready-made templates for including indicators to Expert Advisors (Part 1): Oscillators
The article considers standard indicators from the oscillator category. We will create ready-to-use templates for their use in EAs - declaring and setting parameters, indicator initialization and deinitialization, as well as receiving data and signals from indicator buffers in EAs.

MQL4 Language for Newbies. Difficult Questions in Simple Phrases.
This is the second article from the series "MQL4 Language for Newbies". Now we will examine more complex and advanced constructions of the language, learn new options and see, how they can be applied in everyday practice. You will get acquainted with a new cycle type 'while', new condition type 'switch', operators 'break' and 'continue'. Besides you will learn to write your own functions and work with multidimensional arrays. And for a dessert I have prepared an explanation about a preprocessor.

Graphical interfaces X: New features for the Rendered table (build 9)
Until today, the CTable was the most advanced type of tables among all presented in the library. This table is assembled from edit boxes of the OBJ_EDIT type, and its further development becomes problematic. Therefore, in terms of maximum capabilities, it is better to develop rendered tables of the CCanvasTable type even at the current development stage of the library. Its current version is completely lifeless, but starting from this article, we will try to fix the situation.


Canvas based indicators: Filling channels with transparency
In this article I'll introduce a method for creating custom indicators whose drawings are made using the class CCanvas from standard library and see charts properties for coordinates conversion. I'll approach specially indicators which need to fill the area between two lines using transparency.


Tables in the MVC Paradigm in MQL5: Customizable and sortable table columns
In the article, we will make the table column widths adjustable using the mouse cursor, sort the table by column data, and add a new class to simplify the creation of tables based on any data sets.

A Library for Constructing a Chart via Google Chart API
The construction of various types of diagrams is an essential part of the analyses of the market situation and the testing of a trading system. Frequently, in order to construct a nice looking diagram, it is necessary to organize the data output into a file, after which it is used in applications such as MS Excel. This is not very convenient and deprives us of the ability to dynamically update the data. Google Charts API provided the means for creating charts in online modes, by sending a special request to the server. In this article we attempt to automate the process of creating such a request and obtaining a chart from the Google server.

Timeseries in DoEasy library (part 56): Custom indicator object, get data from indicator objects in the collection
The article considers creation of the custom indicator object for the use in EAs. Let’s slightly improve library classes and add methods to get data from indicator objects in EAs.


Master MQL5 from beginner to pro (Part II): Basic data types and use of variable
This is a continuation of the series for beginners. In this article, we'll look at how to create constants and variables, write dates, colors, and other useful data. We will learn how to create enumerations like days of the week or line styles (solid, dotted, etc.). Variables and expressions are the basis of programming. They are definitely present in 99% of programs, so understanding them is critical. Therefore, if you are new to programming, this article can be very useful for you. Required programming knowledge level: very basic, within the limits of my previous article (see the link at the beginning).


Gain An Edge Over Any Market
Learn how you can get ahead of any market you wish to trade, regardless of your current level of skill.


ALGLIB numerical analysis library in MQL5
The article takes a quick look at the ALGLIB 3.19 numerical analysis library, its applications and new algorithms that can improve the efficiency of financial data analysis.

Graphics in DoEasy library (Part 87): Graphical object collection - managing object property modification on all open charts
In this article, I will continue my work on tracking standard graphical object events and create the functionality allowing users to control changes in the properties of graphical objects placed on any charts opened in the terminal.


Reimagining Classic Strategies (Part 18): Searching For Candlestick Patterns
This article helps new community members search for and discover their own candlestick patterns. Describing these patterns can be daunting, as it requires manually searching and creatively identifying improvements. Here, we introduce the engulfing candlestick pattern and show how it can be enhanced for more profitable trading applications.

Calculation of Integral Characteristics of Indicator Emissions
Indicator emissions are a little-studied area of market research. Primarily, this is due to the difficulty of analysis that is caused by the processing of very large arrays of time-varying data. Existing graphical analysis is too resource intensive and has therefore triggered the development of a parsimonious algorithm that uses time series of emissions. This article demonstrates how visual (intuitive image) analysis can be replaced with the study of integral characteristics of emissions. It can be of interest to both traders and developers of automated trading systems.

Running MetaTrader 4 Client Terminal on Linux-Desktop
Description of a step-by-step Linux-desktop setup using a non-emulator wine for running MetaTrader 4 Client Terminal on it.