Developing A Custom Account Performance Matrix Indicator

Introduction
Many traders may often struggle with overtrading, poor discipline, and emotional decision-making, especially when trading under strict prop-firm rules or managing their own capital. The temptation to chase losses, increase lot sizes after a losing streak, or ignore daily limits often leads to breaching drawdown rules and blowing accounts prematurely. Even skilled traders can fall into the trap of not respecting daily risk thresholds, which results in inconsistent performance and failure to achieve long-term profitability or pass funded trading challenges.
The account performance matrix indicator provides a practical solution by acting as a built-in risk manager and discipline coach. By allowing traders to set their own daily risk percentage always within the boundaries of maximum drawdown rules, it automatically tracks account equity, daily profit/loss, and drawdowns in real time. If the daily risk threshold is reached, the indicator closes all positions and locks trading until the next session begins, removing the possibility of revenge trading or emotional overtrading. This structure helps traders build consistency, protect their capital, and increase their chances of passing prop-firm challenges or steadily growing personal accounts.
Planning and Logic
1. Conservation setup:
- Account Balance = $10,000
- Max Overall Drawdown (6%) = $600
- Max Daily Drawdown (8%) = $800
- Daily Risk (1%) = $100
Trade can only lose $100 per day. This gives them 6 loosing days before they hit the max drawdown, well within prop-firm safety limits.
2. Moderate setup:
- Account Balance = $10,000
- Max Overall Drawdown (6%) = $600
- Max Dailydown (8%) = $800
- Daily Risk (2%) = $200
The trader risks $200 per day. They now have about 3 days before hit the max drawdown. This allows more aggression but less breathing room.
3. Aggressive setup (Not Recommended):
- Account Balance = $10,000
- Max Overall Drawdown (6%) = $600
- Max Dailydown (8%) = $800
- Daily Risk (5%) = $500
One bad day could wipe out $500, leaving very little room under the $600 max drawdown. This setup almost guarantees failure if risk is not controlled.
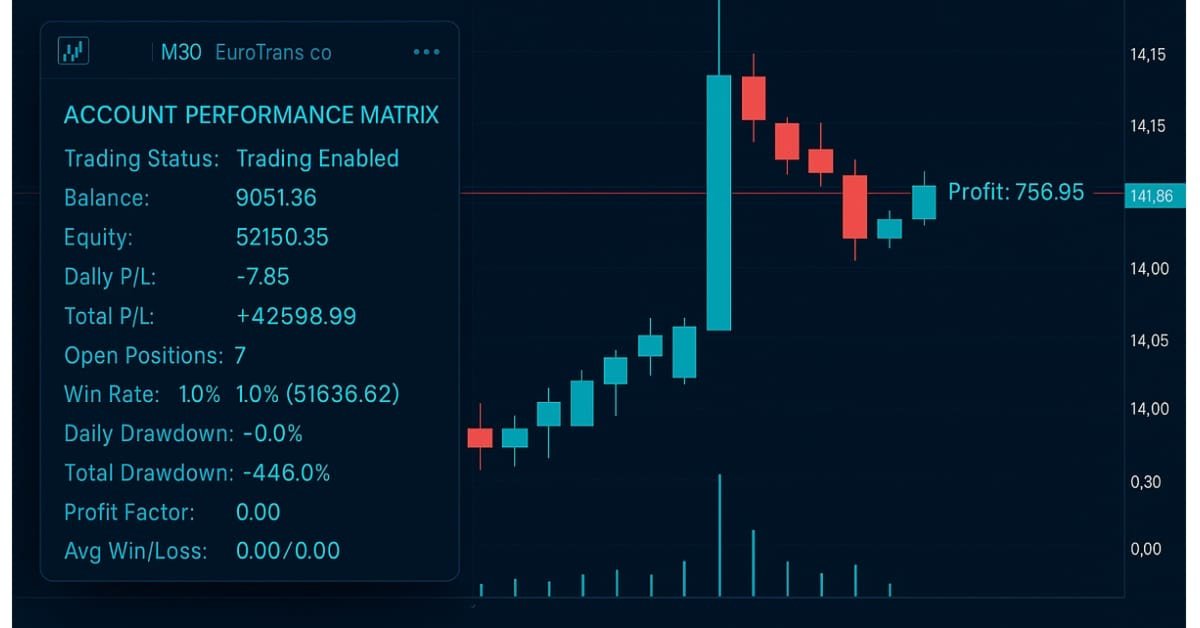
Indicator Features:
- The dashboard shows account performance metrics
- Visual risk status of trading
- Profit/Loss (P/L) displayed on the chart for opened positions
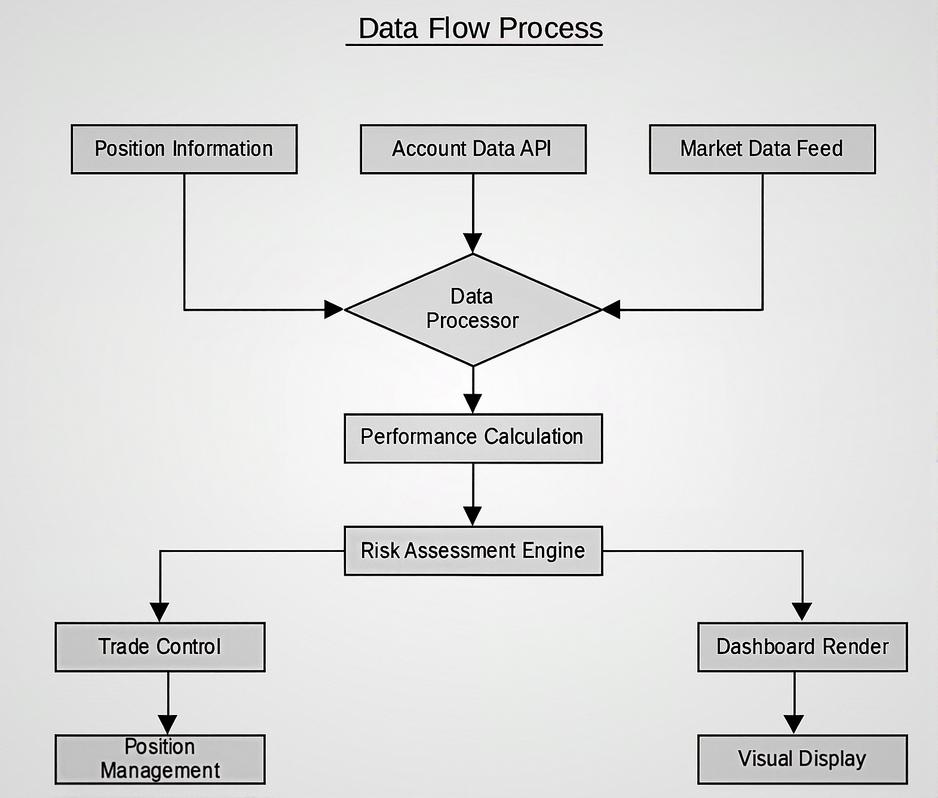
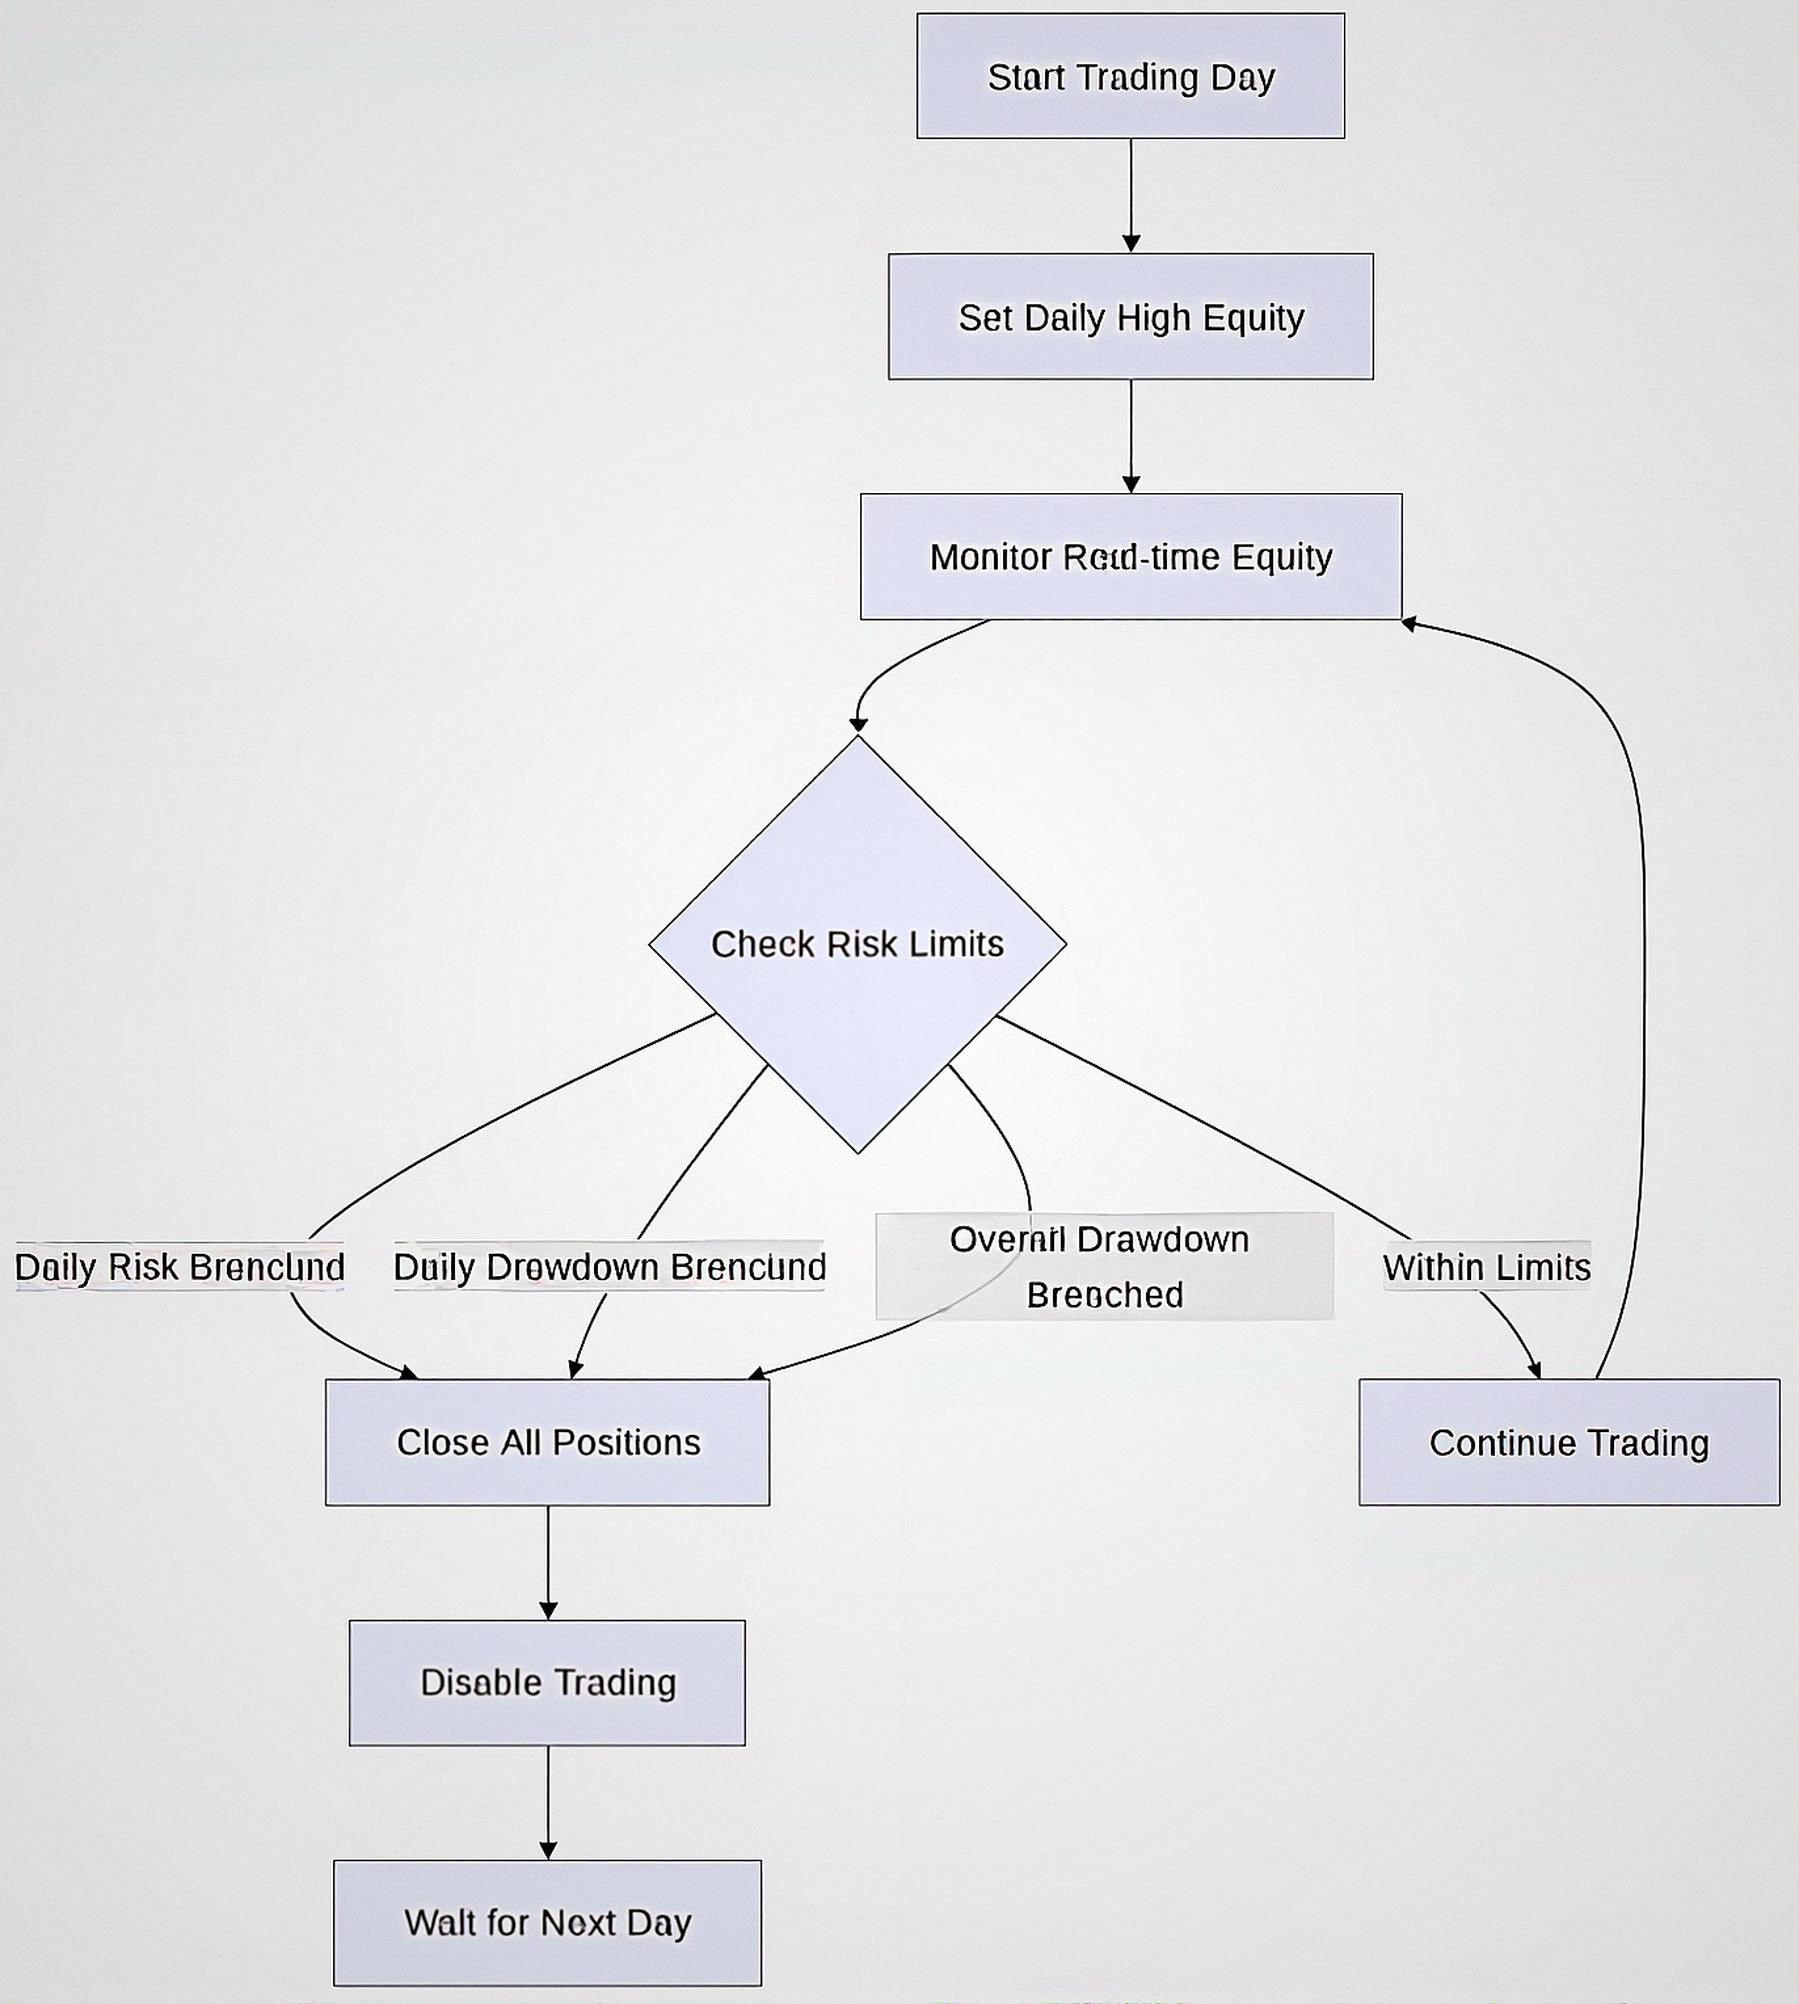
Risk Management Logic
Getting Started
//+------------------------------------------------------------------+
//|                                                   Acc_Matrix.mq5 |
//|                        GIT under Copyright 2025, MetaQuotes Ltd. |
//|                     https://www.mql5.com/en/users/johnhlomohang/ |
//+------------------------------------------------------------------+
#property copyright "GIT under Copyright 2025, MetaQuotes Ltd."
#property link      "https://www.mql5.com/en/users/johnhlomohang/"
#property version   "1.00"
#property indicator_chart_window
#property indicator_buffers 2
#property indicator_plots   2
#property indicator_type1   DRAW_LINE
#property indicator_color1  clrDodgerBlue
#property indicator_style1  STYLE_SOLID
#property indicator_width1  1
#property indicator_type2   DRAW_LINE
#property indicator_color2  clrCrimson
#property indicator_style2  STYLE_SOLID
#property indicator_width2  1
#include <Trade\Trade.mqh>

//+------------------------------------------------------------------+
//| Input variables                                                  |
//+------------------------------------------------------------------+
input bool     ShowDashboard = true;           // Show performance dashboard
input bool     ShowProfit_Loss = true;         // Show Profit and Loss on the chart
input color    DashboardBGColor = clrWhiteSmoke; // Dashboard background color
input color    TextColor = clrBlack;           // Text color
input int      DashboardX = 20;                // Dashboard X position
input int      DashboardY = 20;                // Dashboard Y position
input int      DashboardWidth = 280;           // Dashboard width
input int      FontSize = 10;                  // Font size

// Performance tracking mode
input bool     TrackFromIndicatorStart = true; // Track from indicator start (true) or overall (false)

// Risk management parameters
input double   DailyRiskPercent = 1.0;         // Daily risk percentage
input double   MaxDailyDrawdownPercent = 10.0; // Max daily drawdown percentage
input double   MaxOverallDrawdownPercent = 8.0; // Max overall drawdown percentage
input bool     EnableRiskManagement = true;    // Enable risk management
input ulong    MagicNumber = 123456;           // Magic number for position identification
We start of with the input variables section, which allows traders to customize how the indicator appears and behaves. They can toggle whether to display a dashboard panel, show profit or loss directly on the chart, and adjust visual properties like background color, text color, positioning, and font size. These options give traders flexibility to adapt the visual interface to their personal preferences while keeping essential account data visible in real time.
Most importantly, the risk management parameters make indicator more than just a visual tool. Traders can define their Daily Risk %, Maximum Daily Drawdown %, and Maximum Overall Drawdown %, ensuring that the system enforces discipline and prevents reckless trading. By enabling risk management, the indicator can monitor trades (via the magic number for identification) and send alerts once limits are breached. This feature helps traders maintain consistency, avoid overtrading, and align with prop-firm challenge rules or personal account growth strategies.
//+------------------------------------------------------------------+
//| Indicator buffers                                                |
//+------------------------------------------------------------------+
double         BidBuffer[];
double         AskBuffer[];

//+------------------------------------------------------------------+
//| Global variables                                                 |
//+------------------------------------------------------------------+
double         currentProfit;
double         balance;
double         equity;
double         margin;
double         freeMargin;
double         marginLevel;
int            totalOrders;
double         totalProfit;
double         dailyProfit;
datetime       lastTradeTime;
int            winCount;
int            lossCount;
double         maxDrawdown;
double         maxDrawdownPercent;

// Risk management variables
double         initialBalance;
double         dailyHighEquity;
double         dailyLowEquity;
double         dailyStartEquity;
bool           tradingEnabled = true;
string         riskStatus = "Trading Enabled";
color          riskStatusColor = clrGreen;

// Performance tracking variables
int            totalClosedTrades;
int            closedWinCount;
int            closedLossCount;
double         totalGains;
double         totalLosses;
double         largestWin;
double         largestLoss;
double         averageWin;
double         averageLoss;
double         profitFactor;

// Track the last time history was updated
datetime       lastHistoryUpdate;
bool           firstUpdate = true;
This section of the code defines the global variables that the indicator uses to track performance, risk management, and trading history across sessions. The first group of variables deals with account performance metrics such as current profit, balance, equity, margin, free margin, and margin level. It also keeps track of the number of open orders, total profit, daily profit, last trade time, and the count of winning and losing trades. Additionally, it monitors the maximum drawdown in both absolute value and percentage, which is critical for evaluating risk exposure.
The second group of variables is dedicated to risk management. Here, the code stores the initial balance when tracking begins, as well as the daily high, low, and start equity levels. These values help measure daily performance swings and enforce discipline by detecting breaches in daily or overall limits. The tradingEnabled flag acts as a master switch if risk thresholds are exceeded, it sends alerts. A visual element is included through the riskStatus string and riskStatusColor, which give clear on-chart feedback to the trader, such as showing “Trading Enabled” in green or warning in red.
The final group contains performance tracking variables for analyzing closed trades. This includes the total number of closed trades, how many were wins or losses, cumulative gains and losses, as well as the largest win and largest loss recorded. It also calculates averages for wins and losses, and the profit factor, which is a key performance metric comparing gains versus losses. To ensure accurate updates, the system tracks when the history was last updated and whether it is the first update since initialization. Altogether, these variables give traders a comprehensive view of their trading performance to improve consistency.
//+------------------------------------------------------------------+
//| Custom indicator initialization function                         |
//+------------------------------------------------------------------+
int OnInit()
{

   IndicatorSetString(INDICATOR_SHORTNAME, "ACCOUNT PERFORMANCE MATRIX");
   IndicatorSetInteger(INDICATOR_DIGITS, _Digits);

   // Initialize variables
   currentProfit = 0.0;
   balance = AccountInfoDouble(ACCOUNT_BALANCE);
   equity = AccountInfoDouble(ACCOUNT_EQUITY);

   // Set initial balance based on tracking mode
   if(TrackFromIndicatorStart)
   {
      initialBalance = balance;
   }
   else
   {
      // For overall tracking, use the actual account balance
      initialBalance = AccountInfoDouble(ACCOUNT_BALANCE);
   }

   dailyStartEquity = equity;
   dailyHighEquity = equity;
   dailyLowEquity = equity;
   lastHistoryUpdate = TimeCurrent();

   // Load historical trade data based on tracking mode
   LoadHistory();

   // Create dashboard objects if enabled
   if(ShowDashboard)
   {
      CreateDashboard();
   }

   // Set timer to update every second
   EventSetTimer(1);

   return(INIT_SUCCEEDED);
}
The OnInit() function initializes the custom indicator by setting its display name, precision, and preparing all performance-tracking variables for use. It resets current profit, retrieves the account balance and equity, and determines the initial balance depending on whether the user wants to track performance from the moment the indicator is attached or across the entire account history. It also sets the starting equity for the day while recording the high and low equity values to measure intraday performance. Historical trade data is loaded through the LoadHistory() function to provide context for calculations, and if the dashboard option is enabled, the visual performance panel is created with CreateDashboard(). Finally, the function activates a timer event with one-second updates to ensure all account metrics and dashboard visuals remain in sync with real-time trading activity.
//+------------------------------------------------------------------+
//| Custom indicator deinitialization function                       |
//+------------------------------------------------------------------+
void OnDeinit(const int reason)
{
   // Delete all objects created by the indicator
   ObjectsDeleteAll(0, 0, -1);
   EventKillTimer();
}

//+------------------------------------------------------------------+
//| Timer function                                                   |
//+------------------------------------------------------------------+
void OnTimer()
{
   // Update account information
   UpdateAccountInfo();

   // Update historical data periodically to capture new closed trades
   if(TimeCurrent() - lastHistoryUpdate >= 5 || firstUpdate) // Update every 5 seconds or on first run
   {
      LoadHistory();
      lastHistoryUpdate = TimeCurrent();
      firstUpdate = false;
   }

   // Update dashboard if enabled
   if(ShowDashboard)
   {
      UpdateDashboard();
   }

   // Check risk management rules
   if(EnableRiskManagement)
   {
      CheckRiskManagement();
   }
}

//+------------------------------------------------------------------+
//| Custom indicator iteration function                              |
//+------------------------------------------------------------------+
int OnCalculate(const int rates_total,
                const int prev_calculated,
                const datetime &time[],
                const double &open[],
                const double &high[],
                const double &low[],
                const double &close[],
                const long &tick_volume[],
                const long &volume[],
                const int &spread[])
{
   // Update bid and ask buffers
   if(ShowProfit_Loss)
   {
      UpdatePriceBuffers(rates_total, BidBuffer, AskBuffer, time);
   }

   return(rates_total);
}

//+------------------------------------------------------------------+
//| Update account information function                              |
//+------------------------------------------------------------------+
void UpdateAccountInfo()
{
   balance = AccountInfoDouble(ACCOUNT_BALANCE);
   equity = AccountInfoDouble(ACCOUNT_EQUITY);
   margin = AccountInfoDouble(ACCOUNT_MARGIN);
   freeMargin = AccountInfoDouble(ACCOUNT_MARGIN_FREE);
   marginLevel = AccountInfoDouble(ACCOUNT_MARGIN_LEVEL);

   // Update daily high/low equity
   if(equity > dailyHighEquity) dailyHighEquity = equity;
   if(equity < dailyLowEquity) dailyLowEquity = equity;

   CalculateProfitMetrics();
   CalculateTradeMetrics();
}
The OnDeinit() function ensures a clean shutdown of the indicator by deleting all chart objects it created and killing the timer event to stop background updates. This prevents clutter on the chart after the indicator is removed and ensures no unnecessary processes remain active. The OnTimer() function, which runs every second, is central to the indicator’s functionality: it continuously updates account information, refreshes historical trade data every five seconds (or on the first run), and manages the performance dashboard if enabled. It also checks and enforces risk management rules, ensuring that once risk thresholds are reached, the trader gets alerts in real time.
Meanwhile, the OnCalculate() function integrates the indicator with chart updates, ensuring that if profit/loss display is enabled, the Bid and Ask lines are updated through price buffers. The UpdateAccountInfo() function retrieves live account details such as balance, equity, margin, and free margin, while also recording daily high and low equity for accurate performance tracking. It then calls supporting functions like CalculateProfitMetrics() and CalculateTradeMetrics() to analyze performance further. Together, these functions create a self-updating, risk-aware dashboard that gives traders full visibility of their account status while actively enforcing discipline.
//+------------------------------------------------------------------+
//| Update account information function                              |
//+------------------------------------------------------------------+
void UpdateAccountInfo()
{
   balance = AccountInfoDouble(ACCOUNT_BALANCE);
   equity = AccountInfoDouble(ACCOUNT_EQUITY);
   margin = AccountInfoDouble(ACCOUNT_MARGIN);
   freeMargin = AccountInfoDouble(ACCOUNT_MARGIN_FREE);
   marginLevel = AccountInfoDouble(ACCOUNT_MARGIN_LEVEL);

   // Update daily high/low equity
   if(equity > dailyHighEquity) dailyHighEquity = equity;
   if(equity < dailyLowEquity) dailyLowEquity = equity;

   CalculateProfitMetrics();
   CalculateTradeMetrics();
}

//+------------------------------------------------------------------+
//| Update price buffers with Bid and Ask values                     |
//+------------------------------------------------------------------+
void UpdatePriceBuffers(int rates_total, double &bidBuffer[], double &askBuffer[], const datetime &time[])
{
   double bid = SymbolInfoDouble(_Symbol, SYMBOL_BID);
   double ask = SymbolInfoDouble(_Symbol, SYMBOL_ASK);

   // Calculate current profit for open positions
   currentProfit = 0.0;
   for(int i = PositionsTotal() - 1; i >= 0; i--)
   {
      if(PositionGetSymbol(i) == _Symbol)
      {
         currentProfit += PositionGetDouble(POSITION_PROFIT);
      }
   }

   // Fill buffers with current bid and ask values
   if(ShowProfit_Loss && rates_total > 0)
   {
      for(int i = 0; i < rates_total; i++)
      {
         bidBuffer[i] = bid;
         askBuffer[i] = ask;
      }

      // Calculate position for labels (2 bars to the right of current candle)
      int currentBar = rates_total - 1;
      datetime labelTime = (currentBar + 2 < rates_total) ? time[currentBar + 2] : time[currentBar] + PeriodSeconds() * 2;

      // Add profit/loss label with color coding
      string plLabelText;
      color plColor;
      if(currentProfit >= 0)
      {
         plLabelText = "Profit: " + DoubleToString(currentProfit, 2);
         plColor = clrBlue;
      }
      else
      {
         plLabelText = "Loss: " + DoubleToString(currentProfit, 2);
         plColor = clrRed;
      }

      CreateOrUpdateLabel("PLLabel", plLabelText, labelTime, (bid + ask) / 2, plColor, ANCHOR_RIGHT);
   }
}
The UpdateAccountInfo() function is responsible for retrieving live account data and keeping track of critical performance metrics. It pulls the current balance, equity, margin, free margin, and margin level from the trading account. Additionally, it monitors intraday equity fluctuations by updating the daily high and daily low equity values whenever a new extreme is reached. Once the raw account data is refreshed, the function calls CalculateProfitMetrics() and CalculateTradeMetrics(), which handle deeper analysis like profit calculations, trade win/loss tracking, and performance evaluation. This ensures the dashboard always reflects the most up-to-date account conditions.
The UpdatePriceBuffers() function focuses on price and profit/loss visualization. It first retrieves the current Bid and Ask prices, then iterates through open positions to calculate the current profit for the active symbol. If profit/loss visualization is enabled, it fills the indicator’s buffers with the latest Bid and Ask values across the chart and creates a label positioned slightly to the right of the current bar. This label displays either a profit (blue) or a loss (red), depending on the current trade outcome. By combining account performance tracking with real-time price and profit visualization, the function gives traders both numerical and graphical feedback that enhances situational awareness and decision-making.
//+------------------------------------------------------------------+
//| Create or update text label                                      |
//+------------------------------------------------------------------+
void CreateOrUpdateLabel(string name, string text, datetime time, double price, color clr, ENUM_ANCHOR_POINT anchor)
{
   if(ObjectFind(0, name) < 0)
   {
      ObjectCreate(0, name, OBJ_TEXT, 0, time, price);
      ObjectSetString(0, name, OBJPROP_TEXT, text);
      ObjectSetInteger(0, name, OBJPROP_COLOR, clr);
      ObjectSetInteger(0, name, OBJPROP_ANCHOR, anchor);
      ObjectSetInteger(0, name, OBJPROP_FONTSIZE, FontSize);
   }
   else
   {
      ObjectMove(0, name, 0, time, price);
      ObjectSetString(0, name, OBJPROP_TEXT, text);
      ObjectSetInteger(0, name, OBJPROP_COLOR, clr);
   }
}

//+------------------------------------------------------------------+
//| Calculate profit metrics                                         |
//+------------------------------------------------------------------+
void CalculateProfitMetrics()
{
   totalProfit = equity - initialBalance;

   // Calculate max drawdown - FIXED: Prevent division by zero
   double drawdown = dailyHighEquity - equity;
   if(drawdown > maxDrawdown)
   {
      maxDrawdown = drawdown;
      // Avoid division by zero - use a small epsilon if dailyHighEquity is zero
      double denominator = (dailyHighEquity == 0) ? 0.000001 : dailyHighEquity;
      maxDrawdownPercent = (drawdown / denominator) * 100;
   }
}
The UpdateAccountInfo() function is responsible for retrieving live account data and keeping track of critical performance metrics. It pulls the current balance, equity, margin, free margin, and margin level from the trading account. Additionally, it monitors intraday equity fluctuations by updating the daily high and daily low equity values whenever a new extreme is reached. Once the raw account data is refreshed, the function calls CalculateProfitMetrics() and CalculateTradeMetrics(), which handle more in-depth analysis like profit calculations, trade win/loss tracking, and performance evaluation. This ensures the dashboard always reflects the most up-to-date account conditions.
The UpdatePriceBuffers() function focuses on price and profit/loss visualization. It first retrieves the current Bid and Ask prices, then iterates through open positions to calculate the current profit for the active symbol. If profit/loss visualization is enabled, it fills the indicator’s buffers with the latest Bid and Ask values across the chart and creates a label positioned slightly to the right of the current bar. This label displays either a profit (blue) or a loss (red), depending on the current trade outcome. By combining account performance tracking with real-time price and profit visualization, the function gives traders both numerical and graphical feedback that enhances situational awareness and decision-making.
//+------------------------------------------------------------------+
//| Calculate trade metrics                                          |
//+------------------------------------------------------------------+
void CalculateTradeMetrics()
{
   totalOrders = PositionsTotal();
   winCount = 0;
   lossCount = 0;

   // Count winning and losing positions
   for(int i = PositionsTotal() - 1; i >= 0; i--)
   {
      ulong ticket = PositionGetTicket(i);
      if(PositionSelectByTicket(ticket))
      {
         double profit = PositionGetDouble(POSITION_PROFIT);
         if(profit > 0) winCount++;
         else if(profit < 0) lossCount++;
      }
   }
}

//+------------------------------------------------------------------+
//| Load historical trade data                                       |
//+------------------------------------------------------------------+
void LoadHistory()
{
   datetime startDate = 0;
   if(TrackFromIndicatorStart)
   {
      // Only load history from when the indicator was started
      startDate = TimeCurrent() - 86400; // Load from 24 hours ago to ensure we capture all recent trades
   }

   HistorySelect(startDate, TimeCurrent());
   int totalHistory = HistoryDealsTotal();

   // Reset counters
   int newClosedTrades = 0;
   int newClosedWinCount = 0;
   int newClosedLossCount = 0;
   double newTotalGains = 0;
   double newTotalLosses = 0;
   double newLargestWin = 0;
   double newLargestLoss = 0;

   for(int i = 0; i < totalHistory; i++)
   {
      ulong ticket = HistoryDealGetTicket(i);
      if(ticket > 0)
      {
         // Check if this is a closing deal (not a deposit/withdrawal or opening trade)
         long dealType = HistoryDealGetInteger(ticket, DEAL_TYPE);
         if(dealType == DEAL_TYPE_BUY || dealType == DEAL_TYPE_SELL)
         {
            double profit = HistoryDealGetDouble(ticket, DEAL_PROFIT);
            if(profit != 0)
            {
               newClosedTrades++;
               if(profit > 0)
               {
                  newClosedWinCount++;
                  newTotalGains += profit;
                  if(profit > newLargestWin) newLargestWin = profit;
               }
               else
               {
                  newClosedLossCount++;
                  newTotalLosses += MathAbs(profit);
                  if(profit < newLargestLoss) newLargestLoss = profit;
               }
            }
         }
      }
   }

   // Update the global variables
   totalClosedTrades = newClosedTrades;
   closedWinCount = newClosedWinCount;
   closedLossCount = newClosedLossCount;
   totalGains = newTotalGains;
   totalLosses = newTotalLosses;
   largestWin = newLargestWin;
   largestLoss = newLargestLoss;

   // Calculate averages and profit factor
   averageWin = (closedWinCount > 0) ? totalGains / closedWinCount : 0;
   averageLoss = (closedLossCount > 0) ? totalLosses / closedLossCount : 0;
   profitFactor = (totalLosses > 0) ? totalGains / totalLosses : (totalGains > 0) ? 1000 : 0;
}
The CalcculateTradeMetrics() function provides a live snapshot of open trading positions by counting how many are currently in profit versus how many are at a loss. It begins by retrieving the total number of open positions, then loops through each one, checking its profit or loss value. If the position is profitable, it increments the win counter, and if it is losing, it increments the loss counter. This function gives traders instant feedback on the quality of their open trades, helping them gauge whether their positions are aligned with their trading plan in real time.
The LoadHistory() function dives deeper into historical performance by analyzing closed trades within a specified timeframe. If tracking is set from the indicator’s start, it loads history from the last 24 hours to ensure recent trades are included. It then scans through all historical deals, filtering only buy or sell closing trades while ignoring deposits, withdrawals, or entries. For each closed trade, it records the profit or loss, updates counts for wins and losses, sums total gains and losses, and tracks the largest single win or loss. Finally, it calculates averages and the profit factor, a key metric comparing gains to losses. This comprehensive performance breakdown allows traders to identify patterns in their trading behavior, evaluate profitability, and maintain disciplined risk management over time.
//+------------------------------------------------------------------+
//| Check risk management rules                                      |
//+------------------------------------------------------------------+
void CheckRiskManagement()
{
   // Check if it's a new day (reset daily equity)
   MqlDateTime today, lastCheck;
   TimeToStruct(TimeCurrent(), today);
   TimeToStruct(TimeCurrent(), lastCheck);

   static int lastDay = -1;
   if(today.day != lastDay)
   {
      dailyStartEquity = equity;
      dailyHighEquity = equity;
      dailyLowEquity = equity;
      lastDay = today.day;

      // Re-enable trading at the start of a new day
      if(!tradingEnabled)
      {
         tradingEnabled = true;
         riskStatus = "Trading Enabled";
         riskStatusColor = clrGreen;
      }
   }

   // Calculate daily drawdown percentage - FIXED: Prevent division by zero
   double dailyDrawdownPercent = 0;
   if(dailyHighEquity > 0)
   {
      dailyDrawdownPercent = (dailyHighEquity - equity) / dailyHighEquity * 100;
   }

   // Calculate overall drawdown percentage - FIXED: Prevent division by zero
   double overallDrawdownPercent = 0;
   if(initialBalance > 0)
   {
      overallDrawdownPercent = (initialBalance - equity) / initialBalance * 100;
   }

   double dailyRiskEquity = dailyStartEquity * (1 - DailyRiskPercent / 100);

   // Check if we've hit risk limits
   if(tradingEnabled)
   {
      if(equity <= dailyRiskEquity)
      {
         riskStatus = "Daily Risk Limit Reached";
         riskStatusColor = clrRed;
         tradingEnabled = false;
         Alert("Daily Risk Limit Reached, Consider Closing Open Positions!!!");

      }
      else if(dailyDrawdownPercent >= MaxDailyDrawdownPercent)
      {
         riskStatus = "Max Daily Drawdown Reached";
         riskStatusColor = clrRed;
         tradingEnabled = false;
         Alert("Max Daily Drawdown Reached!!!");

      }
      else if(overallDrawdownPercent >= MaxOverallDrawdownPercent)
      {
         riskStatus = "Max Overall Drawdown Reached";
         riskStatusColor = clrRed;
         tradingEnabled = false;
         Alert("Max Overall Drawdown Reached!!!");

      }
   }
}

//+------------------------------------------------------------------+
//| Create dashboard function                                        |
//+------------------------------------------------------------------+
void CreateDashboard()
{
   // Create background rectangle
   ObjectCreate(0, "DashboardBG", OBJ_RECTANGLE_LABEL, 0, 0, 0);
   ObjectSetInteger(0, "DashboardBG", OBJPROP_XDISTANCE, DashboardX);
   ObjectSetInteger(0, "DashboardBG", OBJPROP_YDISTANCE, DashboardY);
   ObjectSetInteger(0, "DashboardBG", OBJPROP_XSIZE, DashboardWidth);
   ObjectSetInteger(0, "DashboardBG", OBJPROP_YSIZE, 320);
   ObjectSetInteger(0, "DashboardBG", OBJPROP_BGCOLOR, DashboardBGColor);
   ObjectSetInteger(0, "DashboardBG", OBJPROP_BORDER_TYPE, BORDER_FLAT);
   ObjectSetInteger(0, "DashboardBG", OBJPROP_BORDER_COLOR, clrGray);
   ObjectSetInteger(0, "DashboardBG", OBJPROP_BACK, true);
   ObjectSetInteger(0, "DashboardBG", OBJPROP_SELECTABLE, false);
   ObjectSetInteger(0, "DashboardBG", OBJPROP_SELECTED, false);
   ObjectSetInteger(0, "DashboardBG", OBJPROP_HIDDEN, true);
   ObjectSetInteger(0, "DashboardBG", OBJPROP_ZORDER, 0);

   // Create title
   ObjectCreate(0, "DashboardTitle", OBJ_LABEL, 0, 0, 0);
   ObjectSetInteger(0, "DashboardTitle", OBJPROP_XDISTANCE, DashboardX + 10);
   ObjectSetInteger(0, "DashboardTitle", OBJPROP_YDISTANCE, DashboardY + 10);
   ObjectSetString(0, "DashboardTitle", OBJPROP_TEXT, "ACCOUNT PERFORMANCE MATRIX");
   ObjectSetInteger(0, "DashboardTitle", OBJPROP_COLOR, TextColor);
   ObjectSetInteger(0, "DashboardTitle", OBJPROP_FONTSIZE, FontSize + 2);

   // Create tracking mode indicator
   string trackingMode = TrackFromIndicatorStart ? "From Indicator Start" : "Overall Account";
   ObjectCreate(0, "TrackingModeLabel", OBJ_LABEL, 0, 0, 0);
   ObjectSetInteger(0, "TrackingModeLabel", OBJPROP_XDISTANCE, DashboardX + 10);
   ObjectSetInteger(0, "TrackingModeLabel", OBJPROP_YDISTANCE, DashboardY + 30);
   ObjectSetString(0, "TrackingModeLabel", OBJPROP_TEXT, "Tracking: " + trackingMode);
   ObjectSetInteger(0, "TrackingModeLabel", OBJPROP_COLOR, clrDarkBlue);
   ObjectSetInteger(0, "TrackingModeLabel", OBJPROP_FONTSIZE, FontSize);

   // Create information labels
   CreateDashboardLabel("RiskStatusLabel", "Trading Status: ", 50, DashboardX, DashboardY);
   CreateDashboardLabel("BalanceLabel", "Balance: ", 70, DashboardX, DashboardY);
   CreateDashboardLabel("EquityLabel", "Equity: ", 90, DashboardX, DashboardY);
   CreateDashboardLabel("DailyProfitLabel", "Daily P/L: ", 110, DashboardX, DashboardY);
   CreateDashboardLabel("TotalProfitLabel", "Total P/L: ", 130, DashboardX, DashboardY);
   CreateDashboardLabel("PositionsLabel", "Open Positions: ", 150, DashboardX, DashboardY);
   CreateDashboardLabel("WinRateLabel", "Win Rate: ", 170, DashboardX, DashboardY);
   CreateDashboardLabel("DailyRiskLabel", "Daily Risk: ", 190, DashboardX, DashboardY);
   CreateDashboardLabel("DailyDrawdownLabel", "Daily Drawdown: ", 210, DashboardX, DashboardY);
   CreateDashboardLabel("TotalDrawdownLabel", "Total Drawdown: ", 230, DashboardX, DashboardY);
   CreateDashboardLabel("ProfitFactorLabel", "Profit Factor: ", 250, DashboardX, DashboardY);
   CreateDashboardLabel("TradesLabel", "Total Trades: ", 270, DashboardX, DashboardY);
   CreateDashboardLabel("AvgWinLossLabel", "Avg Win/Loss: ", 290, DashboardX, DashboardY);
}
The CheckRiskManagement() function is the enforcement mechanism that ensures traders stick to their risk plan and avoid breaching account limits. It then calculates the daily and overall drawdown percentages, carefully handling division by zero to avoid errors. The function compares equity against the trader’s predefined daily risk limit, maximum daily drawdown, and maximum overall drawdown. If any of these thresholds are breached, the status message turns red, and alerts are triggered to warn the trader. This approach not only helps prevent catastrophic losses and instills discipline by removing the temptation to continue trading after limits are hit.
The CreateDashboard() function builds the on-screen interface that displays all the tracked metrics in an organized and visually clear panel. It starts by creating a background rectangle, styled with user-defined colors, sizes, and borders to act as a container for all performance data. A title and tracking mode label are then added to indicate whether the dashboard is monitoring results from the indicator’s start or the entire account history. Below this, a series of labeled fields such as balance, equity, daily and total profit/loss, win rate, drawdowns, profit factor, and average win/loss are placed in structured rows. This visual dashboard allows traders to instantly assess both their account health and risk status without digging into multiple reports, making it a powerful tool for maintaining clarity and discipline in trading.
//+------------------------------------------------------------------+
//| Create dashboard label helper function                           |
//+------------------------------------------------------------------+
void CreateDashboardLabel(string name, string text, int yOffset, int x, int y)
{
   ObjectCreate(0, name, OBJ_LABEL, 0, 0, 0);
   ObjectSetInteger(0, name, OBJPROP_XDISTANCE, x + 10);
   ObjectSetInteger(0, name, OBJPROP_YDISTANCE, y + yOffset);
   ObjectSetString(0, name, OBJPROP_TEXT, text);
   ObjectSetInteger(0, name, OBJPROP_COLOR, TextColor);
   ObjectSetInteger(0, name, OBJPROP_FONTSIZE, FontSize);
}

//+------------------------------------------------------------------+
//| Update dashboard function                                        |
//+------------------------------------------------------------------+
void UpdateDashboard()
{
   // Update risk status with color coding
   ObjectSetString(0, "RiskStatusLabel", OBJPROP_TEXT, "Trading Status: " + riskStatus);
   ObjectSetInteger(0, "RiskStatusLabel", OBJPROP_COLOR, riskStatusColor);

   // Update values for all dashboard labels
   UpdateDashboardLabel("BalanceLabel", "Balance: " + DoubleToString(balance, 2));
   UpdateDashboardLabel("EquityLabel", "Equity: " + DoubleToString(equity, 2));

   // Color code profit values
   double dailyPL = equity - dailyStartEquity;
   string dailyPLText = "Daily P/L: ";
   if(dailyPL >= 0) dailyPLText += "+" + DoubleToString(dailyPL, 2);
   else dailyPLText += DoubleToString(dailyPL, 2);
   UpdateDashboardLabel("DailyProfitLabel", dailyPLText);

   string totalPLText = "Total P/L: ";
   if(totalProfit >= 0) totalPLText += "+" + DoubleToString(totalProfit, 2);
   else totalPLText += DoubleToString(totalProfit, 2);
   UpdateDashboardLabel("TotalProfitLabel", totalPLText);

   UpdateDashboardLabel("PositionsLabel", "Open Positions: " + IntegerToString(totalOrders));

   // Calculate and display win rate from closed trades
   int totalTrades = closedWinCount + closedLossCount;
   string winRateText = "Win Rate: ";
   if(totalTrades > 0)
   {
      double winRate = (double)closedWinCount / totalTrades * 100;
      winRateText += DoubleToString(winRate, 1) + "% (" + IntegerToString(closedWinCount) +
                    "/" + IntegerToString(totalTrades) + ")";
   }
   else winRateText += "N/A";
   UpdateDashboardLabel("WinRateLabel", winRateText);

   // Risk metrics
   double dailyRiskEquity = dailyStartEquity * (1 - DailyRiskPercent / 100);

   // Calculate drawdown percentages with zero division protection
   double dailyDrawdownPercent = 0;
   if(dailyHighEquity > 0)
   {
      dailyDrawdownPercent = (dailyHighEquity - equity) / dailyHighEquity * 100;
   }

   double overallDrawdownPercent = 0;
   if(initialBalance > 0)
   {
      overallDrawdownPercent = (initialBalance - equity) / initialBalance * 100;
   }

   UpdateDashboardLabel("DailyRiskLabel", "Daily Risk: " + DoubleToString(DailyRiskPercent, 1) +
                       "% (" + DoubleToString(dailyRiskEquity, 2) + ")");

   string dailyDrawdownText = "Daily Drawdown: " + DoubleToString(dailyDrawdownPercent, 1) + "%";
   UpdateDashboardLabel("DailyDrawdownLabel", dailyDrawdownText);

   string totalDrawdownText = "Total Drawdown: " + DoubleToString(overallDrawdownPercent, 1) + "%";
   UpdateDashboardLabel("TotalDrawdownLabel", totalDrawdownText);

   // Performance metrics
   UpdateDashboardLabel("ProfitFactorLabel", "Profit Factor: " + DoubleToString(profitFactor, 2));
   UpdateDashboardLabel("TradesLabel", "Total Trades: " + IntegerToString(totalClosedTrades));
   UpdateDashboardLabel("AvgWinLossLabel", "Avg Win/Loss: " + DoubleToString(averageWin, 2) +
                       "/" + DoubleToString(MathAbs(averageLoss), 2));
}

//+------------------------------------------------------------------+
//| Update dashboard label helper function                           |
//+------------------------------------------------------------------+
void UpdateDashboardLabel(string name, string text)
{
   ObjectSetString(0, name, OBJPROP_TEXT, text);
}
The CreateDashboardLabel() function serves as a helper to quickly generate labeled fields on the dashboard. Each label is created with a specified name, text, and position offsets, and it applies consistent styling such as font size and color. This ensures all metrics on the dashboard are clearly visible and uniformly formatted, providing traders with an organized overview of account performance and risk status.
The UpdateDashboard() function continuously refreshes the dashboard with live account and performance data. It updates all key metrics including balance, equity, daily and total profit/loss, open positions, win rate, drawdowns, daily risk, profit factor, total trades, and average win/loss. The function also color-codes critical information, such as profit/loss and trading status, to provide instant visual feedback. By constantly reflecting real-time account conditions, it helps traders make informed decisions, reinforces discipline, and prevents overtrading by clearly displaying when risk limits are reached.
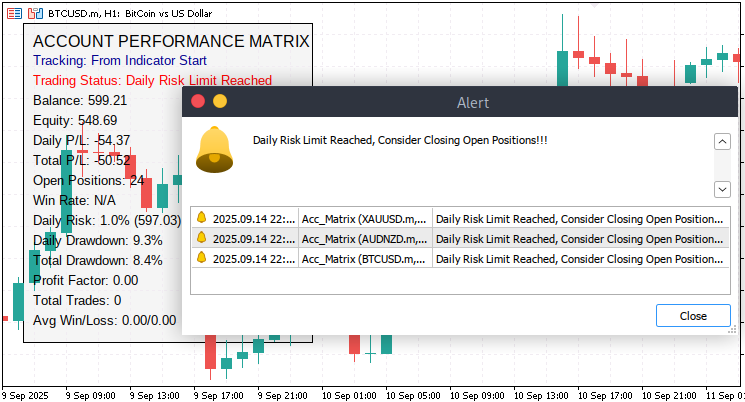
Indicator demo:
Conclusion
In summary, we developed a custom Account Performance Matrix indicator that tracks both real-time and historical trading performance. The indicator monitors key account metrics such as balance, equity, margin, open positions, daily and total profit/loss, win rate, drawdowns, profit factor, and average win/loss. It incorporates a dynamic dashboard with visual labels and color-coded alerts to provide traders with a clear and organized view of their account performance. Risk management rules are integrated to enforce daily risk limits and maximum drawdowns, when limits are reached and it alerts a trader about the current account performance.
In conclusion, this indicator helps traders maintain discipline, avoid overtrading, and make more informed decisions by providing a transparent overview of account health and risk exposure. By clearly showing when risk thresholds are approached or breached, it encourages consistent trading behavior and supports sustainable growth. Whether a trader is working to pass a prop-firm challenge or managing a personal trading account, this tool provides structured guidance to manage risk, optimize trading decisions, and ultimately enhance long-term profitability.
Warning: All rights to these materials are reserved by MetaQuotes Ltd. Copying or reprinting of these materials in whole or in part is prohibited.
This article was written by a user of the site and reflects their personal views. MetaQuotes Ltd is not responsible for the accuracy of the information presented, nor for any consequences resulting from the use of the solutions, strategies or recommendations described.

- Free trading apps
- Over 8,000 signals for copying
- Economic news for exploring financial markets
You agree to website policy and terms of use