Trading box Dashboard
- Utilitys
- Igor Zizek
- Version: 3.3
- Aktualisiert: 30 September 2024
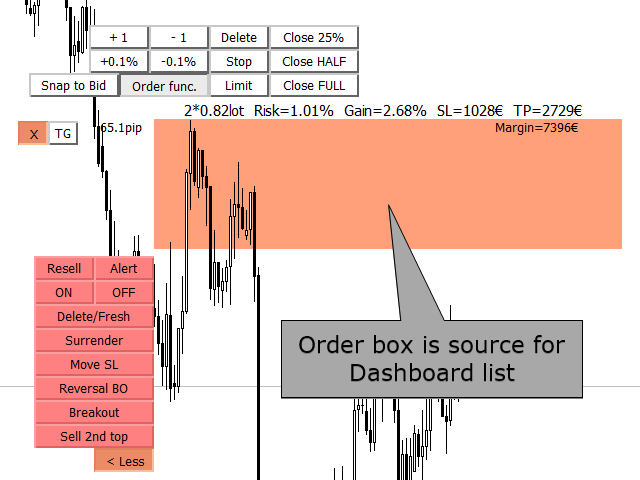
Anzeige der Orderbox-Liste aus dem Trading Box Order Management Tool.
Kontakte und manuelle Links finden Sie in meinemProfil.
Dieses Dashboard verschafft Ihnen einen Vorteil beim Devisenhandel, denn Sie können in wenigen Sekunden entscheiden, welches Paar und welcher Zeitrahmen es wert ist, genauer beobachtet zu werden. Auf diese Weise werden Sie nicht von den anderen Devisenpaaren, die Sie handeln, abgelenkt und verpassen keine großartigen Gelegenheiten, den besten Preis zu handeln.
Trading Dashboard (Orderbox-Übersichtspanel und Trading Box Order Management Extension) Trade Dashboard
Trading box Order Dashboard EA fasst alle Orderboxen der Trading box Order Management in einer Ansicht zusammen. Meistens sehen Trader nur dieses Dashboard und entscheiden, welches Devisenpaar sie genauer beobachten müssen, um neue Trades zu eröffnen.
Sortierte Orders nach Pips oder nach Symbolname - Dashboard bietet Ihnen die Möglichkeit, SELL- oder BUY-Orderboxen nach Pip-Abstand zu sortieren. Wenn Sie mit mehreren Charts handeln, wird diese Funktion Ihre Zeit sparen und Sie müssen nicht mehr ständig zwischen den Charts wechseln.
Achten Sie auf die nächstliegende Order - Widmen Sie Ihre Zeit nur der Orderbox mit dem nächstliegenden Preis. So haben Sie einen guten Überblick über alle Ihre Charts an einem Ort.
Aufgaben und Aktionen für Orderboxen - Trader können Aufgaben und Aktionen im Chart mit Ordermanagement definieren. Diese Daten werden dann an das Dashboard übertragen, wo Sie einen guten Überblick über alle Ihre Notizen für einen bestimmten Chart haben.
Schaltfläche "Anzeigen" - öffnet den Symbolchart, in dem die Orderbox platziert ist.
Wie man Dashboard-Daten liest
Schaltfläche "Anzeigen" = öffnet das Symboldiagramm
TF = Zeitrahmen
Symbol = Diagrammsymbol
sellbox / buybox = grüne Farbe bedeutet, dass die Orderbox aktiviert ist, rote Farbe bedeutet, dass die Orderbox deaktiviert ist
Pips = Pip-Abstand vom aktuellen Kurs zur Orderbox
Gewinn in Depotwährung
BE - (Stoploss to breakeven) mit Eingabevariable "Stoploss to breakeven pip - BE button"
Aufgaben = Text wird aus dem Etikett "Aufgaben" übernommen
Aktionen/Signale = Text wird aus den gestrichelten Alarmlinien Above und Below übernommen
BUTTON: Schaltfläche "Alle offenen Aufträge schließen", mit der alle geöffneten Aufträge geschlossen werden können (Auftrag mit einem Klick schließen)
BUTTON: Schaltfläche "Alle offenen Aufträge löschen", die alle offenen Aufträge löscht (ein Klick auf "offene Aufträge löschen")
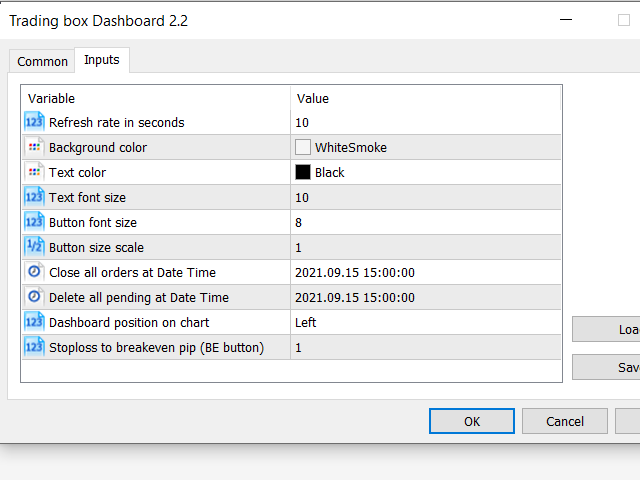
Eingabe "Close all orders at Date Time" mit ON/OFF-Button, um diese Funktion zu steuern (Uhrzeit Order Close)
Eingabe von "Löschen aller Pending zu Date Time" mit ON/OFF Button, um diese Funktion zu steuern (Zeit Pending löschen)
Eingabe "Schriftgröße der Schaltfläche"
Eingabe "Schaltflächengröße skalieren"
Eingabe "Stoploss to breakeven pip - BE button"









































Definitely a must to add to the Trading Box Order Management EA. If you trade a good number of pairs, this tool will help a lot to organize them alphabetically, you will see the PnL of each symbol in each chart. Like if you opened 4 positions in EURUSD, you will see the total grouped PnL in that chart. I love the function to move from chart to chart, in a more faster and organized way, and back to the dasboard, to see the overall situation of all my positions. Great add-on from Igor.