适用于MetaTrader 5的技术指标 - 12
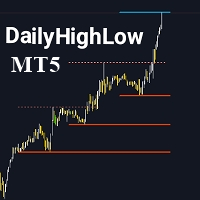
请不要忘记给指标评分,以帮助我提高其可见性。 DailyHighLow 指标是专为 MetaTrader 5 (MT5) 平台设计的强大工具,旨在帮助交易者跟踪每日的价格波动。该指标可以自动绘制趋势线,基于自定义时间段内的最高价和最低价,为需要准确市场信息的交易者提供清晰的视觉辅助。 主要特点: 趋势线个性化设置: 根据您的交易偏好,调整趋势线的颜色、样式和宽度,包括破位线和未破位线。 动态更新: 自动根据最新的市场数据调整趋势线,并使用明显的视觉标记来显示破位情况。 灵活参数设置: 选择显示趋势线的天数,设置破位后趋势线的结束时间,并为最高价和最低价自定义趋势线的外观。 清晰的视觉效果: 通过不同的颜色和线条样式轻松区分破位和未破位的趋势线,使您可以一目了然地识别市场的关键水平。 此指标非常适合希望通过清晰且可自定义的趋势线来增强技术分析的交易者,无论是分析短期趋势还是长期市场动向,DailyHighLow 指标都能为您的交易策略提供宝贵的信息支持。
FREE

The Weis Wave first takes the market volume and then organizes it with the price into Wave charts. It is the only software that will present the true picture of the market before you. If anyone of you, has watched an intraday price movement then you must know that it unfolds in a series of selling as well as buying waves-a procedures tearing down and building up. Wave analysis is an integral part of the trading method. The indicator helps to deal with today’s volatile market. Moreover, it works
FREE
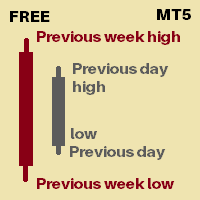
Its an indicator that will show you
Previous day high Previous day low Previous week high Previous week low You can set how many days of history you would like to see for previous day high low and previous week high low Currently 30 days of PDH/L will be marked 4 weeks of PWH/L will be marked You can change it from indicator settings. Dates are shown at marking lines to identify which date does that marking belongs to.
Thank you :) Always open to feedback and criticism if it helps me provide yo
FREE

This indicator uses support and resistance, volume and some special formula to calculate the volume to filter the candles. If the volume reaches a specific value, And at the same time, Candle breaks the support/resistance line, There would be a signal and we can enter the market. Signals appear when the current candle closes. then you can enter the trade when a new candle appears. Please don't forget to follow your money management plan.
MT4 Version Support/Resistance Breakout MT4 : https:/

The Weis Waves RSJ Indicator sums up volumes in each wave. This is how we receive a bar chart of cumulative volumes of alternating waves. Namely the cumulative volume makes the Weis wave charts unique. It allows comparing the relation of the wave sequence characteristics, such as correspondence of the applied force (expressed in the volume) and received result (the price progress).
If you still have questions, please contact me by direct message: https://www.mql5.com/en/users/robsjunqueira/
FREE
点击此处查看我所有免费产品
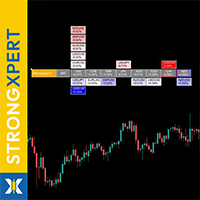
StrongXpert 是你的全球外汇市场 实时强弱监控工具 。 它的设计目的是向你展示 资金实际流入的位置 - 以及资金流出的方向 。 该指标测量 所有八大主要货币的相对强度 (USD, EUR, GBP, JPY, AUD, CAD, CHF, NZD) 并将复杂的价格波动转化为简单、易读的可视化仪表板 - 直接在图表上显示。 几秒钟内即可识别最强和最弱的货币 - 非常适合用于确认交易设置、 过滤趋势方向或捕捉反转点。 不再猜测,不再推测 - 只有清晰的实时市场结构。 许多强弱指标只显示简单计算或延迟数据, 而 StrongXpert 通过 连续实时分析 动态适应市场阶段。 它每秒都会提供最新、精准的货币强弱关系图 - 无延迟、 无重绘、无妥协。 这让你能够在市场波动完全爆发之前快速做出反应。
规格 实时计算 货币相对强度 支持全部八大主要货币 (USD, EUR, GBP, JPY, AUD, CAD, CHF, NZD)
显示强度 百分比或点数
颜色编码:绿色 - 强势,红色 - 弱势
动态排序 根据当前强度自动排序
可调整时间单位
FREE

VWAP Fibo Bands RSJ is an indicator that traces the lines of the daily VWAP and from it creates bands using Fibonacci proportions. This spectacular indicator creates 10 band levels through the selected VWAP period using Fibonacci ratios.
It is fantastic how the prices respect each level of the bands, where it is possible to realize that almost every time the price closes above / below a level of the bands he will seek the next one. If close above will seek to reach the level above and if close
FREE
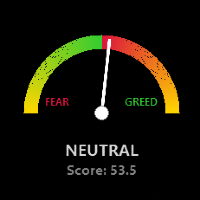
Global Market Risk Sentiment Meter 1. Abstraction The Global Market Risk Sentiment Meter is a sophisticated analytical tool designed for the MetaTrader 5 (MQL5) platform. Unlike traditional indicators that analyze a single asset in isolation, this utility employs an Inter-Market Analysis approach to reconstruct the psychological state of the global financial markets. By aggregating real-time data from US Indices, Global Equities, Cryptocurrencies, and Safe Haven assets (Gold and the US
FREE

Grebenka - помощник для разметки графика.
Функционал: 1. позволяет непрерывно рисовать линии ZigZag в ручном режиме, используя клики мышкой. 2. позволяет включать режим, при котором любая трендовая линия с которой в данный момент проводится манипуляция, выравнивается по горизонтали.
Горячие клавиши: [Z] - включение/выключение режима рисования линий ZigZag вручную [X] - включение/выключение режима горизонтальной трендовой линии [C] - быстрая смена цвета линий ZigZag [Del] - стандартная клавиш
FREE

TRUE SPIKES DERIV telegram channel for more information and other products: https://t.me/automated_TLabs
DM: https://t.me/gg4rex
Professional Trend-Spike Detection & Performance Tracking System for Boom & Crash Indices Download product user manual here: WHAT IS TRUE SPIKES? True Spikes is a precision-engineered trend-following indicator specifically designed to capture explosive spike movements in Boom and Crash synthetic indices. Unlike reversal-based systems, this indicator rides the m
FREE

描述
ICSM(脉冲-修正SCOB映射器)是一个分析价格走势并识别有效脉冲、修正和SCOB(单蜡烛订单块)的指标。它是一个强大的工具,可以与任何类型的技术分析一起使用,因为它灵活、信息丰富、易于使用,并且能显著提高交易者对最具流动性的兴趣区域的认识。
设置
常规 | 视觉
颜色主题 — 定义ICSM的颜色主题。
SCOB | 视觉
显示SCOB — 启用/禁用SCOB;
标记SCOB — 代表SCOB表示的样式选项列表;
SCOB颜色 — 定义SCOB的颜色;
ICM | 视觉
显示ICM线 — 启用/禁用ICM(脉冲-修正映射器)线;
显示IC趋势 — 通过图表底部的彩色分隔线启用/禁用脉冲-修正趋势的可视化;
线条颜色 — 定义ICM线的颜色;
线条样式 — 定义ICM线的样式;
警报
ICM — 启用/禁用突破ICM线的警报;
SCOB — 启用/禁用SCOB创建的警报;
ICM+SCOB — 启用/禁用在单个脉冲/修正结束时出现SCOB的警报,该SCOB抓取ICM线的流动性。
ICM+SCOB(同一蜡烛) — 启用/禁用在抓取ICM线流动性
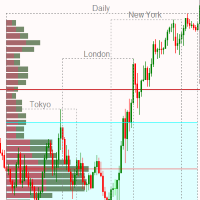
Market Session and Volume Profile Indicator A Professional Trading Tool for Advanced Market Analysis This sophisticated indicator combines Market Session Analysis with Volume Profile Technology to provide traders with critical market structure insights. Volume Profile is one of the most powerful analytical tools used by institutional traders and market makers to identify key price levels where significant trading activity occurs. Key Features: Volume Profile Analysis: POC (Point of Control) - I

自动在你的图表上画出支撑位和阻力位以及推动性蜡烛缺口,这样你就可以看到价格接下来可能会走向哪里和/或可能会逆转。
该指标旨在作为我的网站(The Market Structure Trader)上教授的头寸交易方法的一部分,并显示目标和潜在入场的关键信息。 MT4 Version: https://www.mql5.com/en/market/product/97246/ 该指标有两个核心功能和四个附加功能: 核心功能1 - 日线、周线和月线的自动支持和阻力线 该指标为你自动绘制过去2天以及6周和数月前的最新支撑和阻力水平。你可以完全自定义这些水平的外观以适合你,并显示多少个。这些关键水平通常作为主要的支持和阻力区,价格将从这里转向并回撤或逆转。它们也是价格将走向的目标,因此你可以迅速看到在价格可能转向之前交易的潜在距离。
核心特征2--推进型蜡烛缺口目标 推进性缺口蜡烛是银行和机构通过在任何市场上执行大额头寸而创造的强劲、快速的移动。这些大阳线一旦形成,有两个关键作用。
1. 1.它们作为一个方向性信号,因为大型市场参与者已经选择了一个方向,一旦发生,价格往往会在一段时间内
Introdução O Precision Spike Detector V2 é um indicador avançado para MetaTrader 5 (MT5) projetado para identificar potenciais picos de preço (movimentos bruscos de mercado) em índices sintéticos (DERIV: Boom, Crash; WELTRADE: GainX e PainX).
Ele combina análises de RSI (Índice de Força Relativa) e ATR (Amplitude Média Real) para fornecer sinais precisos e confiáveis. Funciona apenas no período M5 (5 minutos) . Em outros períodos, nenhuma seta será exibida. Principais características Filtro ba

First time on MetaTrader, introducing IQ Star Lines - an original Vedic Astrology based indicator. "Millionaires don't use astrology, billionaires do" . - J.P. Morgan, Legendary American financier and banker.
IQ Star Lines, an unique astrological indicator purely based on Vedic astrology calculations, published for the first time on Metatrader. This unique tool plots dynamic planetary grid lines based on real-time stars, constellations, and celestial movements, which allows you to plot t

INDICATOR: GEN Zenith Developer: gedeegi General Description GEN Zenith is a technical indicator designed to automatically identify price reversal patterns (Zenith) based on pivot price detection and delta volume movement. This indicator looks for points where the price forms a swing high or swing low, then detects a breakout from that area to confirm a strong reversal signal. This indicator is highly suitable for reversal and breakout strategies, or as a signal confirmation tool in your tradin
FREE

This indicator uses the Zigzag indicator to identify swing highs and swing lows in the price chart. Once it has identified the swing highs and swing lows, it can use them to determine potential support and resistance levels. A support level is formed when the price drops and bounces back up from a swing low, indicating that there is buying pressure at that level. A resistance level is formed when the price rises and reverses downward from a swing high, suggesting selling pressure at that level.
FREE

TG MTF MA MT5 is designed to display a multi-timeframe moving average (MA) on any chart timeframe while allowing users to specify and view the MA values from a particular timeframe across all timeframes. This functionality enables users to focus on the moving average of a specific timeframe without switching charts. By isolating the moving average values of a specific timeframe across all timeframes, users can gain insights into the trend dynamics and potential trading opportunities without sw
FREE
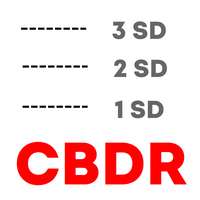
Haven CBDR 是一个易于使用的指标,可在图表上显示 ICT “中央银行交易商区间”(CBDR)。该程序绘制矩形,标示 CBDR 价格区间,并显示额外的标准差线,以评估可能的支撑和阻力水平。产品允许自定义 CBDR 的时间区间、显示的日历天数、图形元素的颜色和样式,并根据图表主题自动调整配色方案。此外,指标还会绘制垂直线,标示每日蜡烛图的开盘,有助于掌握市场动态。 其他产品 -> 点击这里 交易者如何使用: 参数设置:
如有需要,可调整会话的开始和结束时间,并自定义显示参数(颜色、矩形边框样式、标准差线和标记)。 区间分析:
使用显示的矩形快速评估所选期间内的 CBDR 价格区间。标准差线有助于确定潜在的反转或延续水平。 寻找交易信号:
每日蜡烛开盘的垂直线和区间信息,为交易者提供更多参考,帮助确定进出场位置,从而更好地与机构资金动向同步。 这款工具适合希望在交易会话内清晰掌握价格区间,并基于客观图表分析优化策略的交易者。
FREE

Buy Sell Signal Low TF gives buy/sell signals and alerts with up and down arrow at potential reversal of a pullback or a trend continuation pattern in low timeframe. This is an indicator which gives signals based on trend => It works best in trend market with the principle is to ride on the trend not trade against the trend.
The components of Buy Sell Signal Low TF: - The trend is determined by SMMA 13 , SMMA 21 and SMMA 35 ( can be changed manually to suit your preference). - The signal is b
FREE
Product Description: Swing Points & Liquidity (MT5) What it does:
This indicator automatically identifies significant "Swing Highs" and "Swing Lows" (Fractals) on your chart. It assumes that these points represent Liquidity (where Stop Losses and Buy/Sell stops are resting) or Supply and Demand Zones . When a Swing High is formed, it projects a Red Box/Line to the right (Supply/Resistance). When a Swing Low is formed, it projects a Green Box/Line to the right (Demand/Support). As

如果你象这个项目一样,就有5个饥饿审查。 由于机构贸易量很大,因此它们不愿意努力设法争取。
在特定百分比上捍卫立场。 这些级别将成为你可以利用的自然支持和抵抗力。
进入贸易或了解对你立场的可能危险。 一个共同使用百分比的实例是欧盟可持续发展集团的0.25%和0.50%。
星期,你可以看到关于屏幕的这一例子。 有了这一指标,你将能够利用百分比的差异: 日。 周。 Month. 资格。 年。
FREE

Donchian Channel is an indicator created by Richard Donchian. It is formed by taking the highest high and the lowest low of the last specified period in candles. The area between high and low is the channel for the chosen period.
Its configuration is simple. It is possible to have the average between the upper and lower lines, plus you have alerts when price hits one side. If you have any questions or find any bugs, please contact me. Enjoy!
FREE
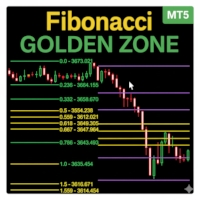
Fibonacci Sessions 指标是一款强大的交易工具,专为精准剥头皮和日内策略而设计。它会自动绘制纽约、伦敦和亚洲交易时段的关键斐波那契水平,为交易者提供主要市场时段的价格动态清晰视图。每个交易时段都会突出显示独特的“黄金区域”,这是价格最常反应的地方。这为反转、突破和趋势延续交易创造了高度可靠的区域。该指标直观展示了价格如何经常从一个黄金区域移动到另一个黄金区域,帮助交易者捕捉持续性的机会。该指标针对 XAUUSD 的 M5 时间框架进行了优化,同时在其他外汇货币对和全球指数上也表现出色。无论您交易的是黄金、外汇还是指数,这个基于交易时段的斐波那契指标都会为您提供额外优势,帮助识别高概率交易区域。主要功能:自动绘制亚洲、伦敦和纽约时段斐波那契水平;清晰显示每个时段的黄金区域;识别价格从一个黄金区域到另一个黄金区域的重复走势;优化用于 XAUUSD M5 时间框架;适用于外汇和全球指数;适合剥头皮交易者和日内交易者。 红线:极限盈利目标位 黄线:黄金区域(高概率反应区) 其他彩色线条:基于交易时段的斐波那契水平
FREE

This is just a MACD with multi symbols, multi timeframes, and multi colors. features. different symbols and timeframes from the main chart. draw main line, signal line, and histogram. each line can be erased. the ascent and descent can be distinguished. Due to the above features, this MACD is suitable for multiple lineups in a single chart. This can be used in the same way as MiniCandles.
FREE

WickSniper Pro – Precision Reversal Indicator for Smart Traders ===============================================================
WickSniper Pro is a powerful **non-repainting** price action indicator that detects **inside bar breakout reversals** with sniper-like accuracy. Whether you're a scalper, swing trader, or day trader, WickSniper Pro helps you catch high-probability turning points in the market using clean, intuitive signals.
Key Features ------------ - Non-Repainting – Once a signa
FREE

The Penta-O is a 6-point retracement harmonacci pattern which usually precedes big market movements. Penta-O patterns can expand and repaint quite a bit. To make things easier this indicator implements a twist: it waits for a donchian breakout in the right direction before signaling the trade. The end result is an otherwise repainting indicator with a very reliable trading signal. The donchian breakout period is entered as an input. [ Installation Guide | Update Guide | Troubleshooting | FAQ | A
FREE

PO3 斐波那契-哥德巴赫 - 市场分析的终极指标
融合尖端数学与智能交易,解锁市场奥秘!
---
独家功能:
1. 独特的哥德巴赫层级系统 · 自动识别订单区块(OB)、公允价值缺口(FVG)、流动性真空(LV)和 mitigation blocks (MB)。 · 基于哥德巴赫猜想,精确计算拒止区块(RB)和均衡区域(EQ)。 · 提供 111.1% 和 -11.1% 扩展位,预测当前区间外的价格运动。 2. 动态交易区间 (PO3) · 根据市场波动性自动调整区间范围。 · 6 种区间尺寸可选(27, 81, 243, 729, 2187 和 6561 点),适用于不同资产和时间框架。 · 自动投射下一级更高和更低的交易区间。 3. 谐波共振技术 · 融合尼古拉·特斯拉的能量共振原理与哥德巴赫的数学理论。 · 识别机构吸筹和派发点。 4. 完全自定义 · 颜色、样式、线条粗细均可完全自定义。 · 选项控制显示/隐藏标签、扩展级别和细分线。
---
核心优势:
卓越的数学精度
· 基于素

凤凰ATR波动率计(MT5)
专为MetaTrader 5设计的实时波动率监测工具。运用平均真实波动范围(ATR)技术,在图表上直观呈现当前市场波动强度。
功能定位
市场波动率直接影响止损设置、仓位管理、滑点控制及策略执行效果。忽视波动率的交易往往导致:在快速市场中承担过度风险,或在平静行情中错失良机。
凤凰ATR波动率计基于当前图表数据计算ATR值,并在图表上清晰显示数值。该指标实时更新,可自动适配交易品种与时间周期变化,帮助交易者判断市场处于平静、活跃或高波动状态。
安装说明
从MQL5市场下载后附加至任意图表,指标将立即显示且无需配置。
系统要求
MetaTrader 5 3280版或更高版本。本指标为自定义指标,采用ATR衡量波动性,兼容所有经纪商及交易品种。ATR数值随所选时间周期变化。
反馈与评价
若您认为本工具实用,敬请在MQL5平台给予五星好评。您的反馈将直接影响凤凰团队的后续更新、优化及新工具开发——我们致力于打造交易者真正重视的功能。
技术支持
通过MQL5私信提供终身支持,24小时内响应。
开发方:凤凰环球投资有限公司 2025 凤凰
FREE

该指标仅显示布林格风格波动通道的上轨和下轨,不绘制中央移动平均线。其主要目标是提供一个干净且灵活的波动包络,使交易者能够专注于价格相对于通道边界的行为,同时完全掌控图表的视觉风格和结构。 与传统布林带不同,传统布林带始终显示中间的移动平均线,而本指标仅在内部计算中使用移动平均线。中央线被刻意隐藏,以减少视觉干扰,并允许用户在需要时单独管理中线。 上下轨可以分别设置独立的颜色,从而实现更清晰的视觉区分,并更好地适应不同的图表主题或个人偏好。希望使用传统布林带外观的交易者,可以添加一个具有相同参数的独立移动平均指标。通过匹配周期和价格来源,用户可以有效地重建标准布林带结构,同时完全控制中线的颜色和样式。 在当前阶段,该指标有意限制为基于收盘价计算的简单移动平均线(SMA)。这一设计选择确保了计算的透明性、一致性和性能稳定性。如果用户需求足够,未来版本可能会考虑支持其他类型的移动平均线(如 EMA、WMA 等)。 主要特性: 仅显示上下波动带
不绘制中线(仅用于计算)
上下轨支持独立颜色设置
使用基于收盘价的简单移动平均线(SMA)
干净、简约的图表外观
周期和偏差参数完全可配置
兼容所有交
FREE

前一交易日的收盘价与K线位移 MetaTrader! 前一交易日的收盘价与K线位移指标是一种旨在改善技术分析和交易决策的工具。借助该指标,您可以获取有关任何K线的开盘价、最高价、最低价和收盘价的详细信息,从而实现对市场走势的精确和全面分析。 想象一下,您可以将一个时间框架放置在另一个时间框架之内,以便在当前时间框架内详细分析每根K线。通过前一交易日的收盘价与K线位移指标,您可以轻松实现这一令人难以置信的功能! 前一交易日的收盘价作为支撑位和阻力位的重要性已经得到交易者社区的广泛认可。现在,通过这个工具,您可以清晰准确地看到价格在前一收盘价停止的水平,为您的买卖决策提供宝贵的见解。 将该指标应用于您的图表上后,您将立即获得前一交易日的开盘价、最高价、最低价和收盘价等关键信息,以视觉上引人注目的方式突出显示。此外,您还可以调整K线的位移,使您能够在当前时间框架内分析MetaTrader的任何时间框架的数据。 这个独特的功能将使您能够根据所选时间框架中前一交易日收盘价提供的支撑位和阻力位,识别基于任何所需时间框架的蜡烛图形态,开启新的交易机会,并增加您的成功机会。您可以基于前一交易日的收盘价
FREE

YOU CAN NOW DOWNLOAD FREE VERSIONS OF OUR PAID INDICATORS . IT'S OUR WAY OF GIVING BACK TO THE COMMUNITY ! >>> GO HERE TO DOWNLOAD
More About Advanced Currency Meter Every good forex system has the following basic components: Ability to recognize the trend direction. Ability to identify the strength of the trend and answer the basic question Is the market trending or is it in a range? Ability to identify safe entry points that will give a perfect risk to reward (RR) ratio on every position.
FREE
The Trend Duration Forecast MT5 indicator is designed to estimate the probable lifespan of a bullish or bearish trend. Using a Hull Moving Average (HMA) to detect directional shifts, it tracks the duration of each historical trend and calculates an average to forecast how long the current trend is statistically likely to continue. This allows traders to visualize both real-time trend strength and potential exhaustion zones with exceptional clarity. KEY FEATURES Dynamic Trend Detection: Utiliz

This indicator calculates support and resistance prices in multi-timeframe with different formulation and draw them on the chart that style do you choose. And If you want, Indicator can alert you when the current price arrive these pivot levels. Formulations: Classic, Camarilla, Woodie, Demark, Floor, Fibonacci
Alert Options: Send Mobil Message, Send E-mail, Show Message, Sound Alert
Levels: PP, S1, S2, S3, S4, S5, R1, R2, R3, R4, R5, TC, BC and Middle Points Why do you need this indicator:
Ti
FREE

该指标使用多个时间框架来分析繁荣 1000 中的最佳买入入场点。它专为帮助仅在繁荣高峰时进行交易而量身定制。该指示器有两个箭头;红色和蓝色的。红色箭头的形成表明您应该准备好迎接蓝色箭头,这是买入入场信号。该指标不提供退出点。始终收集 3 点,即如果您以 10230.200 进入交易,您可以在 10260.200 退出,止损为 1 点,即 10220.200。如果您遵守该规则并保持纪律,该指标可能会对您的交易有所帮助。
为什么需要该指标?
- 它分析市场并以通知的形式向您的手机、平板电脑或计算机发送实时信号。
-您在等待下一个通知时收到信号通知、进行交易并做其他事情。
有什么要求?
-您需要一个 vps 来托管实时信号通知指示器
-您需要将信号通知从您的 vps 上的交易终端推送到您的手机或平板电脑
如何在 VPS 上安装
在您的 vps 上安装 meta trader 5 并将指标附加到您的终端上。输入您的 mql5 ID,将信号通知推送到您选择的设备。
FREE
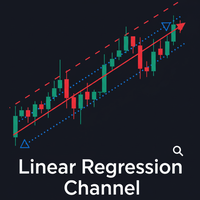
The Linear Regression Channel is a powerful technical analysis tool that helps visually identify the prevailing trend and potential price zones. Essentially, the indicator performs two main functions: It draws a trendline through the center of price action over a specified period. This line is calculated using the linear regression method, which results in the best possible "line of best fit" for the price data. From this center line, the indicator plots two parallel lines above and below, creat
FREE
Reversal Pattern AI — an absolute breakthrough in the world of indicator development, combining artificial intelligence algorithms, multi-level market analysis, and classical methods of technical analysis. It not only detects reversal patterns but also evaluates market inefficiencies, generating highly accurate trading signals. Thanks to a hybrid model that uses price action analysis, Volumes, Volatility, VWAP, and Volume AVG %, the indicator easily adapts to any market conditions.

交易时段指标突出显示每个交易时段的开始和结束。 Trading_Sessions_Indicator_Pro产品的付费版本,可以自定义会话的开始/结束 >>>
[选项:] Timeshift - 如果会话存在时间偏移,则使用它
[设置参数:] Asian session Open=0; Asian session Close=9; Asian session OpenSummertime=1; Asian session CloseSummertime=10; European session Open=8; European session Close=17; European session Open=13; European session Close=22;
我在市场上的其他产品 https://www.mql5.com/en/users/sky-angel/seller
FREE

For those traders who really care about Volume as an important vector information on Price Action, here is an exclusive idea & creation from Minions Labs: Volume Speed . The Volume Speed indicator shows you visually how much time (in seconds, minutes, hours, you choose) the Volume took to reach the Average Volume of the past bars. This way you can have the exact idea of "what is happening right now with the Volume of the current bar..." and take action accordingly with your strategy, having even
Daily & Composite Volume Profile This is a professional-grade market profile tool designed for MetaTrader 5. It utilizes a Dual-Profile System to visualize supply, demand, and liquidity concentrations. Key Features Left Side: Daily Session Profiles Automatically identifies the start and end of every trading day. Generates a unique Volume Profile for each individual day. Allows you to see how value migrated from yesterday to today (e.g., Is today's volume higher or lower than yesterday?).

The Swing High Low Indicator is an essential tool for traders who rely on price action. It automatically marks key reversal points (swing highs in red, swing lows in green), helping you visualize trends, spot breakouts, and draw precise trendlines. By highlighting these critical levels, the indicator reveals market structure shifts—whether the trend is strengthening, reversing, or entering consolidation. Perfect for all timeframes and strategies, it turns raw price data into actionable tra
FREE

This comprehensive technical indicator calculates and plots up to 3 moving averages with 3 different periods. By employing three moving averages of distinct lookback periods, the trader can confirm whether the market has indeed experienced a change in trend or whether it is merely pausing momentarily before resuming its prior state. SX Golden MA Pack for MT4 is available here . The shorter the moving average period, the more closely it tracks the price curve. When a security initiates an upt
FREE

MetaTrader 5 的秒图表
指标允许您在 MetaTrader 5 终端中创建以秒为时间范围的图表。此类图表的时间范围以秒为单位,而不是以分钟或小时为单位。因此,您可以创建时间范围小于 M1 的图表。例如,S15 是周期为 15 秒的时间范围。您可以将指标、专家顾问和脚本应用于生成的图表。
您将获得一个功能齐全的图表,您可以在其上像在常规图表上一样工作。
由于现有的报价数据库,以秒为单位的时间范围不仅是实时构建的,而且还基于历史记录。因此,您可以随时打开已累积历史记录的以秒为单位的时间范围。
同时,数据与基本图表同步更新,没有延迟。
您可以选择以秒为单位的时间范围:S1、S2、S3、S4、S5、S6、S10、S12、S15、S20、S30。 此外,您还可以设置任何所需的值。
注意:
安装此指标并添加到图表后,按“Z”键可在标准时间范围和秒范围内的图表之间切换。

KT Custom High Low shows the most recent highs/lows by fetching the data points from multi-timeframes and then projecting them on a single chart. If two or more highs/lows are found at the same price, they are merged into a single level to declutter the charts.
Features
It is built with a sorting algorithm that declutters the charts by merging the duplicate values into a single value. Get Highs/Lows from multiple timeframes on a single chart without any fuss. Provide alerts when the current pri
StochW%R 动量震荡指标 – 您的智能混合动量指标 精准。降噪。更可靠。 厌倦了在波动市场中产生虚假信号的传统震荡指标? StochW%R 动量震荡指标 是分析动量领域的演进,它将**随机指标 (Stochastic) 和 威廉指标 (%R)**的优点集于一身,成为一个强大且可自定义的指标。 核心优势: 凭借其智能融合算法,它能 减少市场噪音 并提供 更清晰的信号 ,同时提前预警趋势变化。 为什么这个指标更优越? 两种震荡指标的智能融合 随机指标(平滑化): 在识别超买/超卖条件时,对噪音的敏感度较低。 威廉指标(反向和调整): 对价格的剧烈波动反应更灵敏。 结果: 一条 更精确的动量线 ,能够过滤虚假信号并提高可靠性。 用于完美时机的信号线 与 信号线 (StochW%R 的移动平均线)的交叉有助于: 在价格到达极端区域之前 预测反转 。 确认动量变化 ,且滞后性小于传统震荡指标。 完全自定义 通过**“Stoch Weight” 参数,您可以调整 灵敏度和平滑度之间的平衡**: > 0.5: 受随机指标影响更大(适用于横盘市场)。 < 0.5: 受威廉指标影响更大(非常适合强
FREE
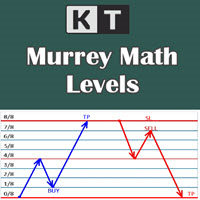
It shows the Murrey Math levels on chart and also provides an alert when price touch a particular level. T. Henning Murrey, in 1995, presented a trading system called Murrey Math Trading System, which is based on the observations made by W.D Gann.
Applications
For Murrey Math lovers, this is a must-have indicator in their arsenal. There is no need to be present on the screen all the time. Whenever the price touches a level, it will send an alert. Spot upcoming reversals in advance by speculatin
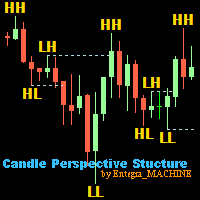
Candle Perspective Structure Indicator MT5 is a simple indicator that defines and displays the candlestick structure of the market. This indicator will suit both experienced traders and beginners who find it difficult to follow the structure visually.
If you want to see more high-quality products or order the development/conversion of your own products, visit my partners' website: 4xDev
Get 10% OFF on manual strategies automation services or indicator development/conversion services at 4xDev
FREE

A Heatmap with a Volume Profile is like a thermal imager or x-ray machine. It will help you to estimate the relative distribution of volume during the price movement and to understand the relationship between volume and price. Indicator Volume Profile "Volumos Maxima" is a powerful tool for analyzing this relationship. After simple experimentation with heatmap, you can find that each trading instrument has its own “ characteristic ” way of distributing volume. And this will help you to make a b

KPL Swing 指标是一个简单的趋势跟随机械交易系统,它自动化入场和出场。该系统使用硬止损和跟踪止损以退出盈利交易。没有目标,因为没有人知道价格可以移动多远(或低)。跟踪止损锁定收益并从交易中去除情绪。 由 Amibroker 指标转换,并进行了修改。 KPL Swing 指标是一个简单的趋势跟随机械交易系统,它自动化入场和出场。该系统使用硬止损和跟踪止损以退出盈利交易。没有目标,因为没有人知道价格可以移动多远(或低)。跟踪止损锁定收益并从交易中去除情绪。 由 Amibroker 指标转换,并进行了修改。 KPL Swing 指标是一个简单的趋势跟随机械交易系统,它自动化入场和出场。该系统使用硬止损和跟踪止损以退出盈利交易。没有目标,因为没有人知道价格可以移动多远(或低)。跟踪止损锁定收益并从交易中去除情绪。 由 Amibroker 指标转换,并进行了修改。 完美结合 KPL Chart Uptrend & Downtrend
FREE

SUPERTREND; It is a trend following indicator based on the SuperTrend ATR created by Olivier Seban. It can be used to detect changes in trend direction and locate stops. When the price falls below the indicator curve, it turns red and indicates a downtrend. Conversely, when the price moves above the curve, the indicator turns green, indicating an uptrend. Like other indicators, it works well on SuperTrend when used in conjunction with other indicators such as MACD, parabolik SAR, Bollinger Band
FREE

Heikin Ashi RSI Indicator for MT5 (HARSI) Overview
The Heikin Ashi RSI (HARSI) indicator combines Heikin Ashi candle smoothing with RSI momentum analysis, providing a dual-layer view of price action and relative strength. It offers a clear visualization of market direction, RSI-based overbought and oversold conditions, and optional backtesting and alert systems for strategy validation and trade signal automation. How It Works
The indicator applies RSI values to Heikin Ashi calculations, creati

MT4 Version MA Ribbon MT5 MA Ribbon is an enhanced indicator with 8 moving averages of increasing periods. MA Ribbon is useful to recognize trend direction, reversals and continuation points in the market as well as potential entry, partial take profit and exit points. Entry points for long and shorts position can be found when the price entries or leaves the Ribbon, at retest or a defined number of MA crossovers. It offers a good combination with mostly any volume or momentun indicators to

KATANA SPECIAL EDITION [MTF MATRIX] for MT5 Product Overview KATANA SPECIAL EDITION is a premium multi-timeframe (MTF) environment recognition and signaling system, rebuilt from the ground up to unlock the full computational potential of MetaTrader 5. While inheriting the core philosophy of the highly acclaimed MT4 version, this "Special Edition" utilizes MT5's high-speed processing to monitor all timeframes from M1 to D1 simultaneously via the 3-TF Matrix Engine . It identifies the "Golden S

Fimathe Indicator The Fimathe Indicator is a tool for MetaTrader 5 designed to help traders identify support, resistance, neutral zones, and price channels. It features an interactive interface for drawing and managing support and resistance levels, generating take-profit channels and neutral zones, and providing visual and sound alerts for breakouts. Key Features Support and Resistance Lines: Dynamic and draggable lines to identify key levels. Reference Channel: Creates a channel between su
FREE

The original author is David Weis, an expert in the Wyckoff Method. The Weis Wave is a modern adaptation of the 1930's Wyckoff Method, another expert in Tape Reading techniques and Chart Analysis. Weis Waves takes market volume and stacks it into waves according to price conditions giving the trader valuable insights about the market conditions. If you want to learn more about this subject you can find tons of videos in YouTube. Just look for "The Wickoff Method", "Weis Wave" and "Volume Spread
FREE

Breakout Monitor is a powerful trading tool designed to track price action within your custom-drawn zones. Simply draw a rectangle on your chart to define your consolidation or key levels, and the indicator will do the rest. It highlights the price range clearly and monitors it in real-time, ensuring you never miss a significant market move. When the price breaks through your defined boundaries, the indicator sends an instant Push Notification directly to your mobile phone in a clear, actionable
FREE

### Indicator Description: Gradient Heiken Ashi with Momentum Coloring
This indicator is a technical analysis tool designed to overlay on the main chart, helping traders easily identify price trends and momentum through modified Heiken Ashi candles. It combines smoothed candle value calculations based on moving averages with a gradient color system to represent the strength of bullish or bearish trends.
#### 1. Key Features
- Display of Modified Heiken Ashi Candles:
- The indicator draws opt
FREE

It is the MQL5 version of zero lag MACD that was available for MT4 here: https://www.mql5.com/en/code/9993 Also there was a colored version of it here but it had some problems: https://www.mql5.com/en/code/8703 I fixed the MT4 version which has 95 lines of code. It took me 5 days to write the MT5 version.(reading the logs and testing multiple times and finding out the difference of MT5 and MT4!) My first MQL5 version of this indicator had 400 lines of code but I optimized my own code again and n
FREE

If you love this indicator, please leave a positive rating and comment, it will be a source of motivation to help me create more products <3 Key Takeaways The Zig Zag Advanced indicator plot points on a chart whenever prices reverse by the percentage the trader sets in the input section. The Zig Zag Advanced indicator lowers the impact of random price fluctuations and is used to identify trends and changes in trends. The indicator lowers noise levels, highlighting trends higher and lower. Th
FREE

The "Support Resistance Dynamic" indicator is a powerful technical analysis tool for the MetaTrader 5 platform, designed to automatically identify and plot dynamic Support and Resistance zones on price charts. This indicator helps traders easily recognize important price levels, potential reversal points, or breakout areas, thereby enabling more informed trading decisions. 2. Key Features Dynamic S/R Identification : Automatically identifies support and resistance zones based on an advanced Pivo
FREE

This indicator calculates the volume profile and places labels that correspond to the VAH, VAL and POC levels, for each candle individually.
Indicator operation features The indicator works on the timeframes from M3 to MN, but it uses the history data of smaller periods: M1 - for periods from M3 to H1, M5 - for periods from H2 to H12, M30 - for the D1 period, H4 - for the W1 period, D1 - for the MN period. The color and location of the VAL, VAH and POC labels on the current candle are considere
FREE

Highly configurable Stochastic indicator.
Features: Highly customizable alert functions (at levels, crosses, direction changes via email, push, sound, popup) Multi timeframe ability Color customization (at levels, crosses, direction changes) Linear interpolation and histogram mode options Works on strategy tester in multi timeframe mode (at weekend without ticks also) Adjustable Levels Parameters:
Stochastic Timeframe: You can set the lower/higher timeframes for Stochastic. Stochastic Bar S
FREE

This indicator can be considered as a trading system. It offers a different view to see the currency pair: full timeless indicator, can be used for manual trading or for automatized trading with some expert advisor. When the price reaches a threshold a new block is created according to the set mode. The indicator beside the Renko bars, shows also 3 moving averages.
Features renko mode median renko custom median renko 3 moving averages wicks datetime indicator for each block custom notification
FREE

考拉价格行为扫描仪 - 发掘价格行为的力量 **介绍:**发现全新的考拉价格行为扫描仪 - 一款多功能、多货币、多时间框架的工具,旨在检测基本价格行为模式,并在直观的扫描表中呈现。 **摘要:**该指标超越寻常,为用户提供在多个货币和时间框架上识别关键价格行为模式的能力。 特点: 吞没模式(Engulf Pattern) 锤子模式(PinBar Pattern) 十字模式(Doji Pattern) 可定制设置: 吞没模式: 第2根蜡烛的最小实体大小:定义第2根已关闭蜡烛的最小实体大小(即第2根已关闭蜡烛)。 第1根蜡烛的最小实体大小:设定最近已关闭蜡烛的最小实体大小。 锤子模式: 最大实体百分比:通过此参数,您可以调整锤子实体的最大百分比,相对于影线的大小。 十字模式: 最大较小实体大小:用户可以通过此参数调整最大实体大小。在纯粹的十字模式中,实体大小必须为0,但用户可能想以最大10点的大小查看模式。 符号设置: 输入最多10个符号名称,符号名称必须与市场观察符号字符相匹配。用户可以使用“最大符号”参数控制这些符号中的出现数量。 时间框架设置: 切换M1至MN时间框架,启用或禁用每个
FREE
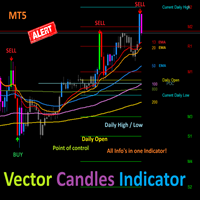
Vector Candles Indicator This is an easy and safe tool for MetaTrader 5 (MT5). It colors candles on your chart based on trading volume to spot trend changes.How to Spot Entry Signals Up Vector Candle: If a green candle with high volume closes (lime or blue color), sell. Price will likely drop back to where the candle started. Down Vector Candle: If a red candle with high volume closes (red or purple color), buy. Price will likely rise back to where the candle started. Detailed setup: Check http
FREE
Optimized Trend Tracker (OTT) Indicator The Optimized Trend Tracker (OTT) is a custom indicator designed to visualize trend direction and potential changes based on a configurable moving average and dynamic support/resistance levels. It provides multiple visualization and signal options, making it suitable for discretionary analysis or integration into automated systems. Key Features Configurable Moving Average Types
Supports SMA, EMA, WMA, TMA, VAR, WWMA, ZLEMA, and TSF for flexible calculatio

The Inside Bar pattern is a very well known candlestick formation used widely by traders all over the world and in any marketplace. This approach is very simple and adds a little confirmation candle, so it adds a third past candlestick to the count to confirm the direction of the move (upward or downward). Obviously, there is no power on this candlestick formation if the trader has no context on what it is happening on the market he/she is operating, so this is not magic, this "radar" is only a
FREE

Closing Price Reversal is a very well known and traded candlestick pattern. This little indicator paints with specific (user-selected) colors the Closing Price Reveral Up and Down patterns, as well as the Inside Bars (as a bonus). Higher timeframes are more effective as with all other candlesticks patterns. Do NOT trade solely on this indicator. Search the web for "Closing Price Reversal" to learn about the several approaches that can be used with this pattern. One of them is combining short/me
FREE

Developed by MMQ — Session Based Market Profile TPO Indicator This indicator organizes price and time information into session-based Market Profiles, helping you identify value areas, points of control, and single prints for more informed trading analysis. Inspired by Jim Dalton’s book “Mind Over Markets”.
What is Session-Based Market Profile? Session Based Market Profile is a powerful analytical tool that organizes price and time information to reveal market structure, value areas, and trade
FREE
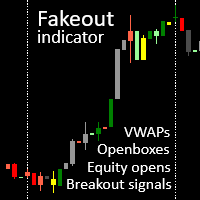
akeout candle indicator with session VWAPs, openboxes and openbox breakout signals. Check out our other products for fxer.net:
https://www.mql5.com/en/market/product/114888
https://www.mql5.com/en/market/product/114890 Main features 1. VWAPS for Tokyo, London and NY sessions 2. Openboxes for Tokyo, London and NY sessions 3. Colored candles for breakouts, fakeouts and inside candles 4. Equity open line 5. Openbox expansions 6. Unmitigated equity open prices for Tokyo, London and NY sessions 7
FREE
MetaTrader市场是 出售自动交易和技术指标的最好地方。
您只需要以一个有吸引力的设计和良好的描述为MetaTrader平台开发应用程序。我们将为您解释如何在市场发布您的产品将它提供给数以百万计的MetaTrader用户。
您错过了交易机会:
- 免费交易应用程序
- 8,000+信号可供复制
- 探索金融市场的经济新闻
注册
登录