YouTubeにあるマーケットチュートリアルビデオをご覧ください
ロボットや指標を購入する
仮想ホスティングで
EAを実行
EAを実行
ロボットや指標を購入前にテストする
マーケットで収入を得る
販売のためにプロダクトをプレゼンテーションする方法
MetaTrader 5のためのテクニカル指標 - 12
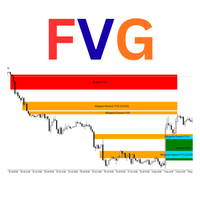
Luta FVG Pro – Professional Fair Value Gap (FVG) Indicator
Detects Institutional Fair Value Gaps on H4 timeframe with the same way used by ICT/SMC traders.
Features: • Real-time Bullish & Bearish FVG detection • Automatic Mitigation tracking • Inverted FVG signals (very powerful reversal setups) • "GOOD" FVG marking (gaps ≥ 2× minimum size – higher probability) • Clean rectangles with smart labels (Bullish FVG / Mitigated / Inverted) • Overlap filter option • Maximum 50 active zones (no chart
FREE
** All Symbols x All Timeframes scan just by pressing scanner button ** ***Contact me to send you instruction and add you in "RSI scanner group" for sharing or seeing experiences with other users. Introduction RSI divergence is a main technique used to determine trend reversing when it’s time to sell or buy because prices are likely to drop or pick in the charts. The RSI Divergence indicator can help you locate the top and bottom of the market. This indicator finds Regular divergence for pullba

Introduction The "Ultimate Retest" Indicator stands as the pinnacle of technical analysis made specially for support/resistance or supply/demand traders. By utilizing advanced mathematical computations, this indicator can swiftly and accurately identify the most powerful support and resistance levels where the big players are putting their huge orders and give traders a chance to enter the on the level retest with impeccable timing, thereby enhancing their decision-making and trading outcomes.
FREE

Introduction to Fibonacci Volatility Indicator Volatility indicator can help you to detect any statistical advantage for your trading. Especially, if you are trading with Price Action and Price Patterns, then we recommend to use the Volatility indicator together with your strategy. Especically, Fibonacci Volatility indicator combines the market volatiltiy with Fibonacci Analysis to provide you more advanced volatiltiy indicator. Main Features Fibonacci Volatility in Z score Configuration Mode Fi

KT Momentum Arrows インジケーターは、一方向への急激なボラティリティとバンドの乖離に基づいて計算される、瞬間的なブレイクアウトを検出するツールです。動きの強さとタイミングを捉えることに特化しており、モメンタムトレードに最適です。 価格が上部バンドを上抜けして終値が確定したときに買いシグナルが、下部バンドを下抜けしたときに売りシグナルが発生します。 バンドの広がりとボラティリティの両方に影響を与える「係数(Magnitude Coefficient)」が入力として用いられます。通貨ペアや時間軸に応じて最適な値を選定し、分析することが推奨されます。
主な特徴
リペイントなし! モメンタムトレーダーにとって優れたエントリーツール。 勝率、平均利益、勝ち/負けなどのパフォーマンス分析機能付き。 デイトレード、スイングトレード、スキャルピングに対応。
入力パラメーター 履歴バー数: インジケーター計算に使用するローソク足の数。 マグニチュード係数: バンドの拡張とボラティリティ計測に使う単一の係数。 パフォーマンス分析: 利益傾向のラインを含む分析を表示/非表示に切

This Demand & Supply Zone Indicator with Volume Filtering is a technical analysis tool for MetaTrader that identifies key price zones where buying (demand) or selling (supply) pressure is concentrated. It uses fractals, volume analysis, and price action to detect and highlight these zones on the chart. Key Features: Zone Detection Based on Fractals Identifies demand (support) and supply (resistance) zones using fractal patterns (local highs/lows). Zones are formed from open prices ar
FREE
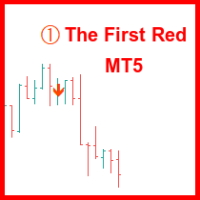
「The First Red」インジケーターは、ダリウシュ・ダルゴ(Dariusz Dargo)が考案した戦略に基づき、「The First Red」戦略および「Second Red」、「First Green」、「Second Green」などの拡張条件を満たすローソク足をチャート上で特定してマークするために設計されています。この戦略は、局所的な極値の分析とMACDオシレーターのシグナルを中心に展開されています。 第一の赤いローソク足(First Red Candle): ローソク足が局所的な最高値を形成し、MACDヒストグラムが下降方向に転じたときに「First Red」としてマークされます。 チャート上のシンボル:ローソク足の上に赤い下向きの矢印。 第二の赤いローソク足(Second Red Candle): 「First Red」に続く第二の下降ローソク足で、方向転換を確認します。 チャート上のシンボル:ローソク足の上に赤い数字「2」。 第一の緑のローソク足(First Green Candle): ローソク足が局所的な最安値を形成し、MACDヒストグラムが上昇方向

Ultimate Pivot Levels indicator for MetaTrader 5 Ultimate_Pivot_Levels is versatile tool designed to enhance your trading experience by accurately plotting pivot levels on your charts. It allows entering your desired values manually or using well known pivot calculation methods to create pivot levels. It draws the levels in the background and allows you to customize levels, size and colors of areas, and it keeps your adjustments while extending the levels to every new bar. Whether you are a novi
FREE
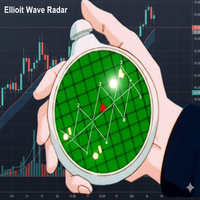
このインジケーターは何をしますか? このインジケーターは、チャートを自動的に分析して エリオット波動のパターン (推進波と修正波)を特定し、リアルタイムで波1、2、3、4、5がどこにあるかを表示します。さらに、 価格予測 、 出来高の検証 、および 三角保ち合いの検出 も含まれています。 この「レーダー」バージョンはどのように改善されましたか? 目標の予測: 第5波での価格の行方を提案します。 出来高による検証: 出来高が検出されたパターンを支持しているか確認します。 三角保ち合いの検出: 複雑な修正(収縮、拡張、対称)を特定します。 確率分析: 検出されたパターンの信頼性(%)を示します。 複数の代替カウント: 市場が曖昧な場合に、複数の有効な選択肢を提供します。 色と線の見方 波の線: 青: 推進波 (1、3、5)— 主要なトレンド。 赤: 修正波 (2、4)— トレンド内の後退。 黄色い線(推奨される後退) この線は、修正が終了する可能性が最も高い水準を示します。 もし価格が後退し、黄色の線の基部(価格に最も近い点であり、エントリーレベルとして機能します)を破ると、その線が反対側
FREE

Time Session OPEN-HIGH-LOW-CLOSE This Indicator Will Draw Lines Of OHLC Levels Of Time Session Defined By User. It Will Plot Floating Lines On Current Day Chart. Time Session Can Of Current Day Or Previous Day. You Can Plot Multiple Session Lines By Giving Unique ID To Each Session. It Can Even Show Historical Levels Of Time Session Selected By User On Chart To Do Backdating Test. You Can Write Text To Describe The Lines.
FREE

All-in-one trading powerhouse: trend, reversal, and exhaustion detection
This indicator is a personal implementation of the famous Traders Dynamic Index, which uses RSI, moving averages and volatility bands to find trends, reversals and price exhaustions. However, this particular implementation supports not only RSI, but many others. It is suitable for scalping, day trading, and swing trading and aims to provide a full picture of the current market conditions. [ Installation Guide | Update Guid
FREE

Cybertrade Keltner Channels - MT5 Created by Chester Keltner, this is a volatility indicator used by technical analysis. It is possible to follow the trend of financial asset prices and generate support and resistance patterns. In addition, envelopes are a way of tracking volatility in order to identify opportunities to buy and sell these assets.
It works on periods longer than the period visible on the chart. All values are available in the form of buffers to simplify possible automations.
FREE

ここに、デリバティブmt5取引プラットフォームでのCRASH合成インデックスによる取引に革命をもたらす指標があります。
ゴッドスパイククラッシュ。
主な特徴:
CRASHインデックスでのみ機能します。 トレンドフィルターがあります。 市場が落ち込んでいるときにのみアラートを送信します。 サウンドアラート。 あなたはモバイルにアラートを送ることができます。
使い方:
m1とm5の一時性に適用します。 サウンドアラートを待ちます。 強い傾向があるか、すでに始まっていることを分析します。 トレンドの終わりに警戒しないでください。 合理的な毎日の利益を見つけます。 保有する資本に対して適切なリスク管理を行う。 レバレッジをかけすぎないでください。
詳細についてはお問い合わせください:
WhatsApp: +5930962863284
ここで、ブーム指数の私の指標を見つけることができます。 https://mql5.com/8bw9b
購入後、このツールを最も可能に使用する方法についての追加ガイドを送信するために私に連絡してください

Contextualize the Narrative: Multi-Timeframe Structure Simplified The HTF Period Cycles is a high-performance visualization tool designed for traders who need to anchor their intraday analysis to Higher Timeframe (HTF) levels without the friction of switching tabs. By projecting the Open, High, Low, and Close (OHLC) of completed HTF cycles directly onto your lower timeframe (LTF) chart, you can maintain a crystal-clear bias while executing in the "now." Why This belongs in Your Toolkit Successfu
FREE

Check out my TRADE PLANNER MT5 – strongly recommended to anticipate account scenarios before risking any money. You get a professional moving average indicator with multiple calculation methods available, including exponential, linear, smoothed and linear weighted approaches. The indicator is designed to work on smoothed Heikin Ashi candles, which are included in the 'Examples' folder of Meta Trader 5. By applying this tool, traders can significantly reduce unwanted market noise.
FREE

This is an advanced multi-timeframe version of the popular Hull Moving Average (HMA) Features Two lines of the Hull indicator of different timeframes on the same chart. The HMA line of the higher timeframe defines the trend, and the HMA line of the current timeframe defines the short-term price movements. A graphical panel with HMA indicator data from all timeframes at the same time . If the HMA switched its direction on any timeframe, the panel displays a question or exclamation mark with a tex

This indicator can be considered as a trading system. It offers a different view to see the currency pair: full timeless indicator, can be used for manual trading or for automatized trading with some expert advisor. When the price reaches a threshold a new block is created according to the set mode. The indicator beside the Renko bars, shows also 3 moving averages.
Features renko mode median renko custom median renko 3 moving averages wicks datetime indicator for each block custom notification
FREE

The market is unfair if only because 10% of participants manage 90% of funds. An ordinary trader has slim changes to stand against these "vultures". This problem can be solved. You just need to be among these 10%, learn to predict their intentions and move with them. Volume is the only preemptive factor that faultlessly works on any timeframe and symbol. First, the volume appears and is accumulated, and only then the price moves. The price moves from one volume to another. Areas of volume accumu

DYJ TRADINGVIEWはマルチインジケーターレーティングシステムであり、レーティングシグナルカウントと分析ツールを使用して、グローバル市場への参入機会を見つけます
DYJ TRADINGVIEWには、市場分析用の10の組み込みインジケーターがあります。
指標ベースの分析は、多くのトレーダーがどの取引を行うか、どこで取引を開始および終了するかを決定するのに役立つために使用されます。
互いに補完し合うことができるいくつかの異なるタイプを使用します。
あなたの市場をフォローするために私たちを使用してください、あなたはより正確な取引を見つけることができます。
格付けに参加しているトレンド指標には、DYJ POWERSIGNAL、ADX、SMA、ボリンジャーバンドが含まれます。
格付けに参加しているオシレーターには、MACD、RSI、ストキャスティクス、アリゲーターが含まれます。
シグナルの数が3以上のときにシグナルを売買する同じ方向を示す3つのインジケーターがある場合、市場取引を開始します。 Input
[GENERAL] ViewName = "

Fractals Dynamic Fractals Dynamic – これで、フラクタルダイナミックインジケーターに基づく、またはそれに基づくすべての取引戦略に追加のシグナルが表示されます。 さらに、フラクタルはサポートレベルと抵抗レベルとして機能することができます。 そして、いくつかの取引戦略では、流動性レベルを示しています。 この目的のために、このバージョンのマルチフラクタルおよびマルチフレームインジケータ MultiFractal Levels でレベルが導入されました。 あなたは、この指標は、より有益な視覚的かつ任意の価格チャート上のあなたの取引のアシスタントとして有用であることがわかります。 あなたの取引システムへの追加として Fractals Dynamic 指標を使用してください
また、市場で私の他の製品を試してみてください https://www.mql5.com/ru/users/capitalplus/seller
インジケーターが気に入った場合は、評価してレビューを残してください。私にとって非常に重要です。
取引で大儲け!
FREE

Volatility Channel Indicator Ride the Waves of Market Volatility with Precision ... please leave a 5 star rating if you love this product The Indicator is free. The source code is available for just 30usd.
Are you tired of entering trades too early or too late? Missing breakouts? Getting caught in false signals? The Volatility Channel Indicator transforms chaotic price action into crystal-clear trading opportunities. What You Get (MT4 & MT5) Smart Channel Bands that
FREE

LinReg (5-Line Regression Channel) — Free Indicator LinReg draws a five-line linear regression channel to visualize trend structure and price deviation. What makes this version different This release is a Market-validation-safe build : Optimized to avoid heavy processing during Strategy Tester multi-symbol validation. Focused on stable performance and clean plotting without slowdowns. Visual structure (5 lines) 2 Blue lines (outer bounds) 1 Red line (regression midline) 2 Purple lines (inner bou
FREE

The Anchored VWAP Indicator for MetaTrader 5 gives you full control over where your VWAP starts. Instead of being locked to session opens or fixed times,
you simply drag the anchor point on the chart , and the VWAP instantly recalculates from that exact bar.
This makes it perfect for analyzing:
• Institutional entry zones
• Breakout origins
• Swing highs/lows
• News reaction points
• Trend continuations Key Features Drag & Drop Anchor Point : Move the starting point directly on the chart. The
FREE

Haven Turtle Channel - 伝説のタートルズ戦略 トレード史上、最も有名なトレンドフォロー戦略の一つをプロ仕様に再現した Haven Turtle Channel をご紹介します。このインジケーターは、リチャード・デニスとウィリアム・エックハートが行った伝説的な「タートルズ(Turtle Traders)」実験のクラシックなルールに基づいています。 他の製品をチェックする -> こちらをクリック 。 このシステムの核心はシンプルかつ強力です。「考えるな、見えているものをトレードせよ」。このインジケーターは、エントリー用のドンチャン・チャネルと、エグジット用(トレーリングストップ)の独立したラインを自動的に描画し、トレンドの利益を最大限に引き出します。 仕組みについて エントリーシグナル(ブレイクアウト) – 価格が過去N日間(デフォルトは20日)の高値または安値を更新したときに発生します。チャート上に実線でチャネル(青と赤)を描画します。これらのラインのブレイクは、新しいトレンドの始まりを意味します。 エグジットシグナル(トレーリングストップ) –
FREE

INDICATOR: GEN Zenith Developer: gedeegi General Description GEN Zenith is a technical indicator designed to automatically identify price reversal patterns (Zenith) based on pivot price detection and delta volume movement. This indicator looks for points where the price forms a swing high or swing low, then detects a breakout from that area to confirm a strong reversal signal. This indicator is highly suitable for reversal and breakout strategies, or as a signal confirmation tool in your tradin
FREE
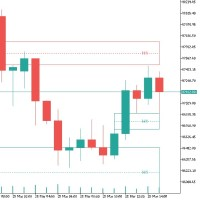
トレーディングにおけるインバランス:基礎と戦略 トレーディングにおけるインバランスとは、市場において需要と供給の間に不均衡が生じている状態を指します。これは、買い注文の過多(強気インバランス)または売り注文の過多(弱気インバランス)として現れ、非効率な価格形成につながり、トレーダーに機会を生み出します。 技術的な側面 「ローソク足パターン」 : インバランスは、多くの場合、3本のローソク足パターンで表されます。2本目のローソク足が他のローソク足よりも長く、動きの方向を決定します。 「ローソク足のヒゲ」 : インバランスの主な基準は、1本目と3本目のローソク足のヒゲが重ならないことです。 インバランスの取引方法 基本戦略 「インバランスの特定」 : 十分な取引量なしに価格が急激に変化したゾーンを探します。 「エントリーポイント」 : リミット注文を使用して、インバランスの部分的または完全な重なり後に取引を開始します。 「リスク管理」 : インバランスゾーンの外側にストップロスを置き、インバランスのサイズの1.5〜2倍で利益を確定します。 戦略の例 「インバランスの部分的または完全な埋め戻
FREE

VR ドンチャン インジケーターは、ドンチャン チャネルの改良版です。改善はチャネルのほぼすべての機能に影響を与えましたが、主要な動作アルゴリズムとチャネル構造は維持されました。現在のトレンドに応じてレベルの色の変化がボールインジケーターに追加されました。これは、トレーダーにトレンドまたはフラットの変化を明確に示します。スマートフォン、電子メール、または MetaTrader ターミナル自体で 2 つのチャネル レベルのうちの 1 つのブレイクアウトについてトレーダーに通知する機能が追加されました。値札が追加されており、これを利用してトレーダーはチャート上の価格レベルを確認できます。古典的なドンチャン指標の操作アルゴリズムは、トレーダーが指標が計算する期間を自分で設定できるという事実により、最適化され高速化されています。古典的な Donchian インジケーターは、MetaTrader ターミナルで利用可能な履歴全体を計算します。これにより、MetaTrader ターミナルに数学的計算の負荷が大きくかかります。 VR Donchian インジケーターは、トレーダーが設定で設定した金額の
FREE

* 主要通貨のデータの信頼性を確保するため、ライブチャートのご利用を推奨いたします。
UEX Pure USD Euro Index とは: 英語での説明: https://www.mql5.com/en/market/product/152936
Pure USD & Euro Indexで、外国為替市場の真の脈動を探りましょう。 — 世界で最も強力な2つの通貨間の隠れた強みと弱みを真に明らかにする革新的なインジケーターです。
EURUSDのような単一の通貨ペアに頼るのではなく、このツールは複数の主要通貨ペアにわたる米ドルとユーロの総合的なパフォーマンスを測定し、 真の市場センチメントを明確かつバランスよく把握します。
このインジケーターは、すべての主要USDおよびEuroペアのデータを組み合わせることで、 真の通貨変動を反映した同期インデックスチャートを構築します。 単一の通貨ペアの変動だけでなく、真の通貨変動を反映します。 ドルが優勢になった時、ユーロが反落した時、即座に通知を受け取り、 市場が反応する数分前に、両者のバランスが変化する局面を洞察できます。 このコンセ

Advanced Fakeout Detection Indicator Professional Liquidity Sweep & Market Structure Analysis for MetaTrader 5 The Advanced Fakeout Detection Indicator is a sophisticated technical analysis tool designed to identify high-probability market reversal opportunities by detecting liquidity sweeps and structural breaks in price action.
What This Indicator Does This indicator automatically identifies and visualizes potential fakeout scenarios where price temporarily breaks through significant level

SMC LIQUIDITY Advanced Institutional-Grade Smart Money and Liquidity Analysis Suite for MT5 SMC LIQUIDITY is a comprehensive institutional toolkit engineered for traders who require precise liquidity mapping, market structure intelligence, smart money concepts, and order flow awareness in a single integrated interface. It is designed for professional workflow, multi-timeframe clarity, and seamless execution in fast-moving conditions. This indicator combines several institutional methodologies in
FREE

I present an indicator that does not require testing, an indicator that immediately shows its capabilities. SVP Zones SM ICT is a professional indicator that transforms the logic of a complex manual strategy into a precise mathematical algorithm. It identifies key accumulation and distribution zones based on an in-depth analysis of market structure, Fibonacci levels, and volume. The indicator's creation draws on years of experience studying how volume influences market structure. It is a compreh

Moving Average Trend Alert is a triple MA indicator that helps traders to identify potential market trends based on 3 MAs alignment and crossover.
Moving Average Trend Alert features: Customizable short-term, medium-term, and long-term MAs. Option to filter signals based on a minimum distance between moving averages to avoid premature MAs alignment. Optional Filter of signals with RSI indicator overbought/oversold levels. Optional Filter of signals with ADX indicator. Popup, email, and phone no
FREE

THIS IS OUR BOOM 1000 SIGNAL TOOL YOU CAN USE IT ON M1 IT GIVE TWO TYPES OF SIGNAL SIGNAL BUY NOW SIGNAL SL 7 CANDELS ARE THE MOST SNIPER TRADES HAVE SL 7 CANDELS USE IT ALONG WITH 175 EMA ON BOOM 1000 INDEX ITS FOR BUY SIGNALS ON BOOM 1000 INDEX ONLY FOR A FULL VERSION OF ALL PAIRS YOU MAY CHEACK THIS SPIKE KILLER VERSION OR CHEACK OUR SPIKE BLAST PRO VERSION OR TRY OUR BEST SPIKE KILLER FOR ALL PAIRS FOR MORE TOOLS VISIT THIS PAGE HERE

Half Trend TPSL Buy Sell Indicator calculates the open and close of the price bars over the selected period of time and applies its own calculation method to find an average line of the price movement. ATR based Take Profit and Stop Loss ATR is a measure of volatility over a specified period of time. The most common length is 14, which is also a common length for oscillators, such as the relative strength index (RSI) and stochastics. A higher ATR indicates a more volatile market, while a lowe

This is actually just a combination of 3 classic TTM_Squeeze indicators, nothing special. As I know exactly this is implemented in original TTM_Squeeze PRO indicator. It shows strong, middle and weak squeeze. If someone interested, TTM_Squeeze is not completely John Carter's invention. Concept of squeeze is commonly known as well as the method of squeeze search using Bollinger Bands and Kelthner Channels. How to use
As always there is a lot of variations. For example here is simple strategy Use

Volume Delta Candles offer a straightforward way to analyze trading activity within each candle, making it easier to see what's happening without needing an extra volume indicator. This tool uses lower timeframe or real-time data to show the percentage of buying and selling volume within a candle as a colored bar. Make sure you understand Volume and Volume Delta before jumping in. If you’re not sure, reach out to me first for a quick rundown. But if you're already familiar, you're good to go! Ke

Trendline Alert Pro is a MetaTrader 5 indicator that monitors the objects that you created such as trendlines, horizontal lines, rectangles, Fibonacci levels, and instantly alerts you when price interacts with them.
MT4 version is here PM me to receive a 7-day trial version of the product.
Multi-Object Monitoring Trendlines, channels, and angled lines Horizontal & vertical lines Rectangles (support/resistance zones) Fibonacci retracements & expansions (customizable levels) Flexible Alert Opt

ADVANCED MARKET ANALYSIS INDICATOR Overview of the Indicator
This is not a simple indicator — it’s a multi-analysis predictive system. It combines:
Volume Profile (POC, VAH, VAL)
Fibonacci Extensions
Pivot Levels (Daily, Weekly, 4H)
Trend Determination (MA-based)
Smart Money Concepts & Pattern Detection (basic placeholders for expansion)
Prediction Engine (projects price forward for 1 hour)
It gives you:
Target Price Line (projection)
Stop Loss Line (usually at Volume POC)
FREE

The Mirror Chart MT5 is a overlay indicator specifically designed to project a second financial instrument directly onto the main chart window. This tool is invaluable for traders who rely on correlation analysis, as it visualizes the price movements of two different instruments in real time. Unlike traditional overlays, this indicator utilizes intelligent, dynamic centering and scaling logic. It continuously analyzes the visible price range in the current window for both symbols and calculates
FREE

Candle Timer Indicator is a custom tool designed for the MetaTrader 5 (MQL5) trading platform. Its primary purpose is to display a moving timer on the chart, indicating the remaining time before the current candle closes. This feature is particularly useful for traders who need precise tracking of candle closing times for their technical analysis strategies. My indicators for free. I onl
FREE
My other indicators: https://www.mql5.com/en/market/product/156702 https://www.mql5.com/en/market/product/153968 (FREE) https://www.mql5.com/en/market/product/153960 (FREE)
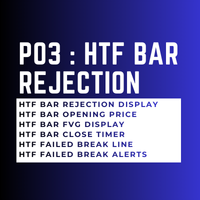
This indicator displays higher timeframe candles directly on your lower timeframe chart. It allows you to monitor higher timeframe price action without switching between charts. What This Indicator Does: The indicator places candles from a selected higher timeframe (such as H4, Daily, or Weekly) onto your current chart. This
FREE

Finding Divergence RSI is a professional MetaTrader 5 indicator designed for automatic detection and visualization of classic and hidden divergences using the RSI indicator. The indicator works directly on the price chart, displaying arrows at divergence points and optionally drawing trend lines on both price and RSI charts. Divergence Types 1. Classic Divergences Classic Bullish : Price forms Lower Low (LL), RSI forms Higher Low (HL)
Signal: Trend reversal to upside Classic Bearish : Price fo
FREE

Simple and intuitive tool for visual trend filtering based on a moving average. The indicator displays a single line on the chart but changes its color depending on the price's position relative to this line, helping you quickly determine the prevailing market direction. How It Works
The indicator calculates a moving average (default EMA 50) on the selected timeframe. It then analyzes the relationship between the candle's closing price and the line's value: If the close price is above the lin
FREE

Sniper Delta Imbalance is a professional tool for deep delta analysis — the difference between buyer and seller volumes. It takes volume analysis to the next level, allowing traders to see in real time who controls the price — buyers or sellers — and to find precise entry points based on the actions of major market participants. This tool represents a unique style of analysis based on the ratio of demand and supply volumes and can be used to detect who holds control over price. At the core of

WickSniper Pro – Precision Reversal Indicator for Smart Traders ===============================================================
WickSniper Pro is a powerful **non-repainting** price action indicator that detects **inside bar breakout reversals** with sniper-like accuracy. Whether you're a scalper, swing trader, or day trader, WickSniper Pro helps you catch high-probability turning points in the market using clean, intuitive signals.
Key Features ------------ - Non-Repainting – Once a signa
FREE

Necessary for traders: tools and indicators Waves automatically calculate indicators, channel trend trading Perfect trend-wave automatic calculation channel calculation , MT4 Perfect trend-wave automatic calculation channel calculation , MT5 Local Trading copying Easy And Fast Copy , MT4 Easy And Fast Copy , MT5 Local Trading copying For DEMO Easy And Fast Copy , MT4 DEMO Easy And Fast Copy , MT5 DEMO 高度なボリンジャーバンド:
1.ボリンジャーレールは方向によって色が変わります」
2.ボリンジャーアウターレールの伸縮はアウターレールの色の変化でマークされます。」 3.ボリンジャーミ
FREE

The Penta-O is a 6-point retracement harmonacci pattern which usually precedes big market movements. Penta-O patterns can expand and repaint quite a bit. To make things easier this indicator implements a twist: it waits for a donchian breakout in the right direction before signaling the trade. The end result is an otherwise repainting indicator with a very reliable trading signal. The donchian breakout period is entered as an input. [ Installation Guide | Update Guide | Troubleshooting | FAQ | A
FREE

Stargogs Spike Catcher V4.0 This Indicator is Developed To milk the BOOM and CRASH indices .
Now Also work on weltrade for PAIN and GAIN indices. Send me Message if you need any help with the indicator. CHECK OUT THE STARGOGS SPIKE CATCHER EA/ROBOT V3: CLICK HERE ALSO CHECK OUT SECOND TO NONEFX SPIKE CATCHER: CLICK HERE STARGOGS SPIKE CATCHER V4.0 WHATS NEW! Brand New Strategy. This is the Indicator you need for 2025. New Trend Filter to minimize losses and maximize profits. New Trendline th

Syntetic TRIX Normalized is a technical momentum oscillator designed to filter out price noise and identify high-probability trend reversals. By applying triple exponential smoothing to market data, this indicator provides a clear, normalized view of market momentum on a fixed -100 to +100 scale . The indicator uses a dual-stage confirmation system: it first identifies potential market exhaustion (TRIX Extreme) and then validates entries through a dynamic price-to-EMA crossover. This logic
FREE

Very powerful indicator! converted from TradingView with upgraded alerts and added notifications. Ideal use in EAs.
Use as a supplementary Indicator to confirm your entries, but it is as good on it's own.
The indicator consists of 3 different Trend Meters and a 2 Trend Bars which are used to confirm trend
How to Use:
The more Trend meters are lit up the better =>>
-more GREEN COLOR at one bar means more confirmation to open buy trade,
- more RED COLOR signals for one bar = more confirmat

Session Breakout Master is a high-performance trading tool designed to capture explosive moves following the breakout of major trading session ranges (Asia, Europe, and USA). It automatically visualizes volatility zones and utilizes a Moving Average filter to ensure you stay on the right side of the market trend. Key Features: Automated Session Mapping: No more manual drawing. The indicator identifies and plots Asia, Europe, and USA session boxes automatically. Trend Filtering: Built-in MA filte
FREE

TREND FLOW PRO TREND FLOW PRO は、市場の方向を表示するリペイントなしのインジケーターです。トレンドの反転だけでなく、大口市場参加者の初回および再エントリーを特定します。チャート上の BOS マークは、実際のトレンド転換と上位タイムフレームの重要なレベルを示します。データはリペイントされず、各バーの確定後もチャート上に残ります。 戦略例を含む詳細な PDF ガイド は、プライベートメッセージでリクエストして受け取ることができます。 インジケーターの主な要素: BOS FLOW ― トレンド波動と実際のトレンド転換。これは大口参加者のエントリーと、その存在の確認を示します(数字で表示)。 BOS FILL ― トレンド方向にローソク足を着色します。大口プレイヤーのエントリーポイントや、トレンドが変化するポイントを示します。 シグナルレベル: BOS ― 強さが未確定な参加者のエントリー(多くの場合、メイントレンド内の調整)。 Move SL ― 大口参加者がポジションをどのように移動させているかを視覚的に表示します。トレーダーはストップロス調整の参考として使用

Buy Sell Signal Low TF gives buy/sell signals and alerts with up and down arrow at potential reversal of a pullback or a trend continuation pattern in low timeframe. This is an indicator which gives signals based on trend => It works best in trend market with the principle is to ride on the trend not trade against the trend.
The components of Buy Sell Signal Low TF: - The trend is determined by SMMA 13 , SMMA 21 and SMMA 35 ( can be changed manually to suit your preference). - The signal is b
FREE
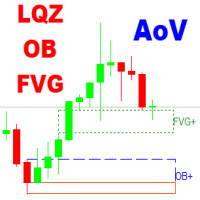
The Area of Value Detection indicator automatically identifies and highlights key institutional price zones, including Liquidity areas, Order Blocks, and Fair Value Gaps (FVG). It is designed to help traders visualize market imbalances and potential points of interest (POIs) used by smart money participants.
Main Features Liquidity Zones: Detects clusters of equal highs/lows and liquidity pools where stop orders are likely accumulated.
Order Blocks: Highlights potential bullish and bearish or
The Interactive RSI indicator can generate RSI divergence with the availability of user defined filters. It can generate voice alerts for RSI oversold and RSI Overbought situations. Moreover it can also generate voice alerts for RSI Divergneces as well as when price breaks above or breaks below the support and resistances created upon divergence ouccurence. The voice alerts are generated in a way that you will know which market has reached the oversold and overbought conditions as well as the r
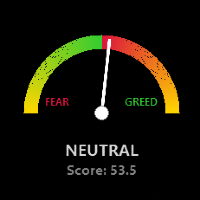
Global Market Risk Sentiment Meter 1. Abstraction The Global Market Risk Sentiment Meter is a sophisticated analytical tool designed for the MetaTrader 5 (MQL5) platform. Unlike traditional indicators that analyze a single asset in isolation, this utility employs an Inter-Market Analysis approach to reconstruct the psychological state of the global financial markets. By aggregating real-time data from US Indices, Global Equities, Cryptocurrencies, and Safe Haven assets (Gold and the US
FREE
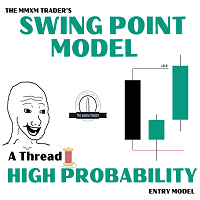
Introducing the Swing Point Model Indicator – A Professional Trading Tool The Swing Point Model Indicator is an innovative tool designed for traders who want to capture market structure and identify potential trading opportunities. With a logical and transparent approach, the Swing Point Model helps you gain deeper market insights and make precise trading decisions. This is multiple Timeframe indicator so you can choose Higher timeframe for detect Swing point model What Is the Swing Point Model?

市場内で開発傾向にアラートを取得するには、この指標を使用してください。
この指標を使用すると、彼らが開発するように、市場で発展している傾向についてのアラートを取得することができるようになります。 この指標は、トレンド内のエントリまたは終了を識別するために使用できます。 この指標は、より高い時間枠からの情報と、現在の時間枠の価格の動きを組み合わせて、買いまたは売りの信号を出力します。 指標は、傾向の変化、または支配的な傾向の継続を識別することができます。
注:トレンドフォローは低い勝率を持っていますが、トレンドのリターンは平均損失の3-5倍の大きさにすることができます。 簡単なセットアップ 任意の時間枠で、任意のグラフにドラッグアンドドロップします。 アラートを有効にする(オプション) そして、あなたは完了です! 視覚的および音声的な警告 お使いの携帯電話に直接送信されるアラート お使いの端末に送信されたアラートをポップアッ マルチユース 株,外国為替,オプション,先物 柔軟性 任意の時間枠で動作します
FREE

SMART SD ARROW INDICATOR
Trade Smarter, Not Harder: The Smart SD Arrow Indicator That Paints Clear Buy & Sell Signals Right On Your Chart!
Finally, an All-in-One Supply & Demand Tool That Doesn’t Just Draw Zones—It Gives You Precise, Actionable Entry Arrows. Stop Analyzing, Start Executing.
Dear Trader,
Let's be honest. You've tried indicators that draw complicated zones all over your chart. They look smart, but when it's time to pull the trigger, you're left with the same old question:
FREE

Indicator Description
This indicator draws red-border rectangles during specific daily ICT Kill Zones (EST): 3:00 – 4:00 AM EST 10:00 – 11:00 AM EST 2:00 – 3:00 PM EST During each active time window, the indicator automatically creates rectangles and highlights Fair Value Gaps (FVGs) formed shortly before and during the selected Kill Zones, including recent prior FVGs for additional confluence. The Kill Zones are designed according to ICT (Inner Circle Trader) concepts and can be used as a c
FREE
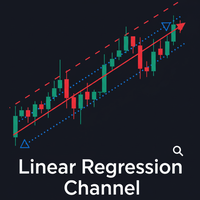
The Linear Regression Channel is a powerful technical analysis tool that helps visually identify the prevailing trend and potential price zones. Essentially, the indicator performs two main functions: It draws a trendline through the center of price action over a specified period. This line is calculated using the linear regression method, which results in the best possible "line of best fit" for the price data. From this center line, the indicator plots two parallel lines above and below, creat
FREE

The Breakout Finder (BF) is a technical analysis indicator designed for MetaTrader 5 (MT5) platforms. It identifies potential breakout and breakdown patterns in price action by analyzing pivot highs and lows over a specified period. The indicator detects "cup" formations—clusters of pivot points within a narrow price channel—indicating areas of consolidation that may lead to strong directional moves when broken. EA: BlackHole Breakout EA https://www.mql5.com/en/market/product/149206
Key Featur
FREE

BeST_Oscillators Collection is a Composite MT5 Indicato r including the Chaikin , Chande and TRIX Oscillators from which by default Chaikin and TRIX Oscillators but not Chande Momentum Oscillator are contained in MT5 platform. It also provides for each Oscillator the option of displaying or not a Mov. Average as a Signal Line and the resulting Signals as Arrows in a Normal (all arrows) or in a Reverse Mode (without showing up any resulting successive and of same type arrows).
Analytically fo
FREE

特徴
価格別の取引量を確認するためのインジケーターです。 主にEURUSDに適用され、他の通貨ペアでは機能しないか、計算に時間がかかる可能性があります。 スムーズな使用のために、「チャートの右端からチャート境界をシフトする」オプションをオンにします(スクリーンショットに表示されています)。 新しいバーが表示されると、データがリセットされます。
変数 COlOR: インジケーターの色の設定 WIDTH: インジケーターの幅の設定 PERIOD: データを計算するための期間の設定
---------------------------------------------------------------------------------------------------------------------------------------------------------------------------
FREE

MarketTime - プロフェッショナル・マルチタイムゾーンクロック&セッションインジケーター 取引セッションを二度と逃さない - グローバル市場時間をリアルタイムでモニター MarketTimeは、MetaTrader 5チャート上に複数のタイムゾーン、ライブセッションカウントダウン、ビジュアル取引セッションゾーンを直接表示するプロフェッショナルグレードのインジケーターです。FX取引において、タイミングがすべてです - 主要金融センターがいつアクティブか、セッションがいつ重複するかを知ることは、取引の成功に大きく影響します。 この包括的なツールは、複数のブラウザタブや外部アプリケーションの必要性を排除します。グローバル市場時間をモニターするために必要なすべてがチャート上にあり、リアルタイムで更新され、作業スペースを乱雑にしないクリーンでカスタマイズ可能なインターフェースを備えています。 詳細はこちら: 完全なドキュメントと設定ガイド (English) 期間限定オファー: 最初の50ダウンロードは無料です!その後、この製品は有料になります。今すぐダウンロードして無料コピーを確保し
FREE

The most important price level in any "Volume profile" is the "Point of Control" . This is the price level with the highest trading volume. It is primarily the level where large players initiate their positions, making it the accumulation/distribution level for the "Smart money" .
The idea of the indicator arose after the "MR Volume Profile Rectangles" indicator was made. When creating the "MR Volume Profile Rectangles" indicator, we spent a lot of time comparing the volumes with those from the

One of the good and important features in MT4 is the availability of the iExposure indicator. With the iExposure indicator, traders can see a comparison of ongoing open positions and how much funds have been used, and more importantly what is the average value of these open positions.
Unfortunately this indicator is not available on MT5.
This indicator is iExposure MT4 which I rewrote using the MT5 programming language. This indicator can be used like iExposure on MT4 with the same functions.
FREE

RoundNumbers indicator is a simple and powerful psychological price levels. Trader usually use these levels as a Support and Resistance (SnR). Indicator Input: Levels - Numbers of levels drawn on chart. Default 30 levels. BoxSize - Box size drawn on each levels, indicate buffers around levels. Default value 1pips (10point) above and below each levels. ZoneSize - Distance between each levels, default value 10pips (100point). Style & Colours - User inputs customization. For MT4 version, p
FREE

** NOTE: This indicator uses realtime data. Thus DO NOT download Demo version. If you still need demo version, please refer to trial version . Version for MT4: https://www.mql5.com/en/market/product/123597
Symbol Chart Changer is an indicator/utility that offers you the option to switch between symbols and timeframes.
You can choose any symbol and timeframe on the same chart with just a few clicks. In addition, this indicator also shows the profit of the symbol through the color of the butt

Half-Trend Indicator for MetaTrader5
To download all of our products, you can click this link: LINK
Introduction The Half-Trend Indicator is one of the leading indicators in the market, which helps you enter your trades through the high, low, moving average and ATR.
Specifications platform metatrader5 (MT5) type custom technical trading indicator level beginner timeframes all timeframes from weekly to trading styles scalping - day trading - swing trading - position trading markets forex - cr
MetaTraderマーケットが取引戦略とテクニカル指標を販売するための最適な場所である理由をご存じですか?宣伝もソフトウェア保護も必要なく、支払いのトラブルもないことです。これらはすべて、MetaTraderマーケットで提供されます。
取引の機会を逃しています。
- 無料取引アプリ
- 8千を超えるシグナルをコピー
- 金融ニュースで金融マーケットを探索
新規登録
ログイン