Indicadores técnicos para MetaTrader 5 - 12
Indicador Engulfing Period V75Killed: ¡Revoluciona tu estrategia de trading!
(Este indicador es PRIVADO y está exclusivamente dirigido a traders que conocen su propósito y valor específicos). El Indicador Engulfing Period V75Killed es un cambio de juego para los traders que buscan identificar fácilmente períodos clave de envolvimiento en múltiples marcos temporales. Al marcar zonas de envolvimiento directamente en tu gráfico, este indicador te ahorra tiempo y mejora tu capacidad para aprovechar
FREE

El autor original es David Weis, experto en el Método Wyckoff. La Onda Weis es una adaptación moderna del Método Wyckoff de 1930, otro experto en técnicas de Lectura de Cintas y Análisis de Gráficos. Las Ondas de Weis toman el volumen del mercado y lo apilan en ondas de acuerdo a las condiciones del precio dando al trader valiosa información sobre las condiciones del mercado. Si quieres aprender más sobre este tema puedes encontrar toneladas de vídeos en YouTube. Sólo tiene que buscar "The Wicko
FREE

Indicador Heiken Ashi MT5 Mejore su análisis técnico con el indicador Heiken Ashi MT5. Esta poderosa herramienta transforma los datos de precios estándar en velas más suaves y orientadas a la tendencia, facilitando la identificación de tendencias del mercado y posibles puntos de inversión. Características principales: Identificación clara de tendencias: Distinga visualmente entre tendencias alcistas y bajistas con diferentes colores de velas. Reducción del ruido: Filtre las fluctuaciones de pre
FREE

WickSniper Pro - Indicador de Reversión de Precisión para Operadores Inteligentes ===============================================================
WickSniper Pro es un poderoso indicador de acción de precios **sin repintado** que detecta **inversiones de ruptura dentro de la barra** con precisión de francotirador. Si usted es un scalper, swing trader, o day trader, WickSniper Pro le ayuda a capturar puntos de inflexión de alta probabilidad en el mercado utilizando señales limpias e intuitivas.
FREE

CandleTimeAndSpreadLine - Tiempo de la vela y Spread en tiempo real CandleTimeAndSpreadLine es un indicador que muestra dos informaciones esenciales directamente en el gráfico:
(1) el tiempo restante en la vela actual y
(2) el spread en puntos, ambos anclados al precio de referencia elegido (Ask, Bid o Mid). Utiliza la actualización OnTimer , asegurando que el tiempo sigue fluyendo incluso en momentos de baja actividad del mercado.
Los valores se muestran en etiquetas superpuestas al gráfico, s
FREE

DESCRIPCIÓN
ICSM (Impulse-Correction SCOB Mapper) es el indicador que analiza el movimiento del precio e identifica impulsos válidos, correcciones y SCOBs (Single Candle Order Block). Es una herramienta poderosa que se puede utilizar con cualquier tipo de análisis técnico porque es flexible, informativa, fácil de usar y mejora sustancialmente la conciencia del trader sobre las zonas de interés más líquidas.
CONFIGURACIÓN
General | Visuales
Tema de color — define el tema de color del ICSM.
Gold Position Box Signals Pro v3.1 – Indicador Técnico Multitemporal para XAUUSD
Descripción General Gold Position Box Signals Pro v3.1 es un indicador personalizado para MetaTrader 5 diseñado para el comercio de XAUUSD. Combina cruces de medias móviles, niveles de stop loss/take profit basados en volatilidad, visualización de posiciones y análisis de tendencias multitemporales. La herramienta ayuda a los traders a identificar posibles entradas y gestionar operaciones con una visualización cla

Analizador de Ondas de Elliot calcula las Ondas de Elliot para ayudar a identificar la dirección de la tendencia y los niveles de entrada. Principalmente para estrategias de Swing Trading. Usualmente uno abriría una Posición en la dirección de la tendencia para la Onda 3 o una Corrección para la Onda C . Este indicador traza los niveles objetivo para la onda actual y la siguiente. Las reglas más importantes para el análisis de la onda de Elliot son verificadas por el indicador. Esta versión grat
FREE

Este indicador calcula los precios de soporte y resistencia en multi-timeframe con diferente formulación y dibujarlos en el gráfico que el estilo que usted elija. Y si lo desea, el indicador puede alertarle cuando el precio actual llegue a estos niveles de pivote. Formulaciones: Clásico, Camarilla, Woodie, Demark, Piso, Fibonacci
Opciones de Alerta: Enviar Mensaje Móvil, Enviar E-mail, Mostrar Mensaje, Alerta Sonora
Niveles: PP, S1, S2, S3, S4, S5, R1, R2, R3, R4, R5, TC, BC y Puntos Medios Por
FREE

Combinación de los indicadores Ichimoku y Super Trend. 1. ARC (Rango Medio Veces Constante) El concepto de ARC o Sistema de Volatilidad fue introducido por Welles Wilder Jr. en su libro de 1978, New Concepts in Technical Trading Systems . Desde entonces ha sido adaptado y modificado en el popular indicador Super Trend .
La idea fundamental del ARC es sencilla: para identificar los niveles de soporte y resistencia, se multiplica una constante por el Average True Range (ATR) . A continuación, se
FREE

Volume Profile Trading System NO es sólo otro indicador de volumen. Es un completo ecosistema de negociación que combina la visualización profesional del perfil de volumen con una estrategia de negociación automatizada inteligente. Mientras que otros indicadores le muestran DÓNDE se concentra el volumen , Volume Profile Trading System le muestra DÓNDE , CUÁNDO y CÓMO negociarlo , mostrando la distribución real del volumen por precio en lugar de por tiempo. Ayuda a los operadores a identificar co
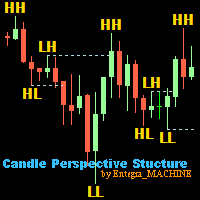
Candle Perspective Structure Indicator MT5 es un indicador sencillo que define y muestra la estructura de velas del mercado. Este indicador se adaptará tanto a los operadores experimentados como a los principiantes que tienen dificultades para seguir la estructura visualmente.
Si desea ver más productos de alta calidad o encargar el desarrollo/conversión de sus propios productos, visite el sitio web de mis socios: 4xDev
Obtenga un 10% de DESCUENTO en servicios de automatización de estrategias
FREE
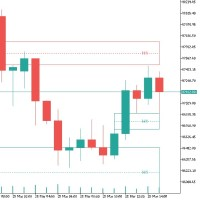
Desequilibrio en el Trading: Fundamentos y Estrategias El desequilibrio en el trading es un fenómeno donde existe una disparidad entre la oferta y la demanda en el mercado. Esto puede manifestarse como un exceso de órdenes de compra (desequilibrio alcista) o de venta (desequilibrio bajista), lo que lleva a una ineficiencia en el precio y crea oportunidades para los traders. Aspectos Técnicos "Patrón de Velas" : El desequilibrio se representa a menudo por un patrón de tres velas, donde la segunda
FREE

Visión general El indicador TTM Squeeze ayuda a identificar los periodos de baja volatilidad (squeeze) que a menudo preceden a las rupturas de precios. Utiliza las Bandas de Bollinger (BB) y los Canales de Keltner (KC) para determinar cuándo el mercado está "enrollándose" y listo para moverse. Guía de configuración Configuración de la volatilidad El indicador utiliza las Bandas de Bollinger para medir la volatilidad del mercado. Cuando las BBs están dentro de los Canales Keltner, se detecta un s
FREE

Indicador CandlePatternProUltimate para MetaTrader 5 Descripción General El indicador CandlePatternProUltimate es una herramienta avanzada para detectar patrones de velas japonesas en gráficos de la plataforma MetaTrader 5. Presenta una interfaz artística atractiva y detecta más de 150 patrones diferentes con análisis inteligente basado en IA. Características Principales Diseño Artístico Colores Personalizables : Paleta de colores artística completamente personalizable Efectos Vi
FREE

PO3 FIBONACCI GOLDBACH - El Indicador Definitivo para el Análisis de Mercado
¡Desvela los Secretos del Mercado con la Fusión Perfecta entre Matemáticas Avanzadas y Trading Inteligente!
---
FUNCIONALIDADES EXCLUSIVAS:
1. SISTEMA DE NIVELES GOLDBACH ÚNICO · Identificación automática de Order Blocks (OB), Fair Value Gaps (FVG - Huecos de Valor Justo), Liquidity Voids (LV - Vacíos de Liquidez) y Mitigation Blocks (MB - Bloques de Mitigación). · Cálculo preciso de niveles de rechazo (
El indicador Trend Duration Forecast MT5 está diseñado para estimar la duración probable de una tendencia alcista o bajista. Utilizando una Media Móvil Hull (HMA) para detectar cambios direccionales, rastrea la duración de cada tendencia histórica y calcula un promedio para pronosticar cuánto tiempo es estadísticamente probable que continúe la tendencia actual. Esto permite a los operadores visualizar tanto la fuerza de la tendencia en tiempo real como las posibles zonas de agotamiento con una

Mejore la precisión de sus operaciones con el indicador WH Trading Sessions MT5 para MetaTrader 5. Esta potente herramienta le ayuda a visualizar y gestionar fácilmente las sesiones clave del mercado. Basado en: Indicador WH SMC MT5
Versión MT4: Sesiones de trading WH MT4
Características principales: Panel GUI interactivo : seleccione y alterne fácilmente entre las sesiones comerciales de Asia, Londres y Nueva York .
Alertas y configuraciones personalizables : adapte el i
FREE

Versión para Metatrader 5 del famoso indicador Tabajara de Andre Machado. Si no conoces el trabajo de Análisis Técnico de Andre Machado no necesitas este indicador... Para aquellos que lo necesiten y para aquellos traders amigos que pidieron esta portabilidad desde otras plataformas, aquí está...
CARACTERÍSTICAS
Media Móvil de 8 periodos Media Móvil de 20 periodos Media móvil de 50 periodos Media móvil de 200 periodos Velas coloreadas según la inflexión de la MA de 20 periodos
AJUSTES Puede ca
FREE
AlgoRhythm ZLSMA - La solución definitiva para operar con tendencias Desbloquee el poder del trading de precisión con AlgoRhythm ZLSMA , un indicador técnico avanzado diseñado para ofrecer señales de tendencia de gran nitidez. Diseñado para MetaTrader 5, este vanguardista Zero Lag Smoothed Moving Average (ZLSMA) combina sofisticadas técnicas de suavizado, análisis multi-marco de tiempo, y bandas dinámicas para dar a los operadores una ventaja competitiva en cualquier mercado. Si usted es un scal
FREE

Desarrollo de la versión previa del indicador ZigZag WaveSize MT4 ZigZag WaveSize - indicador ZigZag estándar modificado con información añadida sobre la longitud de onda en puntos, niveles, y diferentes lógicas de alertas
Mejoras generales: Adaptación del código para MetaTrader 5 Optimizada la operación con objetos gráficos Novedades: Niveles horizontales en los extremos Selección del tipo de niveles: horizontal/rayos/segmentos Filtro de niveles líquidos (no rotos por el precio) Buffer para r
FREE

El indicador Punto Pivote calcula y muestra automáticamente la línea del punto pivote y los niveles de soporte y resistencia. El pivote puede calcularse según la fórmula Clásica, Suelo, Fibonacci, Woodie, Camarilla o DeMark. También es posible seleccionar el periodo de cálculo del indicador. El operador puede elegir entre periodos diarios, semanales, mensuales o definidos por el usuario.
Tipos de pivotes Clásico Suelo Fibonacci Woodie Camarilla DeMark
Características principales El indicador
FREE

El indicador ATR Exit utiliza el cierre de la vela + el valor del ATR para trazar líneas de trailing stop (naranja bajo las compras, magenta sobre las ventas) que avanzan con la tendencia hasta que ésta cambia de dirección. Utiliza un múltiplo del Average True Range (ATR), restando su valor del cierre en la compra y sumando su valor al cierre en la venta. Además, las líneas de trailing stop se generan para apoyar la dirección de la tendencia de la orden (larga o corta): En una tendencia alcista
FREE

Este indicador traza una línea basada en la regresión lineal; esta línea es dinámica y se actualiza cada tick. El cálculo de la regresión lineal se realiza teniendo en cuenta el número de velas definido por el tamaño de la ventana facilitada por el usuario. Se dibujan dos líneas, una superior y otra inferior, para guiar la estrategia del usuario; la distancia de estas líneas con respecto a la línea central debe configurarse. Se pueden definir los estilos, colores y grosores de cada una de las lí
FREE

Interactive AVWAP Pro - Análisis de estilo TradingView Interactive AVWAP Pro es el indicador de precio medio ponderado por volumen anclado (AVWAP) más cómodo para MetaTrader 5/4. Olvídese de las herramientas estándar y torpes. Hemos traído la funcionalidad intuitiva de arrastrar y soltar de TradingView directamente a su terminal MT5/4. La ventaja de una herramienta profesional Deje de saturar los gráficos con líneas verticales y de juguetear con ajustes incómodos. Interactive AVWAP Pro le

TRUE SPIKES DERIV telegram channel for more information and other products: https://t.me/automated_TLabs
DM: https: //t.me/gg4rex
Sistema Profesional de Detección de Picos de Tendencia y Seguimiento del Rendimiento de los Índices de Boom y Crash Descargue aquí el manual de usuario del producto: ¿QUÉ ES TRUE SPIKES? True Spikes es un indicador de seguimiento de tendencias de ingeniería de precisión diseñado específicamente para capturar movimientos explosivos de picos en índices sintéticos
FREE

Multi Timeframe Chart in Seconds es un indicador que permite visualizar datos de precio de marcos de tiempo personalizados directamente en un solo gráfico. Soporta cálculos en segundos, minutos y horas y muestra la acción del precio como velas de colores . Agrega datos de marcos de tiempo no estándar o superiores/inferiores y los representa con precisión, evitando abrir múltiples gráficos.
Para quién es Diseñado para traders que analizan la estructura del mercado en segundos, minutos u horas y
FREE
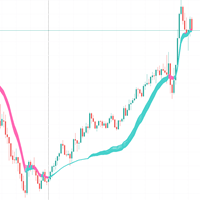
Entendiendo el Indicador RSI Adaptativo EMA Este código implementa un indicador de trading personalizado llamado "RSI Adaptive EMA" para plataformas MetaTrader. Es un enfoque fascinante que combina RSI (Relative Strength Index) con una Media Móvil Exponencial (EMA) de una manera que hace que la EMA se adapte en función de las condiciones del mercado.
Concepto básico Las EMA tradicionales utilizan un factor de suavizado fijo (alfa), pero este indicador crea un factor de suavizado dinámico que ca
FREE
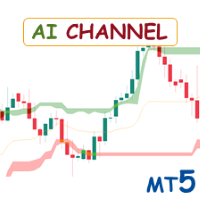
Special offer : ALL TOOLS , just $35 each! New tools will be $30 for the first week or the first 3 purchases ! Trading Tools Channel on MQL5 : Join my MQL5 channel to update the latest news from me El indicador AI Channels utiliza el clúster K-means deslizante , una poderosa técnica de aprendizaje automático en el análisis de clústeres, para ofrecer información en tiempo real sobre las tendencias de precios subyacentes. Este indicador crea canales adaptativos basados en datos de pr
FREE

Local Time Scale Overlay es un indicador técnico para MetaTrader 5 que mejora la legibilidad del gráfico mediante la superposición de una escala de tiempo local en el gráfico de negociación. Calcula la diferencia entre la hora de su sistema local y la hora del servidor y utiliza esta diferencia para mostrar etiquetas de tiempo que reflejan su hora local a intervalos predefinidos. El intervalo de tiempo se puede personalizar mediante un menú desplegable con opciones como 5, 10, 15, 20, 30, 60, 12
FREE

Se trata de un indicador de volumen convencional, que muestra los ticks o el volumen real (si está disponible en su broker). Pero tiene otras características como 5 esquemas de color: único, cuando cruza con media móvil, cuando cruza un nivel específico, cuando tiene diferente volumen entre barras y cuando la vela cambia de color. Puede tener una media móvil personalizable. Poder tener una línea indicadora de valor. Muchas gracias a Diego Silvestrin por las ideas para la versión 1.1 y a Konstant
FREE
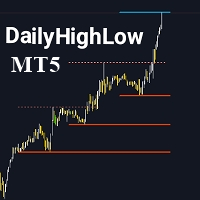
Por favor, no olvides calificar el indicador para ayudarme con la visibilidad. El indicador DailyHighLow está diseñado específicamente para la plataforma MetaTrader 5 (MT5) y tiene como objetivo ayudar a los traders a seguir las fluctuaciones diarias de precios. Este indicador traza automáticamente líneas de tendencia basadas en los precios más altos y más bajos de un período personalizado, proporcionando una asistencia visual clara para los traders que necesitan información precisa del mercado.
FREE

Escáner de Panel Integrado – Su Centro de Mando del Mercado (v2.0) Descripción Corta: Deje de perder el tiempo cambiando manualmente entre docenas de gráficos. El Escáner de Panel Integrado es un potente escáner multi-símbolo y multi-temporalidad que vigila cada instrumento que seleccione desde un único panel. Tras una importante revisión de su arquitectura, la versión 2.0 es más rápida, más estable y más potente que nunca. Reciba alertas visuales instantáneas de patrones de precios, div

EmasFijas Indicador de EMAs Multi-Temporalidad para MetaTrader 5 Descripción del Producto EmasFijas muestra EMAs (Medias Móviles Exponenciales) de cualquier temporalidad en tu gráfico actual. Perfecto para análisis multi-temporalidad sin necesidad de cambiar de gráfico. Incluye un panel visual intuitivo con menú desplegable para seleccionar rápidamente cualquiera de las 21 temporalidades disponibles en MT5. Este indicador es ideal para traders que desean ver la tendencia de temporalidades super
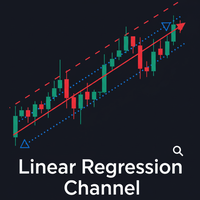
El Canal de Regresión Lineal es una potente herramienta de análisis técnico que ayuda a identificar visualmente la tendencia predominante y las posibles zonas de precios. Esencialmente, el indicador realiza dos funciones principales: Traza una línea de tendencia a través del centro de la acción de los precios durante un período especificado. Esta línea se calcula utilizando el método de regresión lineal, que da como resultado la mejor "línea de mejor ajuste" posible para los datos de precios. A
FREE
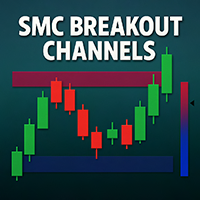
Canales de ruptura SMC Anticipe las rupturas del mercado con precisión.
SMC Breakout Channels detecta automáticamente los rangos de acumulación y distribución en los que los operadores profesionales ("dinero inteligente") son más activos. Al combinar la detección de rangos basada en la volatilidad con el análisis de volumen en tiempo real, esta herramienta destaca las zonas clave de ruptura que suelen preceder a los movimientos direccionales fuertes. Ventajas Claridad: Sin desorden, solo cuadr
FREE
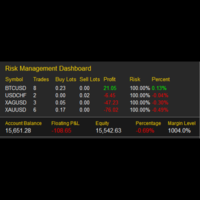
Mi gestión de riesgos El panel de gestión de riesgos es una herramienta visual diseñada para ayudar a los operadores a controlar la exposición al riesgo en tiempo real. Con un diseño claro y compacto, proporciona una visión instantánea de la actividad de negociación, lo que permite una toma de decisiones más disciplinada e informada. Características principales Resumen de símbolos activos
Muestra todos los símbolos negociados con el número de operaciones, el total de lotes de compra/venta y las
FREE

Para aquellos traders que realmente se preocupan por el Volumen como un importante vector de información en la Acción del Precio, aquí está una idea y creación exclusiva de Minions Labs: Velocidad de Volumen . El indicador de Velocidad de Volumen te muestra visualmente cuánto tiempo (en segundos, minutos, horas, tú eliges) ha tardado el Volumen en alcanzar el Volumen Medio de las últimas barras. De esta manera usted puede tener la idea exacta de "lo que está sucediendo en este momento con el Vol

El indicador utiliza múltiples marcos de tiempo para analizar las mejores entradas de compra en el auge 1000. Está diseñado para ayudar a operar únicamente en picos de auge. el indicador tiene dos flechas; los rojos y azules. la formación de la flecha roja indica que debe estar preparado para una flecha azul que es una señal de entrada de compra. el indicador no ofrece puntos de salida. siempre recopile 3 pips, es decir, si ingresó a una operación a 10230,200, puede salir a 10260,200 con SL a 1
FREE

El indicador Swing High Low es una herramienta esencial para los operadores que confían en la acción del precio. Marca automáticamente puntos clave de inversión (máximos oscilantes en rojo, mínimos oscilantes en verde), ayudándole a visualizar tendencias, detectar rupturas y trazar líneas de tendencia precisas. Al resaltar estos niveles críticos, el indicador revela los cambios en la estructura del mercado, ya sea que la tendencia se esté fortaleciendo, invirtiendo o entrando en consolidación.
FREE

CurvedSmoothChannel_Enhanced - Indicador de canal de precio mejorado
**CurvedSmoothChannel_Enhanced** es un potente y atractivo indicador de canal de precio, diseñado para MetaTrader 5, que le ayuda a identificar tendencias, posibles reversiones y niveles clave de precio con precisión. Esta versión mejorada combina la potencia de la Media Móvil de Hull (HMA) y el Filtro Supersuave de John Ehlers, creando un canal dinámico y adaptativo que se ajusta a las condiciones del mercado en múltiples ma
FREE

Gráfico de segundos para MetaTrader 5
Los indicadores le permiten crear gráficos en el terminal MetaTrader 5 con un período de tiempo en segundos. El período de tiempo en dicho gráfico se establece en segundos, no en minutos u horas. Por lo tanto, puede crear gráficos con un período de tiempo inferior a M1. Por ejemplo, S15 es un período de tiempo con un período de 15 segundos. Puede aplicar indicadores, asesores expertos y scripts al gráfico resultante.
Obtiene un gráfico completamente funci
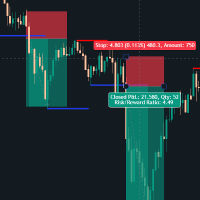
Indicador de ruptura de soporte y resistencia Este indicador personalizado para MT5 identifica automáticamente los niveles de precios clave en los que el mercado ha invertido históricamente (zonas de soporte y resistencia) y alerta a los operadores cuando estos niveles se rompen con convicción. Qué hace: El indicador escanea la acción del precio para detectar máximos y mínimos de oscilación significativos y, a continuación, traza líneas dinámicas de soporte y resistencia que se extienden hacia a

SUPERTREND; Es un indicador de seguimiento de tendencias basado en el SuperTrend ATR creado por Olivier Seban. Se puede utilizar para detectar cambios en la dirección de la tendencia y localizar paradas. Cuando el precio cae por debajo de la curva del indicador, se vuelve rojo e indica una tendencia bajista. Por el contrario, cuando el precio se mueve por encima de la curva, el indicador se vuelve verde, lo que indica una tendencia alcista. Al igual que otros indicadores, funciona bien en SuperT
FREE

Es la versión MQL5 del MACD zero lag que estaba disponible para MT4 aquí: https://www.mql5.com/en/code/9993 También había una versión en color aquí pero tenía algunos problemas: https://www.mql5.com/en/code/8703 Arreglé la versión para MT4 que tiene 95 líneas de código. Me tomó 5 días escribir la versión para MT5 (leyendo los logs y probando varias veces y descubriendo la diferencia entre MT5 y MT4). ¡Mi primera versión MQL5 de este indicador tenía 400 líneas de código pero optimicé mi propio có
FREE
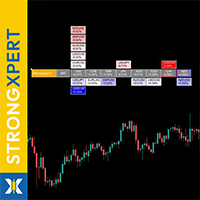
HAGA CLIC AQUÍ PARA VER TODOS MIS PRODUCTOS GRATUITOS
StrongXpert es tu monitor preciso de fuerza en tiempo real para el mercado global de divisas. Ha sido desarrollado para mostrarte dónde entra realmente el capital - y de dónde está saliendo del mercado . El indicador mide la fuerza relativa de todas las divisas principales (USD, EUR, GBP, JPY, AUD, CAD, CHF, NZD) y convierte movimientos de precios complejos en un panel visual simple y fácil de leer - directamente en el gráfico. Identifica e
FREE
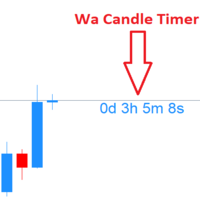
Wa Candle Timer MT5 muestra en el gráfico principal una cuenta regresiva en vivo hasta el cierre de la vela actual. Al acercarse el fin de la barra, el temporizador cambia de color (por defecto cuando ha transcurrido ~95% de la duración de la vela, es decir, ~5% restante).
Indicador ligero, claro e ideal para quienes sincronizan entradas/salidas con el cierre de velas. Funciones clave Cuenta regresiva en tiempo real hasta el cierre del bar para cualquier símbolo y marco temporal. Cambio de color
FREE
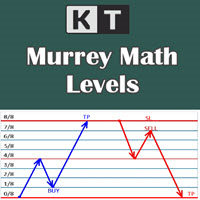
Muestra los niveles Murrey Math en el gráfico y también proporciona una alerta cuando el precio toca un nivel en particular. T. Henning Murrey, en 1995, presentó un sistema de trading llamado Murrey Math Trading System, que se basa en las observaciones realizadas por W.D Gann.
Aplicaciones
Para los amantes de Murrey Math, este es un indicador imprescindible en su arsenal. No es necesario que esté presente en la pantalla todo el tiempo. Cada vez que el precio toque un nivel, enviará una alerta.

Un mapa de calor con un perfil de volumen es como una cámara termográfica o una máquina de rayos X. Le ayudará a estimar la distribución relativa del volumen durante el movimiento del precio y a comprender la relación entre el volumen y el precio. Le ayudará a estimar la distribución relativa del volumen durante el movimiento del precio y a entender la relación entre el volumen y el precio. El indicador Perfil de Volumen "Volumos Máximos" es una herramienta poderosa para analizar esta relación.

Indicador Heikin Ashi RSI para MT5 (HARSI) Visión general
El indicador Heikin Ashi RSI (HARSI) combina el suavizado de velas Heikin Ashi con el análisis del momento RSI, proporcionando una visión de doble capa de la acción del precio y la fuerza relativa. Ofrece una clara visualización de la dirección del mercado, condiciones de sobrecompra y sobreventa basadas en el RSI, y sistemas opcionales de backtesting y alertas para la validación de estrategias y la automatización de señales comerciales.

### Indicador Ultimate Pivot Levels para MetaTrader 5
Ultimate_Pivot_Levels es una herramienta versátil diseñada para mejorar su experiencia de trading al trazar con precisión los niveles de pivote en sus gráficos. Permite ingresar sus valores deseados manualmente o utilizar métodos de cálculo de pivotes bien conocidos para crear niveles de pivote. Dibuja los niveles en el fondo y le permite personalizar los niveles, el tamaño y los colores de las áreas, y mantiene sus ajustes mientras extiende
FREE

Versión MT4 MA Ribbon MT5 MA Ribbon es un indicador mejorado con 8 medias móviles de períodos crecientes. MA Ribbon es útil para reconocer la dirección de la tendencia, posibles reversiones y puntos de continuación en el mercado. También indica potenciales puntos de entrada, toma de ganancias parciales y puntos de salida. El precio entrando, saliendo o retesteando el Ribbon y un número definido de cruces de MA pueden indicar posibles puntos de entrada para posiciones largas y cortas. Ofrece
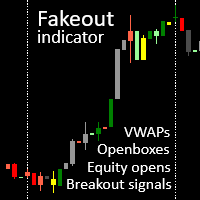
akeout candle indicator con VWAPs de sesión, openboxes y señales de ruptura de openbox. Consulte nuestros otros productos para fxer.net:
https://www.mql5.com/en/market/product/114888
https://www.mql5.com/en/market/product/114890 Características principales 1. VWAPS para las sesiones de Tokio, Londres y NY 2. 2. Openboxes para las sesiones de Tokio, Londres y Nueva York 3. Velas de colores para rupturas, falsas rupturas y velas interiores 4. Línea abierta de renta variable 5. Ampliaciones de la
FREE

Hull Moving Average (HMA) para MT5 – Indicador de tendencia rápido, suave y sin retraso
Hull Moving Average (HMA) es un indicador de tendencia de alto rendimiento para MT5 que ofrece señales ultra suaves y casi sin retraso. A diferencia de SMA, EMA o WMA, el HMA reacciona de inmediato a los cambios del mercado mientras filtra el ruido — perfecto para scalpers y traders intradía. Construido con un motor eficiente de medias móviles ponderadas, aplica la fórmula original de Alan Hull y genera una
FREE

El indicador de sesiones de trading destaca los inicios y finales de cada sesión de trading. Versión de pago del producto Trading_Sessions_Indicator_Pro con la posibilidad de personalizar el Inicio/final de las sesiones >>>
[OPCIONES] Timeshift - Use si hay Sessions offset en el tiempo
[Parámetros preestablecidos:] Asian session Open=0; Asian session Close=9; Asian session OpenSummertime=1; Asian session CloseSummertime=10; European session Open=8; European session Close=17; European session
FREE

Bloque de órdenes Smart Finder El Ritz Smart Finder Order Block es una herramienta de reconocimiento de estructuras de mercado de última generación, diseñada para detectar y resaltar de forma inteligente las huellas institucionales dentro de la acción de los precios. Basada en una combinación dinámica de teoría de bloques de órdenes, seguimiento de consolidaciones y modelización adaptativa de la volatilidad, proporciona a los operadores una lente sofisticada para anticipar reacciones de mercado
FREE
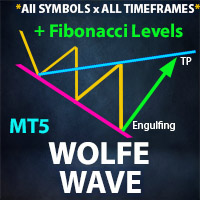
** Todos los Símbolos x Todos los Plazos escanean con solo presionar el botón del escáner ** *** Ponte en contacto conmigo para enviarte instrucciones y añadirte al "grupo Wolfe Wave Scanner" para compartir o ver experiencias con otros usuarios.
Introducción: Una Onda de Wolfe se crea con patrones de cinco ondas en el precio. Muestra la oferta y la demanda y una lucha hacia un precio de equilibrio. Estas ondas de acciones de precios pueden ayudar a los operadores a identificar los límites de la

G-Labs Market Maker Dashboard - Oferta exclusiva de temporada Mejore sus operaciones con el cuadro de mandos original de Market Maker de G-Labs, disponible por tiempo limitado a sólo 70 USD. Ideal para traders principiantes, este tablero ha sido mejorado con nuevas características y ahora incluye un video de entrenamiento completo. Este indicador es para las personas que operan el método de los creadores de mercado y es el tablero de instrumentos de nivel de entrada para que la estrategia está d

Este indicador es un port de MQL5 inspirado en el concepto "Cyclic Smoothed RSI" desarrollado originalmente por Dr_Roboto y popularizado por LazyBear y LuxAlgo en TradingView. El RSI Cíclico Suavizado (cRSI) es un oscilador diseñado para abordar las dos principales limitaciones del RSI estándar: retraso y niveles fijos de sobrecompra/sobreventa. Al utilizar el procesamiento digital de señales (DSP) basado en los ciclos del mercado, el cRSI reduce el ruido sin sacrificar la capacidad de respuest
FREE

Por favor, buena crítica sobre este indicador, y yo tal vez producir más indicadores, Próximamente, EA basado en estos indicadores
Linear Weighted Moving Average con HLCC precio aplicado, y las bandas de Bollinger con LWMA como precio aplicado. Interesante flecha de compra y venta basado en este indicador, no Lag indicador como flecha aparecerá 1 vela después de crossed...............
FREE

ste es un indicador personalizado basado en el cruce de medias dobles y el marcado de flechas.
Haga varias listas cuando las flechas azules aparezcan hacia arriba.
Haga una lista en blanco cuando la flecha roja aparezca hacia abajo.
Cuando la línea rosa cruza la línea verde hacia arriba, la línea rosa está arriba, la línea verde está abajo, aparece la horquilla dorada y la flecha azul.
Cuando la línea rosa cruza hacia abajo la línea verde, la línea rosa está abajo, la línea verde está arrib
FREE
Indicador Optimized Trend Tracker (OTT) El Optimized Trend Tracker ( OTT) es un indicador personalizado diseñado para visualizar la dirección de la tendencia y los posibles cambios basados en una media móvil configurable y en niveles dinámicos de soporte/resistencia. Ofrece múltiples opciones de visualización y señalización, lo que lo hace adecuado para el análisis discrecional o la integración en sistemas automatizados. Características principales Tipos de medias móviles configurables
Admite S

La Divergencia TMA - RSI vista en Trading View ha sido creada para su uso en MT5. La Divergencia TMA RSI es un indicador técnico que combina la TMA ( Media Móvil Triple ) y el RSI (Índice de Fuerza Relativa ) . Es una técnica utilizada para detectar divergencias, cuando el precio y el RSI se mueven en direcciones opuestas . El RSI suele estar suavizado por la TMA y la propia línea de la TMA se utiliza en lugar del RSI , en lugar de fijarse en el RSI por sí solo, para captar los puntos de inflexi
FREE

Este indicador utiliza el indicador Zigzag para identificar los máximos y mínimos de oscilación en el gráfico de precios. Una vez identificados los máximos y mínimos de oscilación, puede utilizarlos para determinar posibles niveles de soporte y resistencia. Un nivel de soporte se forma cuando el precio cae y rebota desde un mínimo oscilante, lo que indica que hay presión compradora en ese nivel. Un nivel de resistencia se forma cuando el precio sube y retrocede desde un máximo oscilante, lo que
FREE

Introducción
WaveTrend Plus es un asombroso oscilador que puede detectar puntos óptimos de entrada en el mercado con gran precisión utilizando complejos cálculos de precio e impulso. Esta versión incluye muchas mejoras en comparación con el WaveTrend original, como imágenes más nítidas, señales de sobreventa/sobrecompra y detección de divergencias
Señal
Compre cuando aparezca una señal de sobreventa (punto verde abajo) o cuando se detecte una divergencia alcista (línea discontinua verde)
Ve
FREE

Si te gusta este proyecto, deja una revisión de 5 estrellas. A medida que las instituciones comercializan grandes volúmenes, no es raro que
traten de intentar
defender su posición en niveles porcentuales específicos. Estos niveles servirán como soporte natural y resistencia que usted puede
utilizar
para entrar en un comercio o estar consciente de posibles peligros contra su
posición. Un ejemplo de porcentajes usados comunes son 0.25% y 0.50% en EURUSD para el
semana, puedes ver este ejemplo e
FREE

El panel de alertas de ADR le muestra de un vistazo dónde se negocia actualmente el precio en relación con su rango diario promedio normal. Recibirá alertas instantáneas a través de una ventana emergente, correo electrónico o push cuando el precio exceda su rango promedio y los niveles por encima de su elección para que pueda saltar rápidamente a retrocesos y reversiones. El guión está diseñado para colocarse en un gráfico en blanco y sentarse en el fondo y alertarlo cuando se alcanzan los nive

INDICADOR LIQUIDITY SWEEPS - MT5 Herramienta avanzada Smart Money Concept
VISTA GENERAL
El indicador Liquidity Sweeps es una herramienta de MT5 de nivel profesional diseñada diseñada para identificar las capturas de liquidez institucional y los patrones de stop-hunt. Basado en en
FREE

El indicador muestra puntos pivotantes diarios. Es posible especificar el número de días a mostrar. Para forex no considera los datos de la sesión del domingo. Es posible modificar el color, estilo y ancho para cada nivel. Es mejor utilizar este indicador con un marco de tiempo no superior a Н1. 4 Niveles de soporte y resistencia con también Niveles Intermedios que es posible ocultar.
FREE

El indicador determina la dirección del movimiento del precio, calcula la posibilidad de entrar en el mercado utilizando una fórmula interna y muestra una señal de entrada de ruptura. Las señales del indicador aparecen tanto al comienzo de los movimientos de tendencia como en la dirección opuesta, lo que le permite abrir y cerrar órdenes de la manera más eficiente posible en cualquiera de las condiciones del mercado. Versión para МТ4: https://www.mql5.com/en/market/product/58349
Ventajas: una f
FREE
El Mercado MetaTrader es una plataforma única y sin análogos en la venta de robots e indicadores técnicos para traders.
Las instrucciones de usuario MQL5.community le darán información sobre otras posibilidades que están al alcance de los traders sólo en nuestro caso: como la copia de señales comerciales, el encargo de programas para freelance, cuentas y cálculos automáticos a través del sistema de pago, el alquiler de la potencia de cálculo de la MQL5 Cloud Network.
Está perdiendo oportunidades comerciales:
- Aplicaciones de trading gratuitas
- 8 000+ señales para copiar
- Noticias económicas para analizar los mercados financieros
Registro
Entrada
Si no tiene cuenta de usuario, regístrese
Para iniciar sesión y usar el sitio web MQL5.com es necesario permitir el uso de Сookies.
Por favor, active este ajuste en su navegador, de lo contrario, no podrá iniciar sesión.