YouTube'dan Mağaza ile ilgili eğitici videoları izleyin
Bir alım-satım robotu veya gösterge nasıl satın alınır?
Uzman Danışmanınızı
sanal sunucuda çalıştırın
sanal sunucuda çalıştırın
Satın almadan önce göstergeyi/alım-satım robotunu test edin
Mağazada kazanç sağlamak ister misiniz?
Satış için bir ürün nasıl sunulur?
MetaTrader 5 için teknik göstergeler - 12

Gelişmiş Ekonomik Takvim Göstergesi Bu gösterge, seçilen döviz çifti veya enstrüman için tüm yaklaşan ekonomik olayları doğrudan grafikte gösterir. Yüksek volatilite dönemlerini önceden tahmin etmenizi sağlar ve işlem stratejilerinizi daha hassas şekilde planlamanıza yardımcı olur. Başlıca Özellikler Gelecek olayların 5 gün öncesine kadar görüntülenmesi (özelleştirilebilir). Haber etkisine göre filtreleme (yüksek, orta, düşük). Hızlı tanımlama için dikey olay çizgileri ve numaralı işaretler göst
FREE

### Indicator Description: Gradient Heiken Ashi with Momentum Coloring
This indicator is a technical analysis tool designed to overlay on the main chart, helping traders easily identify price trends and momentum through modified Heiken Ashi candles. It combines smoothed candle value calculations based on moving averages with a gradient color system to represent the strength of bullish or bearish trends.
#### 1. Key Features
- Display of Modified Heiken Ashi Candles:
- The indicator draws opt
FREE
Engulfing Period V75Killed İndikatörü: Ticaret Stratejinizi Değiştirin!
(Bu indikatör ÖZELDİR ve yalnızca belirli amacı ve değerini bilen trader'lar için tasarlanmıştır.) Engulfing Period V75Killed İndikatörü, birden fazla zaman diliminde önemli engulfing dönemlerini zahmetsizce belirlemek isteyen trader'lar için bir devrim niteliğindedir. Engulfing bölgelerini grafiğinizde doğrudan işaretleyerek, bu indikatör zamandan tasarruf etmenizi sağlar ve yüksek olasılıklı ticaret fırsatlarını yakalama
FREE

An MT5 divergence scanner that automatically finds divergence / hidden divergence between price and a chosen oscillator , then draws the matching trendlines/channels in the indicator window and can alert you when the line is crossed. Key features (simple) Auto Divergence Detection Bullish divergence : price makes a lower low while oscillator makes a higher low (possible reversal up). Bearish divergence : price makes a higher high while oscillator makes a lower high (possible reversal down). Hidd
FREE

Grebenka - помощник для разметки графика.
Функционал: 1. позволяет непрерывно рисовать линии ZigZag в ручном режиме, используя клики мышкой. 2. позволяет включать режим, при котором любая трендовая линия с которой в данный момент проводится манипуляция, выравнивается по горизонтали.
Горячие клавиши: [Z] - включение/выключение режима рисования линий ZigZag вручную [X] - включение/выключение режима горизонтальной трендовой линии [C] - быстрая смена цвета линий ZigZag [Del] - стандартная клавиш
FREE
The indicator calculates and displays the Z-Score spread (cointegrated spread) between two financial instruments. It is based on the ordinary least squares (OLS) method to estimate the relationship coefficient between the prices of two symbols and then normalizes the spread distribution into Z-Score values. In a separate indicator window you will see: Main Z-Score line (red) Upper and lower thresholds (silver, dashed), set by the user When the thresholds are reached the indicator signals a poten

Flux Core Reversal Indicator Volatility-Adaptive Reversal Signals for XAUUSD (Gold) and BTCUSD (Bitcoin) Gold (XAUUSD) and Bitcoin (BTCUSD) do not reverse because an oscillator crosses a line.
They reverse when volatility, structure, and price expansion align. checkout my best EA for Gold (prop firm compliant, special prize for limited time - https://www.mql5.com/en/market/product/163289?
checkout my best EA for BTC (prop firm compliant), special prize for limited time - https://www.mql5.c
FREE

It is one of the famous indicator in TradingView platform. Supertrend indicator shows the trend of the market intuitively . You can use it for understanding the trend or get insight about the market.
------- Value & Color -------- You can change the colour (line, filled). Default value is the same as Tradingview Supertrend default value ( period 10, ATR multiplier 3.0)

WickSniper Pro – Precision Reversal Indicator for Smart Traders ===============================================================
WickSniper Pro is a powerful **non-repainting** price action indicator that detects **inside bar breakout reversals** with sniper-like accuracy. Whether you're a scalper, swing trader, or day trader, WickSniper Pro helps you catch high-probability turning points in the market using clean, intuitive signals.
Key Features ------------ - Non-Repainting – Once a signa
FREE

his is a custom indicator based on double-average crossing and arrow marking.
Make multiple lists when blue arrows appear up.
Make a blank list when the red arrow appears down.
When the pink line crosses the green line upwards, the pink line is above, the green line is below, the golden fork appears, and the blue arrow appears.
When the pink line crosses down through the green line, the pink line is below, the green line is above, a dead fork appears, and a red arrow appears.
This is a goo
FREE
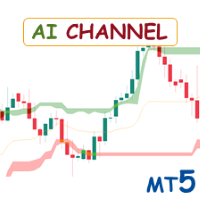
Special offer : ALL TOOLS , just $35 each! New tools will be $30 for the first week or the first 3 purchases ! Trading Tools Channel on MQL5 : Join my MQL5 channel to update the latest news from me AI Channels göstergesi, kümeleme analizinde güçlü bir makine öğrenimi tekniği olan kayan K-means kümeleme kullanarak temel fiyat eğilimleri hakkında gerçek zamanlı bilgiler sağlar. Bu gösterge, kümelenmiş fiyat verilerine dayalı uyarlanabilir kanallar oluşturur ve yatırımcıların eğilim y
FREE

Heiken Ashi Yemeni Heiken Ashi Yemeni is a professional indicator for MetaTrader 5 that combines modified Heiken Ashi candles with two smart trend lines ( Yemen 1 & Yemen 2 ) based on advanced and complex internal calculations, providing a clearer view of the trend and reducing market noise. The indicator is designed to give traders a smooth and easy-to-read market overview , making it suitable for manual trading and trend-based strategies . Indicator Features Enhanced Heiken Ashi candles for
FREE
What is Double Top and Bottom Double top and bottom patterns are chart patterns that occur when the underlying investment moves in a similar pattern to the letter "W" (double bottom) or "M" (double top). Double top and bottom analysis is used in technical analysis to explain movements in a security or other investment, and can be used as part of a trading strategy to exploit recurring patterns. you can fin MT4 version hier
Indicator shows you 2 Level target and stop loss level. Stoploss level

Introduction The "Ultimate Retest" Indicator stands as the pinnacle of technical analysis made specially for support/resistance or supply/demand traders. By utilizing advanced mathematical computations, this indicator can swiftly and accurately identify the most powerful support and resistance levels where the big players are putting their huge orders and give traders a chance to enter the on the level retest with impeccable timing, thereby enhancing their decision-making and trading outcomes.
FREE

The Weis Wave first takes the market volume and then organizes it with the price into Wave charts. It is the only software that will present the true picture of the market before you. If anyone of you, has watched an intraday price movement then you must know that it unfolds in a series of selling as well as buying waves-a procedures tearing down and building up. Wave analysis is an integral part of the trading method. The indicator helps to deal with today’s volatile market. Moreover, it works
FREE
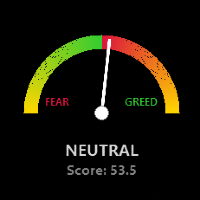
Global Market Risk Sentiment Meter 1. Abstraction The Global Market Risk Sentiment Meter is a sophisticated analytical tool designed for the MetaTrader 5 (MQL5) platform. Unlike traditional indicators that analyze a single asset in isolation, this utility employs an Inter-Market Analysis approach to reconstruct the psychological state of the global financial markets. By aggregating real-time data from US Indices, Global Equities, Cryptocurrencies, and Safe Haven assets (Gold and the US
FREE

Özellikler
Fiyata göre işlem hacmini kontrol etmek için gösterge. Çoğunlukla EURUSD için çalışır, diğer para çiftlerinde işe yaramayabilir veya hesaplama uzun zaman alabilir. Düzgün bir kullanım için "Grafiğin sağ kenarından bitiş sınırını kaydır" seçeneğini açın (ekrandaki resimde gösterildiği gibi). Yeni bir çubuk verisi göründüğünde veriler sıfırlanır.
Değişkenler COlOR: Gösterge rengini ayarlama WIDTH: Gösterge genişliğini ayarlama PERIOD: Verileri hesaplamak için zaman periyodunu belirl
FREE

A tool for on-chart strategy backtesting and performance analysis.
A utility for developing, debugging, and testing custom trading ideas and indicator functions.
An indicator designed to quickly test trading concepts and visualize the effectiveness of different input parameters.
An all-in-one sandbox for testing everything from simple crossovers to complex, multi-condition trading systems.

The Breakout Finder (BF) is a technical analysis indicator designed for MetaTrader 5 (MT5) platforms. It identifies potential breakout and breakdown patterns in price action by analyzing pivot highs and lows over a specified period. The indicator detects "cup" formations—clusters of pivot points within a narrow price channel—indicating areas of consolidation that may lead to strong directional moves when broken. EA: BlackHole Breakout EA https://www.mql5.com/en/market/product/149206
Key Featur
FREE

The Quantitative Qualitative Estimation (QQE) indicator is derived from Wilder’s famous Relative Strength Index (RSI). In essence, the QQE is a heavily smoothed RSI.
Modification of this version: ( converted from tradingview script by Mihkell00, original from Glaz, 100% identical output)
So there are Two QQEs. One that is shown on the chart as columns, and the other "hidden" in the background which also has a 50 MA bollinger band acting as a zero line.
When both of them agree - you get a b

THE PREDICTOR: Advanced Machine Learning & ICT Powerhouse Transform your trading from guesswork to data-driven precision. The Predictor is not just another indicator; it is a sophisticated market analysis engine that combines Pattern Recognition AI with the institutional power of ICT (Inner Circle Trader) strategies. Designed for professional traders who demand high-accuracy signals for Forex, Boom/Crash, and Volatility Indices. Why Choose "The Predictor"? Unlike lagging indicators, T
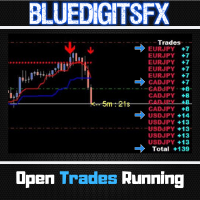
Free Utility Tool by BlueDigitsFx
Designed to improve workflow and trade management
Also available for MetaTrader 4
Optional access to updates & support via the BlueDigitsFx Discord Server BlueDigitsFx Open Trades is a powerful MT5 tool that displays your total pips from all open trades in real time.
Its intuitive color-coded interface quickly indicates winning and losing trades across all currency pairs.
This helps you monitor your trade performance effortlessly, enabling faster decision-
FREE
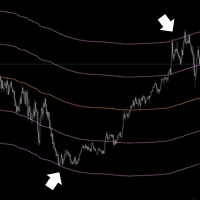
Elevate Your Trading with Advanced Anchored Volume Weighted Average Price Technology Unlock the true power of price action with our premium Anchored VWAP Indicator for MetaTrader 5 - the essential tool for precision entries, strategic exits, and high-probability trend continuation setups. Write me a DM for a 7 day free trial. Anchored VWAP Plus gives traders unprecedented control by allowing custom anchor points for Volume Weighted Average Price calculations on any chart. With support for 4 sim
FREE
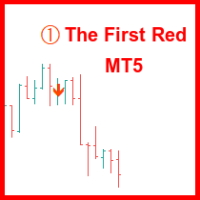
"The First Red" göstergesi, Dariusz Dargo tarafından oluşturulan stratejiye dayalı olarak geliştirilmiştir. Bu gösterge, "The First Red" stratejisi ve "Second Red," "First Green" ve "Second Green" gibi genişletme koşullarını karşılayan mumları grafik üzerinde belirlemek ve işaretlemek için tasarlanmıştır. Strateji, yerel aşırılıkların ve MACD osilatöründen gelen sinyallerin analizine odaklanır. İlk Kırmızı Mum (First Red Candle): Bir mum, yerel bir maksimum oluşturduğunda ve MACD histogramı dü

Desenvolvido por smart2trader.com Indicador Pin Bar Color detecta e pinta automaticamente padrões de pin bar no gráfico com cores personalizáveis, oferecendo configurações flexíveis para identificação de oportunidades de trading. Além disso, através do nosso indicador Pin Bar , é possível monitorar em tempo real as formações do padrão pin bar , sendo sempre avisado nos ultimos 30 segundos antes do encerramento do candle.
Sobre o Padrão Pin Bar
O padrão Pin Bar é amplamente utilizado na análise
FREE
Haven RSI Candlestick , Göreceli Güç Endeksi'nin (RSI) geleneksel çizgi grafiğini sezgisel bir mum grafiği formatına dönüştüren yenilikçi bir teknik göstergedir.
Bu araç, teknik analize dayanan ve piyasa momentumunu ve potansiyel geri dönüş noktalarını daha hızlı ve daha derinlemesine yorumlamayı amaçlayan yatırımcılar için tasarlanmıştır. Diğer ürünler -> BURADA . Temel Özellikler: RSI'ın Mum Olarak Görselleştirilmesi: Temel özellik budur. Artık momentum değişikliği sinyallerini daha erken tesp
FREE

MT5 için Chart Symbol Changer , panelindeki bir sembol düğmesini tıklatarak ekli mevcut grafik sembolünü değiştirme seçeneği sunan bir gösterge/yardımcı programdır. MT5 için Grafik Sembol Değiştirici , gözünüz üzerinde olsun ve en çok alım satım yapmak istediğiniz çiftleri ekleyerek 32 sembol düğmesini kişisel tercihinize göre yapılandırma seçeneği sunar. Bu şekilde hiçbir fırsatı kaçırmazsınız çünkü sadece birkaç tıklamayla grafiğinizdeki piyasayı daha hızlı görebilirsiniz.
MT5 Kurulum/Ku
FREE

This indicator uses support and resistance, volume and some special formula to calculate the volume to filter the candles. If the volume reaches a specific value, And at the same time, Candle breaks the support/resistance line, There would be a signal and we can enter the market. Signals appear when the current candle closes. then you can enter the trade when a new candle appears. Please don't forget to follow your money management plan.
MT4 Version Support/Resistance Breakout MT4 : https:/

"BIG FIGURE INDICATOR", otomatik olarak fiyat grafiklerindeki belirli seviyelerde yatay çizgiler tanımlar ve çizer; örneğin, bütün sayılar veya yarım sayılar gibi (örneğin, para birimi işlemlerinde 1.0000 veya 1.5000). Bu seviyeler, büyük tüccarların ve yatırımcıların odaklanabileceği yuvarlak sayıları temsil ettikleri için psikolojik olarak önemli kabul edilir ve potansiyel destek veya direnç seviyelerine yol açabilir. Büyük rakam göstergesi, tüccarların önemli fiyat seviyelerini belirlemeleri
FREE

Bu gösterge paneli, seçilen semboller için mevcut en son harmonik kalıpları gösterir, böylece zamandan tasarruf edersiniz ve daha verimli olursunuz / MT4 sürümü .
Ücretsiz Gösterge: Basic Harmonic Pattern
Gösterge sütunları Symbol : seçilen semboller görünecektir Trend: yükseliş veya düşüş Pattern : desen türü (gartley, kelebek, yarasa, yengeç, köpekbalığı, cypher veya ABCD) Entry : giriş fiyatı SL: zararı durdur fiyatı TP1: 1. kar alma fiyatı TP2: 2. kar alma fiyatı TP

Entry IQ İndikatörü, yatırımcıların uzun ve kısa pozisyonlar için yüksek olasılıklı giriş noktalarını belirlemelerine yardımcı olmak üzere tasarlanmış gelişmiş bir teknik analiz aracıdır. Bu ileri düzey ticaret aracı, piyasa trendlerini ve fiyat hareketlerini kapsamlı bir şekilde analiz etmek için dinamik fiyat kutuları, denge bölgeleri ve tescilli trend tespit algoritmalarının bir kombinasyonunu kullanır. Bu unsurları sentezleyen indikatör, piyasa duyarlılığını anlamak ve kritik dönüm noktalar
FREE

Breakout Monitor is a powerful trading tool designed to track price action within your custom-drawn zones. Simply draw a rectangle on your chart to define your consolidation or key levels, and the indicator will do the rest. It highlights the price range clearly and monitors it in real-time, ensuring you never miss a significant market move. When the price breaks through your defined boundaries, the indicator sends an instant Push Notification directly to your mobile phone in a clear, actionable
FREE

Tabajara Rules for MT5 , Profesör André Machado’nun Tabajara Setup’una dayanır ve hareketli ortalamalar kullanarak, mumlar hareketli ortalamanın yönüyle aynı yönde olduğunda piyasanın yönünü gösterir.
Gösterge, mumlara ve hareketli ortalamaya uygulanan renklendirme kuralını içerir.
Hareketli ortalamanın periyodu ve yumuşatma yöntemi gibi parametrelerin değiştirilmesine izin verir.
Ayrıca mumların (kenarlıklar ve doldurma) ve hareketli ortalamanın renklerinin değiştirilmesine olanak tanır.
Prof
FREE
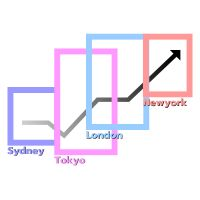
Time Zones and the Forex Market
The Forex market operates continuously 24 hours a day, facilitated by its global distribution across various time zones. The market is anchored by four primary trading centers: Sydney , Tokyo , London , and New York . Each trading center has specific opening and closing times according to its respective time zone. These differences significantly impact market volatility and trading opportunities during each session. Features Enable/Disable Date Display Enable/Di
FREE

AÇIKLAMA
ICSM (Impulse-Correction SCOB Mapper), fiyat hareketini analiz eden ve geçerli impulsları, düzeltmeleri ve SCOB'ları (Single Candle Order Block) tanımlayan göstergedir. Esnek, bilgilendirici, kullanımı kolay olması ve tüccarın en likit ilgi alanlarına yönelik farkındalığını önemli ölçüde artırması nedeniyle her türlü teknik analizle kullanılabilen güçlü bir araçtır.
AYARLAR
Genel | Görsel
Renk teması — ICSM'nin renk temasını tanımlar.
SCOB | Görsel
SCOB'u göster — SCOB'u etkinleş

VR Ticks, ölçeklendirmeye dayalı stratejiler için özel bir göstergedir. Bu gösterge sayesinde tüccar, onay grafiğini doğrudan finansal aracın ana grafiğinde görebilir. Onay grafiği, piyasaya bir pozisyon girmenize veya piyasadaki bir pozisyonu mümkün olduğunca doğru bir şekilde kapatmanıza olanak tanır. VR Ticks, kene verilerini yöne bağlı olarak renk değiştiren çizgiler biçiminde çizer; bu, kenelerle ilgili durumu görsel olarak anlamanıza ve değerlendirmenize olanak tanır. Onay grafiklerinin
FREE
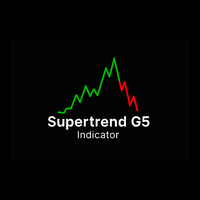
Supertrend G5 Indicator Supertrend G5 is a high-performance trend-following tool designed to accurately identify market reversal points. By displaying a color-coded line directly on the chart, this indicator helps you quickly recognize bullish trends (green) and bearish trends (red), supporting optimal entry and exit points. Key Features: Clear Buy/Sell Signals Buy when the Supertrend line changes from red to green (beginning of an uptrend). Sell when the Supertrend line changes from green to re
FREE

This indicator can be considered as a trading system. It offers a different view to see the currency pair: full timeless indicator, can be used for manual trading or for automatized trading with some expert advisor. When the price reaches a threshold a new block is created according to the set mode. The indicator beside the Renko bars, shows also 3 moving averages.
Features renko mode median renko custom median renko 3 moving averages wicks datetime indicator for each block custom notification
FREE

Check out my TRADE PLANNER MT5 – strongly recommended to anticipate account scenarios before risking any money. You get a professional moving average indicator with multiple calculation methods available, including exponential, linear, smoothed and linear weighted approaches. The indicator is designed to work on smoothed Heikin Ashi candles, which are included in the 'Examples' folder of Meta Trader 5. By applying this tool, traders can significantly reduce unwanted market noise.
FREE

First time on MetaTrader, introducing IQ Star Lines - an original Vedic Astrology based indicator. "Millionaires don't use astrology, billionaires do" . - J.P. Morgan, Legendary American financier and banker.
IQ Star Lines, an unique astrological indicator purely based on Vedic astrology calculations, published for the first time on Metatrader. This unique tool plots dynamic planetary grid lines based on real-time stars, constellations, and celestial movements, which allows you to plot t

The original author is David Weis, an expert in the Wyckoff Method. The Weis Wave is a modern adaptation of the 1930's Wyckoff Method, another expert in Tape Reading techniques and Chart Analysis. Weis Waves takes market volume and stacks it into waves according to price conditions giving the trader valuable insights about the market conditions. If you want to learn more about this subject you can find tons of videos in YouTube. Just look for "The Wickoff Method", "Weis Wave" and "Volume Spread
FREE

TG MTF MA MT5 is designed to display a multi-timeframe moving average (MA) on any chart timeframe while allowing users to specify and view the MA values from a particular timeframe across all timeframes. This functionality enables users to focus on the moving average of a specific timeframe without switching charts. By isolating the moving average values of a specific timeframe across all timeframes, users can gain insights into the trend dynamics and potential trading opportunities without sw
FREE

SMC Order Block Zones (MT5) is a Smart Money Concept (SMC) analytical indicator specially designed and optimized for Gold (XAUUSD) .
It automatically detects Order Blocks and displays them as Supply & Demand zones , helping traders identify potential institutional price levels on Gold. The indicator uses volatility-adaptive logic , making it highly suitable for the fast and aggressive movements of XAUUSD. Key Features (XAUUSD Optimized) Specially designed for Gold (XAUUSD) Automatic Order Block
FREE
Keyzone, destek ve direnç seviyelerini belirlemek için tasarlanmış bir gösterge olup, dört ana seviyeye ayrılmıştır: 3, 8, 21 ve 89 . Bu seviyeler, Smart Money Concept (SMC) yaklaşımının gelişmiş bir uyarlamasıyla oluşturulmuş olup, yüksek verimlilik sağlarken kullanımını basit ve etkili hale getirir. Keyzone'un minimalist ancak güçlü tasarımı , farklı ticaret stillerine kolayca uygulanabilir:
Scalping – Hızlı ve yüksek frekanslı işlemler Swing Trading – Orta vadeli fiyat hareketlerinden yararla
FREE
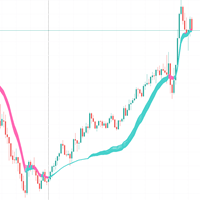
Understanding the RSI Adaptive EMA Indicator This code implements a custom trading indicator called "RSI Adaptive EMA" for MetaTrader platforms. It's a fascinating approach that combines RSI (Relative Strength Index) with an Exponential Moving Average (EMA) in a way that makes the EMA adapt based on market conditions.
Core Concept Traditional EMAs use a fixed smoothing factor (alpha), but this indicator creates a dynamic smoothing factor that changes based on RSI values. This allows the EMA lin
FREE

Necessary for traders: tools and indicators Waves automatically calculate indicators, channel trend trading Perfect trend-wave automatic calculation channel calculation , MT4 Perfect trend-wave automatic calculation channel calculation , MT5 Local Trading copying Easy And Fast Copy , MT4 Easy And Fast Copy , MT5 Local Trading copying For DEMO Easy And Fast Copy , MT4 DEMO Easy And Fast Copy , MT5 DEMO Advanced Bollinger Bands:
1. The Bollinger rail will change color with the direction"
2. The
FREE

VWAP Fibo Bands RSJ is an indicator that traces the lines of the daily VWAP and from it creates bands using Fibonacci proportions. This spectacular indicator creates 10 band levels through the selected VWAP period using Fibonacci ratios.
It is fantastic how the prices respect each level of the bands, where it is possible to realize that almost every time the price closes above / below a level of the bands he will seek the next one. If close above will seek to reach the level above and if close
FREE
Product Description: Swing Points & Liquidity (MT5) What it does:
This indicator automatically identifies significant "Swing Highs" and "Swing Lows" (Fractals) on your chart. It assumes that these points represent Liquidity (where Stop Losses and Buy/Sell stops are resting) or Supply and Demand Zones . When a Swing High is formed, it projects a Red Box/Line to the right (Supply/Resistance). When a Swing Low is formed, it projects a Green Box/Line to the right (Demand/Support). As

Cybertrade Keltner Channels - MT5 Created by Chester Keltner, this is a volatility indicator used by technical analysis. It is possible to follow the trend of financial asset prices and generate support and resistance patterns. In addition, envelopes are a way of tracking volatility in order to identify opportunities to buy and sell these assets.
It works on periods longer than the period visible on the chart. All values are available in the form of buffers to simplify possible automations.
FREE
If you love this indicator, please leave a positive rating and comment, it will be a source of motivation to help me create more products <3 Key Takeaways The Zig Zag Advanced indicator plot points on a chart whenever prices reverse by the percentage the trader sets in the input section. The Zig Zag Advanced indicator lowers the impact of random price fluctuations and is used to identify trends and changes in trends. The indicator lowers noise levels, highlighting trends higher and lower. Th
FREE

# Indicador Daily High - Danilo Monteiro - MT5
## Descrição O Daily High/Low Labels é um indicador personalizado para MetaTrader 5 que exibe automaticamente as máximas e mínimas diárias no gráfico, facilitando a identificação rápida dos níveis importantes de preço. O indicador marca os preços com etiquetas e linhas horizontais, permitindo uma visualização clara dos níveis críticos do dia atual e anterior.
## Principais Características
### 1. Marcação Automática - Exibe automaticamente as máxi
FREE

MT5 için Market Structure Break Out'u tanıtıyoruz – Profesyonel MSB ve Unbroken Zone göstergeniz. MT4 versiyonu da mevcut, buradan kontrol edin: https ://www .mql5 .com /en /market /product /109958 Bu gösterge sürekli olarak güncellenmektedir. Piyasadaki yapı temelli giriş ve çıkış noktalarını yüksek doğrulukla sağlamayı amaçlıyoruz. Şu anda 1.1 sürümündeyiz, aşağıda şu anda katılırsanız yapılmış olan son değişiklikler bulunmaktadır: Alış & Satış Hedefleri: Hem alış hem de satış pozisyonları

This is a multi timeframe version of the Supply and Demand indicator . It allows you to analyze a chart using the law of supply and demand on three different timeframes at a time. You will see zones of sales and purchases and determine the most profitable points to open positions. The indicator is based on the principle of market fractality. Supply and demand zones show places where a strong buyer or seller has made the price reverse and change its direction. The indicator has several types of
FREE
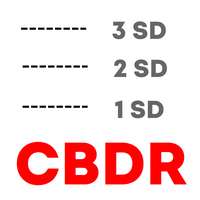
Haven CBDR , ICT "Central Bank Dealers Range" (CBDR) fiyat aralığını grafikte gösteren kullanımı kolay bir göstergedir. Program, CBDR fiyat aralığını vurgulayan dikdörtgenler çizer ve ayrıca destek ve direnç seviyelerini değerlendirmek için standart sapma çizgilerini gösterir. Ürün, CBDR zaman aralığını, görüntülenecek takvim günleri sayısını, renkleri ve grafik öğeleri stillerini yapılandırmanıza olanak tanır ve grafik temasına göre renk şemasını otomatik olarak ayarlar. Ayrıca, gösterge, günlü
FREE

Velocity Renko Heatmap is a separate-window indicator that converts standard time-based price series into Renko-style blocks and colors them by momentum speed. Each block represents a fixed Renko box size, while the color intensity reflects how fast the block was formed relative to recent average formation time. Slow movement appears dim/neutral, fast movement becomes more saturated, enabling quick visual assessment of acceleration and deceleration in trend moves. The indicator is designed for t
FREE

The Swing High Low Indicator is an essential tool for traders who rely on price action. It automatically marks key reversal points (swing highs in red, swing lows in green), helping you visualize trends, spot breakouts, and draw precise trendlines. By highlighting these critical levels, the indicator reveals market structure shifts—whether the trend is strengthening, reversing, or entering consolidation. Perfect for all timeframes and strategies, it turns raw price data into actionable tra
FREE

Indicator determines the direction of price movement, calculates the possibility of entering the market using an internal formula and displays a breakout entry signal. Indicator signals appear both at the beginning of trend movements and in the opposite direction, which allows you to open and close orders as efficiently as possible in any of the market conditions. Version for МТ4: https://www.mql5.com/en/market/product/58349
Benefits: a unique signal calculation formula; high signal accuracy; d
FREE

Piyasada gelişen trendler hakkında uyarı almak için bu göstergeyi kullanın.
Bu göstergeyi kullanarak, piyasada geliştikçe gelişen trendler hakkında uyarılar alabileceksiniz. Bu gösterge, bir trend içindeki girişleri veya çıkışları tanımlamak için kullanılabilir. Gösterge, daha yüksek zaman dilimlerinden gelen bilgileri, bir alış veya satış sinyali vermek için geçerli zaman diliminin fiyat hareketleriyle birleştirir. Gösterge, trend değişikliklerini veya baskın trendin devamlarını belirleyebili
FREE
Advanced Market Analysis Tool. Full Documentation: Download Free Professional Education Course: After purchasing, contact me to receive access to the complete CDV Professional Training Video Course. — It will help you master CDV , Aggressive Buyer & Seller dynamics , and Volume Microstructure concepts through a clear, step-by-step learning process. Overview The Professional CDV with Aggressive Score is a comprehensive volume analysis tool that combines visual Cumulative Delta Volume (CDV)
The Higher timeframe candle tracker is used to get a glimpse of what the selected higher time frame candle is like. It plot the candle after the current price. It can come in handy for day traders and short term traders that often worry about how the current higher timeframe candle may look like. You can select the higher time frame or lower time frame from the options provided: By default the color for bears is red and for bulls is green. You are able to change the width of the candle, its wick
FREE

Phoenix Şamdan Formasyonu Monitörü (MT5)
MetaTrader 5 için gerçek zamanlı şamdan formasyonu algılama ve izleme aracı. Birden fazla sembolde klasik şamdan formasyonlarını otomatik olarak tanımlar ve görsel bir kontrol paneli aracılığıyla kapsamlı formasyon istatistiklerini görüntüler.
Genel Bakış
Phoenix Şamdan Formasyonu Monitörü, Doji, Çekiç, Kayan Yıldız, Boğa Yutan, Ayı Yutan, Sabah Yıldızı, Akşam Yıldızı, Üç Beyaz Asker ve Üç Kara Karga formasyonlarını algılar ve izler. Sistem, aynı anda
FREE

A lot of professional traders use high quality divergence signals as a part of their strategy to enter a position. Spotting correct divergences quickly can often be hard, especially if your eye isn’t trained for it yet. For this reason we’ve created a series of easy to use professional oscillator divergence indicators that are very customisable so you get only the signals you want to trade. We have this divergence indicator for RSI, MACD, Stochastics, CCI and OBV. RSI: https://www.mql5.com/en/
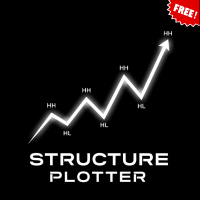
This indicator is designed to automate the process of identifying and visualizing market structure, a cornerstone of price action and Smart Money Concepts (SMC) trading. It intelligently maps the flow of the market by plotting Higher Highs (HH), Higher Lows (HL), Lower Highs (LH), and Lower Lows (LL) directly on your chart. How It Works The indicator's logic is based on detecting pivot swing points using a configurable number of bars to the left and right of a candle. It then uses these pivots t
FREE

This indicator uses the Zigzag indicator to identify swing highs and swing lows in the price chart. Once it has identified the swing highs and swing lows, it can use them to determine potential support and resistance levels. A support level is formed when the price drops and bounces back up from a swing low, indicating that there is buying pressure at that level. A resistance level is formed when the price rises and reverses downward from a swing high, suggesting selling pressure at that level.
FREE
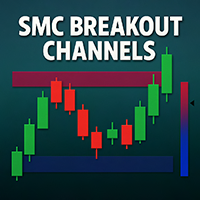
SMC Breakout Channels Anticipate market breakouts with precision.
SMC Breakout Channels automatically detect accumulation and distribution ranges where professional traders (“smart money”) are most active. By combining volatility-based range detection with real-time volume analysis, this tool highlights the key breakout zones that often precede strong directional moves. Advantages Clarity: No clutter, just clean breakout boxes with clear bullish/bearish bias. Early Signals: Detect hidden ac
FREE

For those who appreciate Richard Wyckoff approach for reading the markets, we at Minions Labs designed a tool derived - yes, derived, we put our own vision and sauce into this indicator - which we called Waves PRO . This indicator provides a ZigZag controlled by the market volatility (ATR) to build its legs, AND on each ZigZag leg, we present the vital data statistics about it. Simple and objective. This indicator is also derived from the great book called " The Secret Science of Price and Volum

The Penta-O is a 6-point retracement harmonacci pattern which usually precedes big market movements. Penta-O patterns can expand and repaint quite a bit. To make things easier this indicator implements a twist: it waits for a donchian breakout in the right direction before signaling the trade. The end result is an otherwise repainting indicator with a very reliable trading signal. The donchian breakout period is entered as an input. [ Installation Guide | Update Guide | Troubleshooting | FAQ | A
FREE
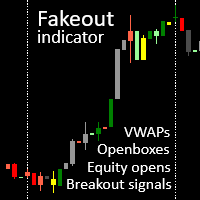
akeout candle indicator with session VWAPs, openboxes and openbox breakout signals. Check out our other products for fxer.net:
https://www.mql5.com/en/market/product/114888
https://www.mql5.com/en/market/product/114890 Main features 1. VWAPS for Tokyo, London and NY sessions 2. Openboxes for Tokyo, London and NY sessions 3. Colored candles for breakouts, fakeouts and inside candles 4. Equity open line 5. Openbox expansions 6. Unmitigated equity open prices for Tokyo, London and NY sessions 7
FREE

This indicator draws trading zones based on fractals from higher periods, which simplifies trading by levels.
This indicator draws two types of trading zones on one chart.
For example, if the current period is H1, then trading zones will be searched for by fractals from H4 and D1.
In the standard settings, fractal zones from H4 will be drawn in yellow, and from D1 - in green.
When zones are superimposed, colors are mixed at the intersection of zones. I don’t know how to fix this at the mome
FREE

Volume Profile Pro Signals
Kesin hacim analizi ve otomatik sinyal üretiminin birleşimi. Ne yapar
Volume Profile Pro Signals, işlem hacminin gerçekten nerede gerçekleştiğine dair canlı, veri odaklı bir görünüm oluşturur — fiyatın kabul edildiği veya reddedildiği piyasa bölgelerini ortaya koyar. POC, VAH, VAL’i vurgular ve HVN/LVN alanlarını hassas şekilde tespit eder. Bunlara dayanarak gerçek zamanlı VAH/VAL breakout sinyalleri üretir ve ATR volatilitesinden akıllı SL/TP seviyelerini çizer. Pr
MetaTrader mağazası, geliştiricilerin alım-satım uygulamalarını satabilecekleri basit ve kullanışlı bir sitedir.
Ürününüzü yayınlamanıza yardımcı olacağız ve size Mağaza için ürününüzün açıklamasını nasıl hazırlayacağınızı anlatacağız. Mağazadaki tüm uygulamalar şifreleme korumalıdır ve yalnızca alıcının bilgisayarında çalıştırılabilir. İllegal kopyalama yapılamaz.
Alım-satım fırsatlarını kaçırıyorsunuz:
- Ücretsiz alım-satım uygulamaları
- İşlem kopyalama için 8.000'den fazla sinyal
- Finansal piyasaları keşfetmek için ekonomik haberler
Kayıt
Giriş yap
Gizlilik ve Veri Koruma Politikasını ve MQL5.com Kullanım Şartlarını kabul edersiniz
Hesabınız yoksa, lütfen kaydolun
MQL5.com web sitesine giriş yapmak için çerezlerin kullanımına izin vermelisiniz.
Lütfen tarayıcınızda gerekli ayarı etkinleştirin, aksi takdirde giriş yapamazsınız.