BoxChart MT5
- Indikatoren
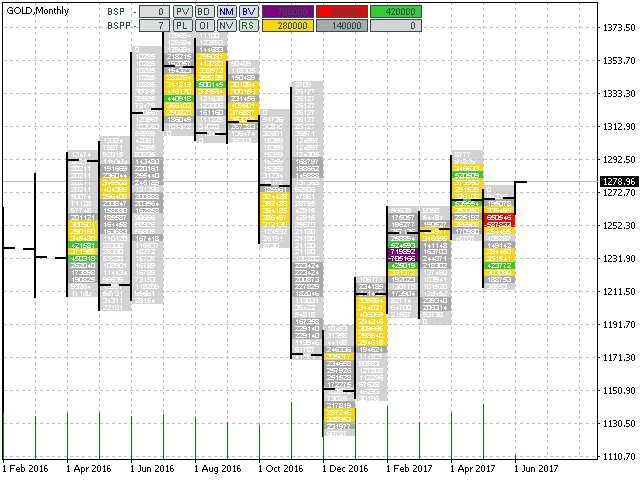
-
Evgeny Shevtsov
 Indicators for volume trading :
Volume profile,
Classic profile,
Clusters chart,
Demand and supply levels,
Demand and supply diagram,
Cumulative delta.
Indicators for probabilistic analysis :
Monte Carlo predictor,
Neural predictor. - Version: 4.4
- Aktualisiert: 30 April 2026
- Aktivierungen: 10
Der Markt ist schon allein deshalb unfair, weil 10 % der Teilnehmer 90 % der Mittel verwalten. Ein gewöhnlicher Händler hat kaum eine Chance, sich gegen diese "Geier" durchzusetzen. Dieses Problem kann gelöst werden. Man muss nur zu diesen 10 % gehören, lernen, ihre Absichten vorherzusehen und sich mit ihnen zu bewegen.
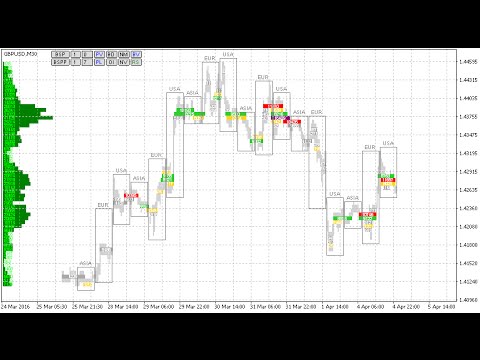
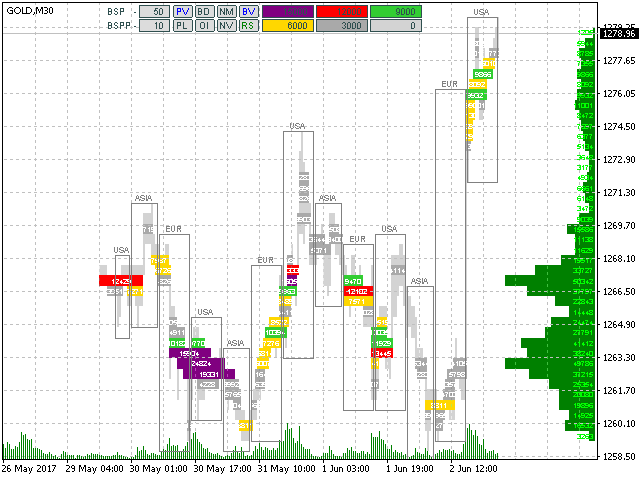
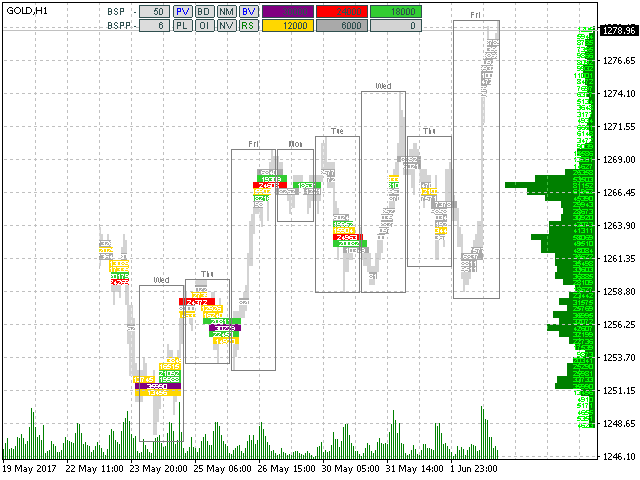
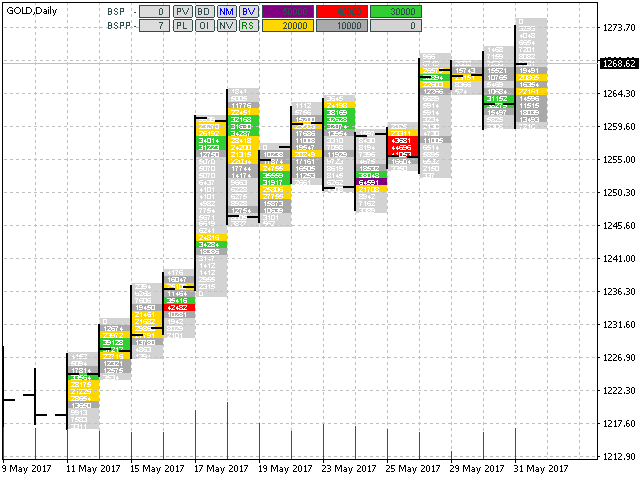
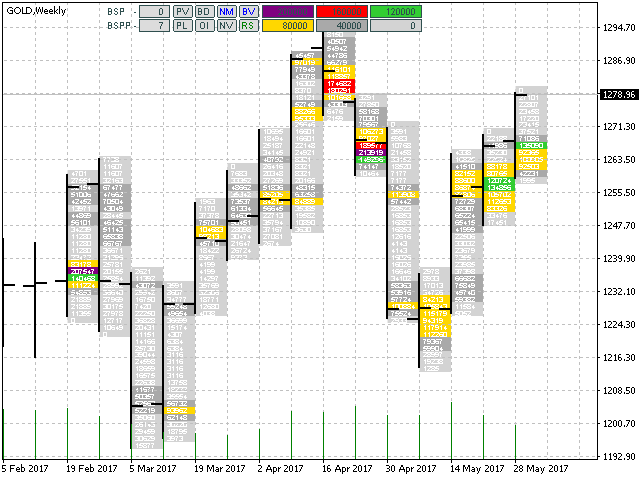
Das Volumen ist der einzige präventive Faktor, der bei jedem Zeitrahmen und Symbol einwandfrei funktioniert. Zuerst erscheint das Volumen und wird kumuliert, und erst dann bewegt sich der Preis. Der Preis bewegt sich von einem Volumen zum anderen. Bereiche, in denen sich das Volumen ansammelt, bilden zuverlässige Unterstützungs-/Widerstandsniveaus und werden regelmäßig vom Kurs "getestet", um die beste Einstiegsmöglichkeit in den Markt zu bieten. Die Methode des Handels mit diesem Indikator besteht darin, von einem starken Bereich zu einem anderen zu wechseln.
Funktionsprinzip des Indikators
Der BoxChart-Indikator berechnet Volumencluster, sortiert sie nach ihrer Vollständigkeit und markiert sie in entsprechenden Farben. Darüber hinaus summiert der Indikator alle Cluster und zeigt das Ergebnis auf der Preisachse als horizontale Volumenskala (das Marktprofil) an.
Der Indikator funktioniert auf allen im Terminal verfügbaren Zeitrahmen, verwendet aber für die Berechnungen historische Daten kleinerer Zeiträume (relativ zum aktuellen) M1, M5, H1, H4 und D1. Bevor Sie den Indikator starten, laden Sie die Historie dieser Zeitrahmen herunter, indem Sie das Diagramm nach links scrollen. Wenn keine Daten vorhanden sind, zeigt der Indikator die entsprechende Meldung an und führt nur dort Zeichnungen durch, wo Daten vorhanden sind.
Der Indikator führt alle Zeichnungen nur im Chart-Ansichtsbereich aus, aber Sie können den Chart zur Historie scrollen. Die Cluster können beim Scrollen des Charts "blinken". Dies ist ein normales Verhalten, da sie neu sortiert werden.
Cluster, die die gleiche Farbe, aber unterschiedliche Länge haben (innerhalb einer einzigen Kurslinie), sind durch ihr Volumen ungefähr gleich.
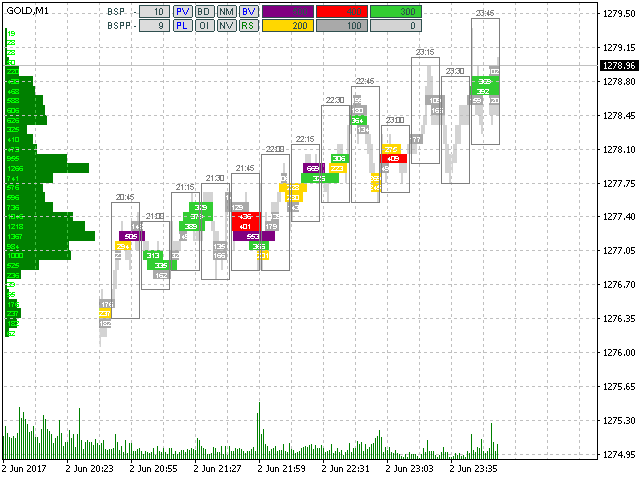
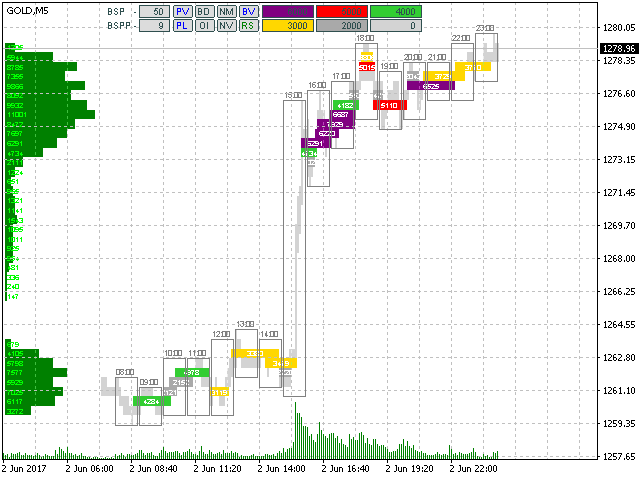
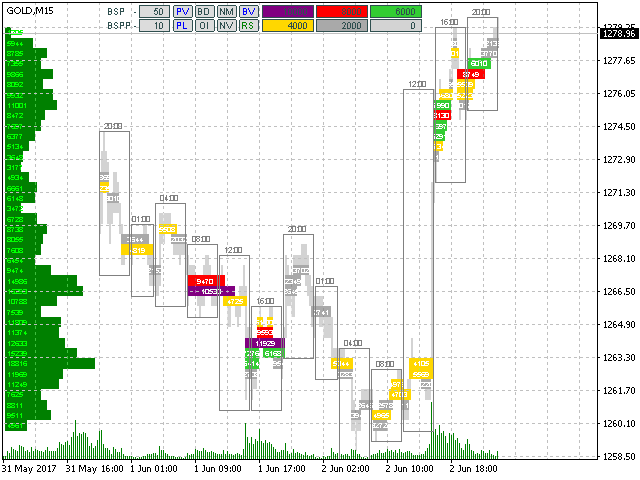
Indikator-Schaltflächen
- BSP - erhöht/verringert einen festen Schritt eines Preisgitters. Wird in "alten" Punkten eingestellt. Ist der Wert 0, wird der Berechnungsschritt von dem mit der BSPP-Schaltfläche eingestellten Parameter übernommen.
- BSPP - Vergrößerung/Verkleinerung eines dynamischen Schrittes eines Preisgitters. Wird in Monitorpixeln eingestellt.
- PV - Aktivieren/Deaktivieren des Volumenprofils.
- PL - Lautstärkeprofil nach links/rechts.
- BD - in diesem Modus enthält jeder Cluster die Volumenkonzentration und nicht das Volumen selbst. Das Cluster-Volumen kann relativ klein oder sogar unmerklich sein, aber seine hohe Konzentration pro Zeiteinheit deutet auf eine hohe Aktivität an dieser Kerze (diesen Kerzen) und auf dem gegebenen Preisniveau hin.
- OI - aktiviert/deaktiviert den Modus des offenen Interesses, der mathematisch durch aufeinanderfolgende Nullsetzung der sich gegenseitig absorbierenden Volumina erhalten wird. Nur die Volumina, die von dieser Operation nicht betroffen sind, werden in den Clustern und im Profil angezeigt.
- NM - aktiviert/deaktiviert den Modus des zeilenweisen Verbindens von benachbarten Clustern.
- VT - Volumenskala:
- VT - Tick-Volumen
- VR - echte Volumina
- VN - ohne Volumen (Volumen werden nach dem TPO-Prinzip emuliert).
- BV - Periodenrahmen aktivieren/deaktivieren.
- RS - Zurücksetzen auf Standardeinstellungen.
Eingaben
- DigitsFontSize - Schriftgröße der Beschriftungen auf Clustern.
- BordersFontSize - Schriftgröße der Beschriftungen oberhalb der Periodenrahmen.
- Die automatische Sortierung von Clustern erfolgt in Schritten von 1/6. Als Ergebnis haben wir sechs Farbabstufungen. Die Farbanpassung dieser Clusterabstufungen kann mit Farbvariablen angepasst werden: LowestBoxColor - bis zu 1/6, LowBoxColor - bis zu 2/6, MiddleBoxColor - bis zu 3/6, MediumBoxColor - bis zu 4/6, HighBoxColor - bis zu 5/6, HighestBoxColor - bis zu 6/6 der maximalen Ansammlung im sichtbaren Bereich.
- Die manuelle Sortierung von Clustern wird vom Benutzer über die folgenden Eingaben eingestellt: HighestBoxValue, HighBoxValue, MediumBoxValue, MiddleBoxValue, LowBoxValue und LowestBoxValue, die das obere Cluster-Volumen-Level festlegen, ab dem das Cluster die entsprechende Farbe erhält.
Die übrigen Eingänge beziehen sich auf andere Farbeinstellungen, und ihr Zweck ist aus ihrem Namen ersichtlich.


Thank you for a great indicator, it gives a lot of information.