Regardez les tutoriels vidéo de Market sur YouTube
Comment acheter un robot de trading ou un indicateur
Exécutez votre EA sur
hébergement virtuel
hébergement virtuel
Test un indicateur/robot de trading avant d'acheter
Vous voulez gagner de l'argent sur Market ?
Comment présenter un produit pour qu'il se vende bien
Indicateurs techniques pour MetaTrader 5 - 12

This indicator uses support and resistance, volume and some special formula to calculate the volume to filter the candles. If the volume reaches a specific value, And at the same time, Candle breaks the support/resistance line, There would be a signal and we can enter the market. Signals appear when the current candle closes. then you can enter the trade when a new candle appears. Please don't forget to follow your money management plan.
MT4 Version Support/Resistance Breakout MT4 : https:/

### Indicator Description: Gradient Heiken Ashi with Momentum Coloring
This indicator is a technical analysis tool designed to overlay on the main chart, helping traders easily identify price trends and momentum through modified Heiken Ashi candles. It combines smoothed candle value calculations based on moving averages with a gradient color system to represent the strength of bullish or bearish trends.
#### 1. Key Features
- Display of Modified Heiken Ashi Candles:
- The indicator draws opt
FREE

ScalpReactor X A Tactical Indicator for Precision Traders The Ritz Scalping Habbit is a powerful MT5 indicator designed to help traders execute disciplined, high-probability trades through clear visual cues and multi-strategy confirmations. Whether you’re an intraday scalper or a swing trader , this tool integrates advanced market analysis into a single, easy-to-use interface. Key Strengths: Smart Buy & Sell Arrows — Based on multi-layer signals from RSI, ATR, EMA, ADX, and price momentum. Colo

The indicator displays volume profiles based on the nesting principle. Profiles periods are pre-set so that each subsequent profile has a length twice as long as the length of the previous profile. In addition to profiles, the indicator displays volume clusters sorted by color, depending on the volume they contain.
Indicator operation features The indicator works on typical timeframes from M5 to MN, but for calculations uses historical data from smaller timeframes: M1 - for timeframes from M5
FREE

Necessary for traders: tools and indicators Waves automatically calculate indicators, channel trend trading Perfect trend-wave automatic calculation channel calculation , MT4 Perfect trend-wave automatic calculation channel calculation , MT5 Local Trading copying Easy And Fast Copy , MT4 Easy And Fast Copy , MT5 Local Trading copying For DEMO Easy And Fast Copy , MT4 DEMO Easy And Fast Copy , MT5 DEMO Advanced Bollinger Bands:
1. The Bollinger rail will change color with the direction"
2. The
FREE

DESCRIPTION
ICSM (Impulse-Correction SCOB Mapper) est l'indicateur qui analyse le mouvement des prix et identifie les impulsions valides, les corrections et les SCOB (Single Candle Order Block). C'est un outil puissant qui peut être utilisé avec tout type d'analyse technique car il est flexible, informatif, facile à utiliser et améliore considérablement la conscience du trader des zones d'intérêt les plus liquides.
PARAMÈTRES
Général | Visuels
Thème de couleur — définit le thème de couleur
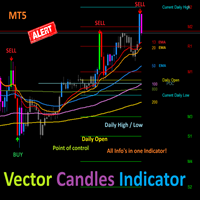
Vector Candles Indicator This is an easy and safe tool for MetaTrader 5 (MT5). It colors candles on your chart based on trading volume to spot trend changes.How to Spot Entry Signals Up Vector Candle: If a green candle with high volume closes (lime or blue color), sell. Price will likely drop back to where the candle started. Down Vector Candle: If a red candle with high volume closes (red or purple color), buy. Price will likely rise back to where the candle started. Detailed setup: Check http
FREE

Dessine automatiquement les niveaux de support et de résistance PLUS les écarts des bougies de propulsion sur votre graphique, afin que vous puissiez voir où le prix est susceptible de se diriger ensuite et/ou de s'inverser potentiellement.
Cet indicateur est conçu pour être utilisé dans le cadre de la méthodologie de trading de position enseignée sur mon site web (The Market Structure Trader) et affiche des informations clés pour le ciblage et les entrées potentielles. MT4 Version: https://w

The famous brazilian trader and analyst Didi Aguiar created years ago a study with the crossing of 3 Simple Moving Averages called "Agulhada do Didi", then later was also named Didi Index, as a separate indicator. The period of those SMAs are 3, 8 and 20. As simple as that, this approach and vision bring an easy analysis of market momentum and trend reversal to those traders looking for objective (and visual) information on their charts. Of course, as always, no indicator alone could be used wit
FREE

This indicator calculates support and resistance prices in multi-timeframe with different formulation and draw them on the chart that style do you choose. And If you want, Indicator can alert you when the current price arrive these pivot levels. Formulations: Classic, Camarilla, Woodie, Demark, Floor, Fibonacci
Alert Options: Send Mobil Message, Send E-mail, Show Message, Sound Alert
Levels: PP, S1, S2, S3, S4, S5, R1, R2, R3, R4, R5, TC, BC and Middle Points Why do you need this indicator:
Ti
FREE

Chart Symbol Changer pour MT5 est un indicateur/utilitaire qui vous offre la possibilité de changer le symbole graphique actuel qui est attaché en cliquant sur un bouton de symbole sur son panneau. Chart Symbol Changer pour MT5 vous donne la possibilité de configurer les 32 boutons de symboles selon vos préférences personnelles, en ajoutant les paires que vous souhaitez surveiller et échanger le plus. De cette façon, vous ne manquerez jamais une opportunité, car vous pouvez avoir une vue
FREE

First time on MetaTrader, introducing IQ Star Lines - an original Vedic Astrology based indicator. "Millionaires don't use astrology, billionaires do" . - J.P. Morgan, Legendary American financier and banker.
IQ Star Lines, an unique astrological indicator purely based on Vedic astrology calculations, published for the first time on Metatrader. This unique tool plots dynamic planetary grid lines based on real-time stars, constellations, and celestial movements, which allows you to plot t

This is a conventional volume indicator, which displays the ticks or real volume (if available from your broker). But it has others features like: 5 color schemes: single, when crossing with moving average, when crossing a specific level, when having different volume between bars and when candle change color. Being hable to have a customizable moving average. Being hable to have a value indicator line. Many thanks to Diego Silvestrin for the ideas to version 1.1 and Konstantin Demidov for
FREE

VWAP Fibo Bands RSJ is an indicator that traces the lines of the daily VWAP and from it creates bands using Fibonacci proportions. This spectacular indicator creates 10 band levels through the selected VWAP period using Fibonacci ratios.
It is fantastic how the prices respect each level of the bands, where it is possible to realize that almost every time the price closes above / below a level of the bands he will seek the next one. If close above will seek to reach the level above and if close
FREE

The VWAP Session Bands indicator is a powerful tool designed for Meta Trader 5. This indicator calculates the Volume Weighted Average Price (VWAP) and its standard deviation bands within customizable daily sessions, offering traders a clear view of price trends and volatility. Unlike traditional VWAP indicators, it ensures smooth, continuous lines across session boundaries by using the previous candle's values for the current (incomplete) bar. Ideal for scalping or day trading on instruments lik
FREE
BoxLevels Pro — Plage du jour précédent & cassures
BoxLevels Pro trace automatiquement la boîte du jour précédent (Haut/Bas) avec ligne médiane et étiquettes, puis détecte les cassures de la session suivante avec des flèches directionnelles. Outil rapide et fluide pour les stratégies de range, breakout et retour à la moyenne. Pourquoi cela fonctionne
La plage d’hier agit souvent comme une zone de liquidité clé. La première cassure nette dans la session suivante peut déclencher de la volatilité
FREE
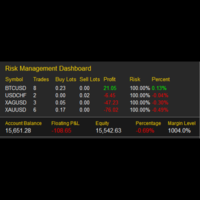
My Risk Management The Risk Management Dashboard is a visual tool designed to help traders monitor risk exposure in real time. With a clear and compact layout, it provides an instant overview of trading activity, enabling more disciplined and informed decision-making. Key Features Active Symbol Summary
Displays all traded symbols with the number of trades, total buy/sell lots, and current profit/loss. Per-Symbol Risk Analysis
Calculates and shows the risk percentage of each symbol relative to
FREE

Le tableau de bord d'alerte RSI / TDI vous permet de surveiller les RSI à la fois (sélectionnables par vous) sur chaque paire majeure que vous négociez.
Vous pouvez l'utiliser de deux manières :
1. Sélectionnez plusieurs périodes et le tiret vous montrera quand il y a plusieurs périodes prolongées au-delà des conditions commerciales normales. Un excellent indicateur que le prix a poussé fort récemment, car il a atteint un niveau de surachat ou de survente sur plusieurs périodes, de sorte qu'

The Weis Waves RSJ Indicator sums up volumes in each wave. This is how we receive a bar chart of cumulative volumes of alternating waves. Namely the cumulative volume makes the Weis wave charts unique. It allows comparing the relation of the wave sequence characteristics, such as correspondence of the applied force (expressed in the volume) and received result (the price progress).
If you still have questions, please contact me by direct message: https://www.mql5.com/en/users/robsjunqueira/
FREE
Product Description: Swing Points & Liquidity (MT5) What it does:
This indicator automatically identifies significant "Swing Highs" and "Swing Lows" (Fractals) on your chart. It assumes that these points represent Liquidity (where Stop Losses and Buy/Sell stops are resting) or Supply and Demand Zones . When a Swing High is formed, it projects a Red Box/Line to the right (Supply/Resistance). When a Swing Low is formed, it projects a Green Box/Line to the right (Demand/Support). As

his is a custom indicator based on double-average crossing and arrow marking.
Make multiple lists when blue arrows appear up.
Make a blank list when the red arrow appears down.
When the pink line crosses the green line upwards, the pink line is above, the green line is below, the golden fork appears, and the blue arrow appears.
When the pink line crosses down through the green line, the pink line is below, the green line is above, a dead fork appears, and a red arrow appears.
This is a goo
FREE

Fermeture de la Journée Précédente et Décalage des Barres pour MetaTrader ! L'indicateur de Fermeture de la Journée Précédente et Décalage des Barres est un outil conçu pour améliorer l'analyse technique et la prise de décision dans le trading. Avec cet indicateur, vous aurez accès à des informations détaillées sur les niveaux d'ouverture, de plus haut, de plus bas et de clôture de n'importe quelle barre, permettant une analyse précise et complète des mouvements du marché. Imaginez avoir la capa
FREE

The Weis Wave first takes the market volume and then organizes it with the price into Wave charts. It is the only software that will present the true picture of the market before you. If anyone of you, has watched an intraday price movement then you must know that it unfolds in a series of selling as well as buying waves-a procedures tearing down and building up. Wave analysis is an integral part of the trading method. The indicator helps to deal with today’s volatile market. Moreover, it works
FREE
If you love this indicator, please leave a positive rating and comment, it will be a source of motivation to help me create more products <3 Key Takeaways The Zig Zag Advanced indicator plot points on a chart whenever prices reverse by the percentage the trader sets in the input section. The Zig Zag Advanced indicator lowers the impact of random price fluctuations and is used to identify trends and changes in trends. The indicator lowers noise levels, highlighting trends higher and lower. Th
FREE

Pro ADX Histogram: Visual Momentum & Trend Strength Indicator Elevate your technical analysis with ADX Histogram, an innovative MetaTrader 5 tool that transforms the classic Average Directional Index (ADX) into an intuitive, visual powerhouse. This indicator combines trend strength and momentum direction into a single, easy-to-read histogram, allowing you to assess market conditions and spot potential trading opportunities faster and with greater clarity. Trading Idea & Core Logic The indicator
FREE
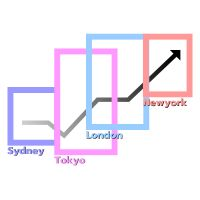
Time Zones and the Forex Market
The Forex market operates continuously 24 hours a day, facilitated by its global distribution across various time zones. The market is anchored by four primary trading centers: Sydney , Tokyo , London , and New York . Each trading center has specific opening and closing times according to its respective time zone. These differences significantly impact market volatility and trading opportunities during each session. Features Enable/Disable Date Display Enable/Di
FREE

Introduction
WaveTrend Plus is an amazing oscillator that can detect optimal entry points in the market with high precision using complex computations of price and momentum. This version packs many improvements compared to the original WaveTrend such as cleaner visuals, oversold/overbought signals and divergence detection
Signal
Buy when oversold signal appear (green dot below) or when a bullish divergence is detected (green dashed line)
Sell when overbought signal appear (red dot above) or
FREE
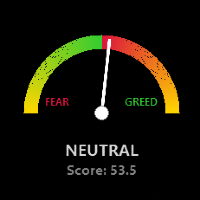
Global Market Risk Sentiment Meter 1. Abstraction The Global Market Risk Sentiment Meter is a sophisticated analytical tool designed for the MetaTrader 5 (MQL5) platform. Unlike traditional indicators that analyze a single asset in isolation, this utility employs an Inter-Market Analysis approach to reconstruct the psychological state of the global financial markets. By aggregating real-time data from US Indices, Global Equities, Cryptocurrencies, and Safe Haven assets (Gold and the US
FREE

The Hybrid Stochastic indicator is a Stochastic RSI described by the famous Tushar Chande and Stanley Kroll in their book called " The New Technical Trader" . The main goal of this indicator is to generate more Overbought and Oversold signals than the traditional Relative Strength indicator (RSI). Combining these 2 indicators expands the range of the overbought and oversold territory. The idea behind it is to use the Stochastic formula over RSI values. If you want to know more about its internal
FREE

The MACD 2 Line Indicator is a powerful, upgraded version of the classic Moving Average Convergence Divergence (MACD) indicator.
This tool is the embodiment of versatility and functionality, capable of delivering comprehensive market insights to both beginner and advanced traders. The MACD 2 Line Indicator for MQL4 offers a dynamic perspective of market momentum and direction, through clear, visually compelling charts and real-time analysis.
Metatrader4 Version | How-to Install Product | How-t
FREE

Better Period Separators For MetaTrader 5 The built-in period separators feature doesn’t allow users to specify the time period, so you can use this indicator to create more customizable period separators. On intraday charts, you could place period separators at a specific time, you could also place extra period separators at a specific time on Monday to mark the start of a week. On higher timeframe charts, this indicator works the same as the built-in period separators, On the daily chart, per
FREE

This indicator is an MQL5 port inspired by the "Cyclic Smoothed RSI" concept originally developed by Dr_Roboto and popularized by LazyBear and LuxAlgo on TradingView. The Cyclic Smoothed RSI (cRSI) is an oscillator designed to address the two main limitations of the standard RSI: lag and fixed overbought/oversold levels. By using digital signal processing (DSP) based on market cycles, the cRSI reduces noise without sacrificing responsiveness. It features Adaptive Bands that expand and contract
FREE
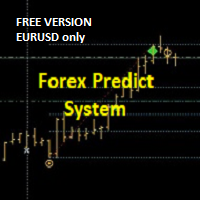
+++++++++++++++++++++++++++++
+++ FREE VERSION - EURUSD ONLY
+++++++++++++++++++++++++++++
Please add PREFIX and/or SUFFIX via settings if your Broker Chart Symbol is different (e.g. suffix = .r).
+++
This is forecast system.
On the moment of the breakout/forecast: the indicator draws retrace zone (yellow) and three targets. The levels act as support and resistance. It can be used on all pairs/indices/timeframes/periods. For the higher timeframes (H4, H1, M30) it's better to engage at Optima
FREE

WickSniper Pro – Precision Reversal Indicator for Smart Traders ===============================================================
WickSniper Pro is a powerful **non-repainting** price action indicator that detects **inside bar breakout reversals** with sniper-like accuracy. Whether you're a scalper, swing trader, or day trader, WickSniper Pro helps you catch high-probability turning points in the market using clean, intuitive signals.
Key Features ------------ - Non-Repainting – Once a signa
FREE

PO3 FIBONACCI GOLDBACH - The Definitive Indicator for Market Analysis
Unlock the Secrets of the Market with the Perfect Fusion of Advanced Mathematics and Intelligent Trading!
---
EXCLUSIVE FEATURES:
1. UNIQUE GOLDBACH LEVELS SYSTEM · Automatic identification of Order Blocks (OB), Fair Value Gaps (FVG), Liquidity Voids (LV), and Mitigation Blocks (MB). · Precise calculation of rejection blocks (RB) and equilibrium zones (EQ) based on the Goldbach Conjecture. · 111.1% and -11.1
Advanced Market Analysis Tool. Full Documentation: Download Free Professional Education Course: After purchasing, contact me to receive access to the complete CDV Professional Training Video Course. — It will help you master CDV , Aggressive Buyer & Seller dynamics , and Volume Microstructure concepts through a clear, step-by-step learning process. Overview The Professional CDV with Aggressive Score is a comprehensive volume analysis tool that combines visual Cumulative Delta Volume (CDV)
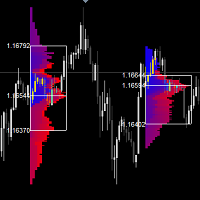
L'indicateur Profil de Marché est une solution classique pour afficher un profil de marché. Il permet d'afficher la distribution statistique des prix au fil du temps, la zone de coût et la valeur de contrôle d'une séance de trading sur le graphique. Cet indicateur peut être associé à des graphiques sur n'importe quelle unité de temps et peut afficher le profil de marché pour un ensemble complet de séances, y compris un profil dans un rectangle librement défini. Les unités de temps courtes offre
FREE
The Trend Duration Forecast MT5 indicator is designed to estimate the probable lifespan of a bullish or bearish trend. Using a Hull Moving Average (HMA) to detect directional shifts, it tracks the duration of each historical trend and calculates an average to forecast how long the current trend is statistically likely to continue. This allows traders to visualize both real-time trend strength and potential exhaustion zones with exceptional clarity. KEY FEATURES Dynamic Trend Detection: Utiliz
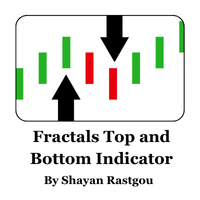
Discover the power of fractals to uncover significant market reversals! This custom Fractals Indicator for MetaTrader 5 is designed to help traders quickly and effectively spot potential swing highs and lows, providing visual cues that make trading decisions easier. Key Features: Clear Buy & Sell Signals: Green and red arrows highlight bullish and bearish fractals, helping you effortlessly identify significant price pivots. Customizable Analysis Depth: Choose the number of bars to evaluate for f
FREE

Moving Average Trend Alert is a triple MA indicator that helps traders to identify potential market trends based on 3 MAs alignment and crossover.
Moving Average Trend Alert features: Customizable short-term, medium-term, and long-term MAs. Option to filter signals based on a minimum distance between moving averages to avoid premature MAs alignment. Optional Filter of signals with RSI indicator overbought/oversold levels. Optional Filter of signals with ADX indicator. Popup, email, and phone no
FREE

No Wick Candles is a powerful price action indicator that identifies candles with no upper or lower wick (also known as Marubozu candles ) and automatically draws horizontal compensation lines from their open price with a "Compensation" label . These wickless candles represent strong momentum and are often used by professional traders as key support/resistance zones . The indicator helps you visualize potential reversal or continuation zones instantly. Key Features Detects Bullish (no lower wick
FREE

Indicateur Avancé de Calendrier Économique Cet indicateur affiche directement sur le graphique tous les événements économiques futurs pertinents pour la paire de devises ou l’instrument sélectionné. Il permet d’anticiper les périodes de forte volatilité et de planifier les stratégies de trading avec plus de précision. Fonctionnalités principales Affichage des événements futurs jusqu’à 5 jours à l’avance (paramétrable). Filtrage par niveau d’impact des nouvelles (élevé, moyen, faible). Option pou
FREE

YOU CAN NOW DOWNLOAD FREE VERSIONS OF OUR PAID INDICATORS . IT'S OUR WAY OF GIVING BACK TO THE COMMUNITY ! >>> GO HERE TO DOWNLOAD
More About Advanced Currency Meter Every good forex system has the following basic components: Ability to recognize the trend direction. Ability to identify the strength of the trend and answer the basic question Is the market trending or is it in a range? Ability to identify safe entry points that will give a perfect risk to reward (RR) ratio on every position.
FREE

The original author is David Weis, an expert in the Wyckoff Method. The Weis Wave is a modern adaptation of the 1930's Wyckoff Method, another expert in Tape Reading techniques and Chart Analysis. Weis Waves takes market volume and stacks it into waves according to price conditions giving the trader valuable insights about the market conditions. If you want to learn more about this subject you can find tons of videos in YouTube. Just look for "The Wickoff Method", "Weis Wave" and "Volume Spread
FREE

Closing Price Reversal is a very well known and traded candlestick pattern. This little indicator paints with specific (user-selected) colors the Closing Price Reveral Up and Down patterns, as well as the Inside Bars (as a bonus). Higher timeframes are more effective as with all other candlesticks patterns. Do NOT trade solely on this indicator. Search the web for "Closing Price Reversal" to learn about the several approaches that can be used with this pattern. One of them is combining short/me
FREE
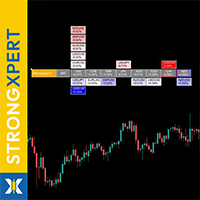
CLIQUEZ ICI POUR VOIR TOUS MES PRODUITS GRATUITS
StrongXpert est ton outil précis de suivi en temps réel de la force des devises sur le marché mondial. Il a été conçu pour te montrer où le capital entre réellement - et d’où il sort du marché . L’indicateur mesure la force relative des huit principales devises (USD, EUR, GBP, JPY, AUD, CAD, CHF, NZD) et transforme des mouvements de prix complexes en un tableau de bord visuel simple et lisible - directement sur le graphique. Identifie en quelque
FREE

OrderFlow Vision – Institutional Market Structure Visualizer OrderFlow Vision is a Smart Money Concepts (SMC) indicator designed to automatically detect and display institutional price structure directly on the chart.
It identifies and marks Order Blocks , Fair Value Gaps (FVGs) , Break of Structure (BOS) , and Change of Character (CHOCH) in real time, helping traders understand how price moves in relation to liquidity, imbalances, and structural shifts.The indicator works across all symbols and
FREE
Reversal Pattern AI — an absolute breakthrough in the world of indicator development, combining artificial intelligence algorithms, multi-level market analysis, and classical methods of technical analysis. It not only detects reversal patterns but also evaluates market inefficiencies, generating highly accurate trading signals. Thanks to a hybrid model that uses price action analysis, Volumes, Volatility, VWAP, and Volume AVG %, the indicator easily adapts to any market conditions.

TILLSON MOVING AVERAGE Également appelé indicateur TMA ou T3. Il s'agit d'une moyenne mobile qui utilise EMA et DEMA dans sa formule et est calculée avec une expansion binomiale du 3e degré. ... int handle1; //Handle of the Tillson TMA T3.EX5 custom indicator double euBuff1[]; int TMAperiod= 12 ; int TMSshift= 0 ; double VolumeFactor= 0.618 ; int OnInit () { ... handle1= iCustom ( NULL , PERIOD_CURRENT , "Market\\Tillson TMA T3.EX5" ,0,TMAperiod,0,0,TM
FREE

Parce que le style compte
Je sais combien il est ennuyeux de cliquer à chaque fois sur les propriétés pour changer la couleur de la bougie, l'arrière-plan en clair ou foncé, et mettre ou enlever la grille. Voici la solution en un seul clic : Trois boutons personnalisables pour choisir le style de bougie que les commerçants souhaitent. Un bouton pour passer du mode Jour au mode Nuit. Un bouton pour afficher ou masquer la grille sur les graphiques. ***** Dans les paramètres, vous pouvez choisir
FREE
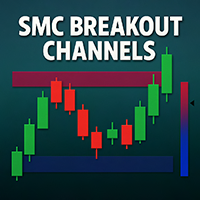
SMC Breakout Channels Anticipate market breakouts with precision.
SMC Breakout Channels automatically detect accumulation and distribution ranges where professional traders (“smart money”) are most active. By combining volatility-based range detection with real-time volume analysis, this tool highlights the key breakout zones that often precede strong directional moves. Advantages Clarity: No clutter, just clean breakout boxes with clear bullish/bearish bias. Early Signals: Detect hidden ac
FREE

For those traders who really care about Volume as an important vector information on Price Action, here is an exclusive idea & creation from Minions Labs: Volume Speed . The Volume Speed indicator shows you visually how much time (in seconds, minutes, hours, you choose) the Volume took to reach the Average Volume of the past bars. This way you can have the exact idea of "what is happening right now with the Volume of the current bar..." and take action accordingly with your strategy, having even
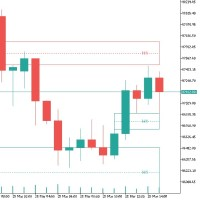
Déséquilibres en trading : bases et stratégies Un déséquilibre en trading est un phénomène qui se produit lorsqu’il existe un déséquilibre entre l’offre et la demande sur le marché. Cela peut se manifester par un excédent d’ordres d’achat (déséquilibre haussier) ou de vente (déséquilibre baissier), ce qui entraîne une tarification inefficace et crée des opportunités pour les traders. Aspects techniques « Modèle de chandelier » : un déséquilibre est souvent représenté par un modèle à trois bougie
FREE

Panneau Phoenix Candle Timer (MT5)
Compte à rebours en temps réel pour MetaTrader 5. Affiche le temps restant précis dans la bougie actuelle afin d'améliorer le timing d'exécution et la discipline de trading.
Objectif
Un timing précis des bougies est essentiel pour les traders discrétionnaires et les stratégies algorithmiques. Entrer trop tôt ou trop tard dans une bougie peut avoir un impact sur le risque, l'exposition au spread et la validité du signal.
Le panneau Phoenix Candle Timer offre
FREE

"BIG FIGURE INDICATOR" identifie et dessine automatiquement des lignes horizontales sur les graphiques de prix à des niveaux spécifiques, tels que des nombres entiers ou des demi-chiffres (par exemple, 1,0000 ou 1,5000 dans le commerce des devises). Ces niveaux sont considérés comme psychologiquement significatifs car ils représentent des chiffres ronds sur lesquels les grands traders et les investisseurs peuvent se concentrer, conduisant à des niveaux de support ou de résistance potentiels. Ce
FREE
Daily & Composite Volume Profile This is a professional-grade market profile tool designed for MetaTrader 5. It utilizes a Dual-Profile System to visualize supply, demand, and liquidity concentrations. Key Features Left Side: Daily Session Profiles Automatically identifies the start and end of every trading day. Generates a unique Volume Profile for each individual day. Allows you to see how value migrated from yesterday to today (e.g., Is today's volume higher or lower than yesterday?).
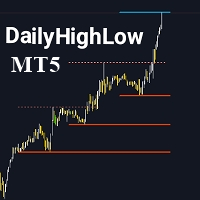
N'oubliez pas de noter l'indicateur afin de m'aider en visibilité.
L'indicateur DailyHighLow pour MetaTrader 5 (MT5) est un outil sophistiqué pour suivre les mouvements de prix quotidiens. Conçu pour les traders ayant besoin d'informations claires et exploitables sur les plus hauts et les plus bas du marché, cet indicateur trace automatiquement des lignes de tendance basées sur les prix les plus élevés et les plus bas sur une période personnalisable. Principales Caractéristiques : Personnalisat
FREE

CPR Pivot Lines It Will Draw Pivot Point R1,R2,R3 S1,S2,S3 Tc Bc Best Part Is That You Can Even Add Values Of High,Low,Close Manually Also To Get Your All Levels On Chart.So If Your Broker Data Of High ,Low ,Close Is Incorrect Then You Don’t Have To Depend On Them Anymore. You Can Even Modify All Lines Style. It Will Show Line In Floting Style And Not Continues Mess.
FREE

Graphique des secondes pour MetaTrader 5
Les indicateurs vous permettent de créer des graphiques dans le terminal MetaTrader 5 avec une période en secondes. Le délai sur un tel graphique est défini en secondes, et non en minutes ou en heures. Ainsi, vous pouvez créer des graphiques avec une période inférieure à M1. Par exemple, S15 est une période d’une période de 15 secondes. Vous pouvez appliquer des indicateurs, des conseillers experts et des scripts au graphique résultant.
Vous obtenez un

Linear Regression Channel Pro The ultimate tool for statistical trend analysis. Automatically identifies the "Fair Value" of price and volatility extremes. Overview Linear Regression Channel Pro is a professional-grade indicator that automatically draws and updates the Linear Regression Channel for the current market trend. Unlike standard indicators that curve like Bollinger Bands, this tool draws precise straight-line channels based on the "Least Squares" mathematical method. It is designed fo
FREE

KT Custom High Low shows the most recent highs/lows by fetching the data points from multi-timeframes and then projecting them on a single chart. If two or more highs/lows are found at the same price, they are merged into a single level to declutter the charts.
Features
It is built with a sorting algorithm that declutters the charts by merging the duplicate values into a single value. Get Highs/Lows from multiple timeframes on a single chart without any fuss. Provide alerts when the current pri

The Pivot Point indicator automatically calculates and displays the pivot point line and support and resistance levels. Pivot can be calculated according to the Classic, Floor, Fibonacci, Woodie, Camarilla or DeMark formula. It is also possible to select the period for calculating the indicator. A trader can choose from daily, weekly, monthly, or user-defined periods.
Types of pivots Classic Floor Fibonacci Woodie Camarilla DeMark
Main features The indicator shows the current and historic
FREE
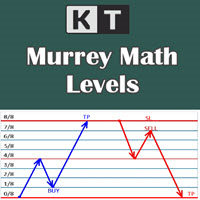
It shows the Murrey Math levels on chart and also provides an alert when price touch a particular level. T. Henning Murrey, in 1995, presented a trading system called Murrey Math Trading System, which is based on the observations made by W.D Gann.
Applications
For Murrey Math lovers, this is a must-have indicator in their arsenal. There is no need to be present on the screen all the time. Whenever the price touches a level, it will send an alert. Spot upcoming reversals in advance by speculatin

ZPOWER BUY & SELL INDICATOR
Trade Smarter. Trade Confidently. Trade Profitably.
Are you tired of second-guessing your trades? Do you enter late and exit too early — leaving money on the table? It’s time to upgrade your strategy with the ZPOWER BUY & SELL INDICATOR, built with institutional-grade logic that helps you catch high-probability trade setups with precision.
Why ZPOWER is Different
Unlike ordinary indicators that flood your charts with noise, ZPOWER is engineered with advanced
FREE

A Heatmap with a Volume Profile is like a thermal imager or x-ray machine. It will help you to estimate the relative distribution of volume during the price movement and to understand the relationship between volume and price. Indicator Volume Profile "Volumos Maxima" is a powerful tool for analyzing this relationship. After simple experimentation with heatmap, you can find that each trading instrument has its own “ characteristic ” way of distributing volume. And this will help you to make a b
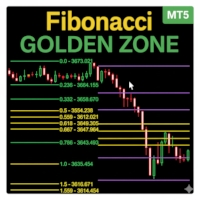
L’Indicateur Fibonacci Sessions est un outil de trading puissant conçu pour le scalping de précision et les stratégies intrajournalières. Il trace automatiquement les principaux niveaux de Fibonacci pour les sessions de New York, Londres et Asie, offrant aux traders une vision claire de la dynamique des prix à travers les marchés majeurs. Des « Zones Dorées » uniques sont mises en évidence dans chaque session, là où le prix réagit le plus. Cela crée des zones hautement fiables pour les retour
FREE

Heikin Ashi RSI Indicator for MT5 (HARSI) Overview
The Heikin Ashi RSI (HARSI) indicator combines Heikin Ashi candle smoothing with RSI momentum analysis, providing a dual-layer view of price action and relative strength. It offers a clear visualization of market direction, RSI-based overbought and oversold conditions, and optional backtesting and alert systems for strategy validation and trade signal automation. How It Works
The indicator applies RSI values to Heikin Ashi calculations, creati
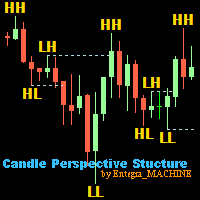
Candle Perspective Structure Indicator MT5 is a simple indicator that defines and displays the candlestick structure of the market. This indicator will suit both experienced traders and beginners who find it difficult to follow the structure visually.
If you want to see more high-quality products or order the development/conversion of your own products, visit my partners' website: 4xDev
Get 10% OFF on manual strategies automation services or indicator development/conversion services at 4xDev
FREE

MT4 Version MA Ribbon MT5 MA Ribbon is an enhanced indicator with 8 moving averages of increasing periods. MA Ribbon is useful to recognize trend direction, reversals and continuation points in the market as well as potential entry, partial take profit and exit points. Entry points for long and shorts position can be found when the price entries or leaves the Ribbon, at retest or a defined number of MA crossovers. It offers a good combination with mostly any volume or momentun indicators to
Supertrend G5 Indicator Supertrend G5 is a high-performance trend-following tool designed to accurately identify market reversal points. By displaying a color-coded line directly on the chart, this indicator helps you quickly recognize bullish trends (green) and bearish trends (red), supporting optimal entry and exit points. Key Features: Clear Buy/Sell Signals Buy when the Supertrend line changes from red to green (beginning of an uptrend). Sell when the Supertrend line changes from green to re
FREE
Découvrez comment acheter un robot de trading sur le MetaTrader Market, le magasin d'applications de la plateforme MetaTrader.
e système de paiement de MQL5.community prend en charge les transactions via PayPal, les cartes bancaires et les systèmes de paiement populaires. Nous vous recommandons vivement de tester le robot de trading avant de l'acheter, pour une meilleure expérience client.
Vous manquez des opportunités de trading :
- Applications de trading gratuites
- Plus de 8 000 signaux à copier
- Actualités économiques pour explorer les marchés financiers
Inscription
Se connecter
Si vous n'avez pas de compte, veuillez vous inscrire
Autorisez l'utilisation de cookies pour vous connecter au site Web MQL5.com.
Veuillez activer les paramètres nécessaires dans votre navigateur, sinon vous ne pourrez pas vous connecter.