
Visualisierung von Strategien in MQL5: Verteilung der Optimierungsergebnisse auf die Kriteriendiagramme

Inhalt
- Einführung
- Arbeitsprinzip
- Klassen für unsere Aufgaben bilden
- Registerkarte Kontrolle
- Klasse der Tabelle
- Klasse Fortschrittsbalken
- Klasse für das Statistik-Diagramm
- Klasse für die Frame-Darstellung
- Funktionalität mit Expert Advisor verbinden
- Schlussfolgerung
Einführung
mql5.com enthält so viele Informationen, dass Sie bei jedem Durchblättern von Artikelkatalogen, Referenzinformationen oder eines Lehrbuchs mit Sicherheit etwas Neues und Interessantes für sich selbst finden werden.
Dies ist dieses Mal der Fall. Ich bin auf einen einfachen und auf den ersten Blick unkomplizierten Artikel gestoßen, der den Strategie-Tester kurz beschreibt. Alles scheint einfach zu sein und ist schon seit langem bekannt, aber... Aber der letzte Teil des Artikels hat mich neugierig gemacht. Es schlägt vor, einfach einen kleinen Code mit dem Expert Advisor zu verbinden, einige Standard-Handler hinzuzufügen und... und der übliche Optimierer von MetaTrader 5 Plattform Strategie-Tester verwandelt sich in einen visuellen. Hm... Das ist interessant.
Ich begann zu studieren und die Dinge zu ordnen. Daraus entstand die Idee, das Erscheinungsbild leicht zu verbessern und eine Funktion zur Anzeige der Optimierungsergebnisse zu erweitern.
So geht's: Der Expert Advisor öffnet ein neues Fenster mit fünf Registerkarten. Die erste enthält ein Chart aller Durchgänge, in dem jeder neue Durchgang mit einer Saldenkurve angezeigt wird. Die anderen vier Registerkarten werden ebenfalls Diagramme enthalten, aber erst nach Abschluss der Optimierung verfügbar sein. Auf jeder dieser Registerkarten werden Daten zu den drei besten Durchgänge nach einem der vier Optimierungskriterien angezeigt. Und auf jeder Registerkarte gibt es zwei Tabellen: mit den Ergebnissen des Optimierungsdurchgangs und den Einstellungen des Expert Advisors für diesen Durchgang:
- Registerkarte Optimierung:
- eine Tabelle der Optimierungsergebnisse für den nächsten Durchgang,
- eine Tabelle mit den Eingabeparametern von EA für diesen Durchgang,
- Saldentabelle des aktuell abgeschlossenen Optimierungsdurchgangs,
- Schaltfläche Replay (Wiederholen), um die durchgeführte Optimierung erneut abzuspielen.
- Registerkarte Sharpe Ratio:
- eine Tabelle der Optimierungsergebnisse für den ausgewählten Durchgang (einer der drei besten nach dem Sharpe-Koeffizienten),
- eine Tabelle mit den Eingabeparametern des Expert Advisors für den ausgewählten Durchgang (einer der drei besten nach dem Sharpe-Koeffizienten),
- Saldenkurve der drei besten Optimierungsläufe nach dem Sharpe-Koeffizienten.
- Ein Kippschalter (drei Positionen) zur Auswahl eines der drei besten Optimierungsergebnisse anhand des Sharpe-Koeffizienten.
- Registerkarte Nettogewinn:
- eine Tabelle der Optimierungsergebnisse für den ausgewählten Durchgang (einer der drei besten nach Gesamtgewinn),
- eine Tabelle mit den Eingabeparametern des Expert Advisors für den ausgewählten Durchgang (einer der drei besten nach Gesamtgewinn),
- Saldenkurve der drei besten Optimierungen nach dem Total Profit.
- Ein Kippschalter (drei Positionen) zur Auswahl eines der drei besten Optimierungsergebnisse nach Gesamtgewinn.
- Registerkarte „Profit Factor“:
- eine Tabelle mit den Optimierungsergebnissen für den ausgewählten Durchgang (einer der drei besten nach Rentabilität),
- eine Tabelle mit den Eingabeparametern des Expert Advisors für den ausgewählten Durchgang (einer der drei besten nach Rentabilität),
- Saldenkurve der drei besten Optimierungsdurchgänge nach Rentabilität,
- Ein Kippschalter (drei Positionen) zur Auswahl eines der drei besten Optimierungsergebnisse nach Rentabilität.
- Registerkarte „Recovery Factor“ (Erholungsfaktor):
- eine Tabelle mit den Optimierungsergebnissen für den ausgewählten Durchgang (einer der drei besten nach Erholungsfaktor),
- eine Tabelle mit den Eingabeparametern des Expert Advisors für den ausgewählten Durchgang (einer der drei wichtigsten nach Wiederherstellungsfaktor),
- Saldenkurve der drei besten Optimierungsdurchgänge nach dem Erholungsfaktor,
- Ein Kippschalter (drei Positionen) zur Auswahl eines der drei besten Optimierungsergebnisse nach dem Erholungsfaktor.
Um eine Reihe von Registerkarten zu implementieren, erstellen wir Kontrollklassen, aus denen sich das Registersteuerelement zusammensetzt. Überspringen wir den Prozess der Erstellung von Steuerelementen in diesem Artikel, indem wir einfach eine fertige Klassendatei anbieten. In den folgenden Artikeln werden wir auf die Beschreibung solcher Klassen zurückkommen, um einige Steuerelemente zu erstellen, die in Zukunft nützlich sein könnten.
Um Informationen über Übergabeparameter anzuzeigen, wollen wir Tabellenklassen in einer vorgefertigten Form aus dem Artikel „SQLite-Fähigkeiten in MQL5: Beispiel für ein Dashboard mit Handelsstatistiken nach Symbolen und magischen Zahlen“ übernehmen und verfeinern die Tabellenklassen leicht, um Tabellen zu erstellen und Text in ihren Zellen bequemer auszugeben.
Um die Idee umzusetzen, nehmen wir den Code für die Arbeit mit den Optimierungen, die dem oben genannten Artikel beigefügt sind, und erstellen darauf aufbauend unsere eigenen Klassen, wobei wir versuchen, das Konzept so weit wie möglich beizubehalten. Da im Artikel nicht beschrieben wird, wie man mit Frames und dem Expert Advisor im Frame-Modus arbeitet, wollen wir hier versuchen, dieses System zu verstehen.
Arbeitsprinzip
Schauen wir uns das MQL5-Tutorial an und sehen wir uns an, was es über die Funktionsweise des Strategietesters und seines Optimierers sagt:
... Eine besonders wichtige Funktion des Testers ist die Multithreading-Optimierung, die mit lokalen und verteilten (vernetzten) Agentenprogrammen, auch im MQL5 Cloud Network, durchgeführt werden kann. Ein einzelner Testlauf (mit bestimmten EA-Eingabeparametern), der vom Nutzer manuell gestartet wird, oder einer der vielen Läufe, die durch die Optimierung verursacht werden (wenn die Parameterwerte innerhalb bestimmter Bereiche iteriert werden), wird in einem separaten Agentenprogramm durchgeführt. Technisch gesehen handelt es sich um die Datei metatester64.exe, und Kopien ihrer Prozesse sind während des Tests und der Optimierung im Windows Task-Manager verfügbar. Aus diesem Grund ist der Tester multithreaded.
Das Terminal ist der Ausführungsmanager, der die Aufgaben an lokale und entfernte Agenten verteilt. Er startet bei Bedarf selbst lokale Agenten. Während der Optimierung werden standardmäßig mehrere Agenten gestartet – ihre Anzahl entspricht der Anzahl der Prozessorkerne. Nach Abschluss der nächsten Aufgabe, die darin besteht, den Expert Advisor mit den angegebenen Parametern zu testen, gibt der Agent die Ergebnisse an das Terminal zurück.
Jeder Agent schafft seine eigene Handels- und Softwareumgebung. Alle Agenten sind voneinander und vom Client-Terminal isoliert.
Wie aus der Beschreibung hervorgeht, wird jede Instanz des zu testenden EA auf einem eigenen Testagenten gestartet, und jeder Durchlauf – seine endgültigen Daten – werden vom Agenten an das Terminal gesendet.
Es gibt eine Reihe von Handlern für den Datenaustausch zwischen dem Terminal und den Agenten:
- OnTesterInit() – wird in Expert Advisors aufgerufen, wenn das TesterInit-Ereignis eintritt, um die notwendigen Aktionen vor dem Start der Optimierung im Strategietester durchzuführen.
- OnTester() – wird in Expert Advisors aufgerufen, wenn das Tester-Ereignis eintritt, um die notwendigen Aktionen nach Abschluss der Prüfung durchzuführen.
- OnTesterPass() – wird in Expert Advisors aufgerufen, wenn TesterPass einen neuen Daten-Frame während der Optimierung des Expert Advisors verarbeitet.
- OnTesterDeinit() – wird in Expert Advisors aufgerufen, wenn das TesterDeinit-Ereignis eintritt, um notwendige Aktionen nach Abschluss der EA-Optimierung durchzuführen.
Wenn der EA einen der Handler OnTesterInit(), OnTesterDeinit() (diese beiden Handler arbeiten immer paarweise – Sie können nicht nur einen von ihnen haben), OnTesterPass() hat, dann wird der Experte in einem separaten Terminalfenster in einem speziellen Frame-Modus gestartet:
Um den Optimierungsprozess und die Übertragung beliebiger Anwendungsergebnisse von Agenten zum Terminal zu verwalten (zusätzlich zu den Handelsindikatoren), gibt es in MQL5 3 spezielle Ereignisse: OnTesterInit, OnTesterDeinit, OnTesterPass. Durch die Beschreibung der Handler im Code kann der Programmierer die erforderlichen Aktionen vor Beginn der Optimierung, nach Abschluss der Optimierung und nach Abschluss der einzelnen Optimierungsläufe durchführen.
Alle Handler sind optional. Die Optimierung läuft auch ohne sie. Es sollte auch klar sein, dass alle 3 Ereignisse nur während der Optimierung funktionieren, aber nicht in einem einzigen Test.
Der Expert Advisor mit diesen Handlern wird automatisch auf einem separaten Terminal-Chart mit dem im Tester angegebenen Symbol und Zeitraum geladen. Diese Kopie des Expert Advisors handelt nicht, sondern führt nur Serviceaktionen durch. Alle anderen Event-Handler laufen darin nicht, insbesondere OnInit, OnDeinit, onTick.
Während der Optimierung arbeitet nur eine Instanz des Expert Advisors im Terminal und nimmt bei Bedarf eingehende Frames entgegen. Um aber noch einmal deutlich zu machen, dass eine solche Instanz des Expert Advisors nur gestartet wird, wenn einer der drei beschriebenen Ereignisbehandlungen in seinem Code vorhanden ist.
Nachdem jeder einzelne Durchlauf des Optimierers abgeschlossen ist, wird das Ereignis OnTester() in der Instanz des EA, die auf dem Agenten läuft, erzeugt. Über den Handler dieses Ereignisses können Sie Daten über einen Durchgang an den Expert Advisor senden, der auf einem separaten Chart in einem speziellen Frame-Modus läuft. Das Datenpaket über den abgeschlossenen Durchlauf, das an den Expert Advisor auf dem Chart gesendet wird, wird als Frame bezeichnet. Sie enthält Informationen über die Nummer des Durchgangs, die Werte der EA-Eingabevariablen, mit denen der Durchgang gestartet wurde, und die Ergebnisse dieses Durchgangs.
Alle diese Daten werden an den Expert Advisor gesendet, und ein Ereignis von TesterPass wird in der ihm erzeugt, das in der Ereignisbehandlung von OnTesterPass() verarbeitet wird, in dem wir die Pass-Daten lesen und beliebige Aktionen durchführen können (in diesem Fall zum Beispiel ein Balance-Chart dieses Passes zeichnen und andere Service-Aktionen durchführen).
Um Daten über den Durchlauf vom Agenten an den Expert Advisor auf dem Chart im Terminal zu senden, sollte man die Funktion FrameAdd() verwenden. Der aktuelle Frame (abgeschlossener Durchlauf) wird vom Agenten an den Expert Advisor gesendet und wird dort bereits im OnTesterPass() behandelt.
Wie Sie sehen können, arbeiten einige Funktionen auf dem Agenten in der EA-Instanz, die darin läuft, und einige arbeiten im Expert Advisor auf dem Terminal-Chart, der im Frame-Modus läuft. Aber sie müssen natürlich alle im EA-Code beschrieben werden.
Die Abfolge der EA-Operationen und unserer Aktionen bei der Datenübertragung zwischen dem Agenten und dem Terminal ist daher wie folgt:
- In OnTesterInit (eine Instanz des Expert Advisors auf dem Chart im Terminal) müssen alle grafischen Konstruktionen vorbereitet werden – ein separater Chart, auf dem der EA im Frame-Modus läuft, und der Inhalt dieses Charts: ein Chart des Balance-Charts, Tabellen mit Parametern und Ergebnissen, ein Tab-Control-Objekt und Schaltflächen zur Auswahl von Aktionen auf Tabs;
- In OnTester (eine Expert Advisor-Instanz auf dem Agenten) müssen alle Informationen über den abgeschlossenen Durchlauf gesammelt werden – das Saldoergebnis jeder abschließenden Transaktion muss in ein Array geschrieben werden, die empfangenen Ergebnisse dieses Durchlaufs müssen in ein Array geschrieben werden, und alle diese Daten müssen mit FrameAdd() an den EA gesendet werden;
- In OnTesterPass (eine Expert Advisor-Instanz auf dem Chart im Terminal) empfangen wir den nächsten vom Agenten gesendeten Frame mit FrameAdd(), lesen seine Daten und zeichnen eine Saldenkurve auf dem Chart, erstellen ein Frame-Objekt und speichern es in einem Array für die anschließende Sortierung und Auswahl nach Optimierungskriterien;
- Die Handler OnTesterDeinit und OnChartEvent (eine Expert Advisor-Instanz auf dem Chart im Terminal) arbeiten mit den Optimierungsdaten nach deren Abschluss – eine wiederholte Generierung des Optimierungsprozesses, die die besten Ergebnisse zu bestimmten Optimierungskriterien zeigt.
Klassen für unsere Aufgaben bilden
Um das Tab Control zu erstellen, wurde eine Datei mit einer Reihe von Controls Controls.mqh erstellt. Die Datei ist am Ende des Artikels angehängt und sollte direkt in dem Ordner platziert werden, in den wir den Test-EA schreiben werden, zum Beispiel im Terminalverzeichnis \MQL5\Experts\FrameViewer\Controls.mqh.
Wir werden hier nicht jede erstellte Klasse eines jeden Steuerelements betrachten. Geben wir einen kurzen Überblick.
Insgesamt wurden zehn Klassen für acht unabhängige Kontrollen eingerichtet:
| # | Class | Übergeordnete Klasse | Beschreibung | Zuweisung |
|---|---|---|---|---|
| 1 | CBaseCanvas | CObject | Zeichnen der Basisklasse | Die Basis-Leinwand. Sie enthält Methoden zum Einstellen und Ändern der Größe und Position, zum Ausblenden und Anzeigen |
| 2 | CPanel | CBaseCanvas | Panel-Klasse | Sie enthält Methoden zum Einstellen und Ändern von Farben und Mausereignishandler. Sie ermöglicht das Anhängen von Child-Controls |
| 3 | CLabel | CPanel | Klasse der Textbeschriftung | Sie druckt einen Text auf der Leinwand in den eingestellten Koordinaten |
| 4 | CButton | CLabel | Einfache Schaltflächenklasse | Eine normale Schaltfläche mit einem nicht fixierten Zustand. Sie reagiert auf Schweben und Mausklicks, indem es die Farbe ändert |
| 5 | CButtonTriggered | CButton | Klasse der Zwei-Wege-Tasten | Eine Schaltfläche mit zwei Zuständen: Ein/Aus. Sie reagiert auf Hovering, Mausklicks und eine Änderung des Zustands, indem sie die Farbe ändert |
| 6 | CTabButton | CButtonTriggered | Tabulator-Schaltflächenklasse | Eine Zwei-Wege-Schaltfläche mit fehlender Umrandung an der Kreuzung mit dem Tabulatorfeld |
| 7 | CButtonSwitch | CPanel | Toggle-Button-Klasse | Ein Bedienfeld mit zwei oder mehr Zwei-Wege-Tasten, von denen nur eine den Status Ein haben kann. Sie ermöglicht Ihnen, neue Schaltflächen zu den bestehenden hinzuzufügen. |
| 8 | CTabWorkArea | CObject | Arbeitsbereichsklasse der Registerkarte | Ein Objekt, das zwei grundlegende Zeichenklassen hat – für den Hintergrund und den Vordergrund. |
| 9 | CTab | CPanel | Tab-Objektklasse | Ein Panel mit einer Schaltfläche und einem Feld. Der Arbeitsbereich befindet sich auf dem Registerkartenfeld, auf dem die Zeichnung stattfindet. |
| 10 | CTabControl | CPanel | Die Klasse des TabControl-Objekts | Ein Panel, mit dem Sie Registerkartenobjekte hinzufügen und verwalten können. |
Nachdem das Kontrollobjekt erfolgreich erstellt wurde, muss seine Create()-Methode für jedes der Objekte aufgerufen werden, wobei seine Koordinaten und Abmessungen angegeben werden. Danach ist das Element einsatzbereit.
Das Steuerelement, das implementierte Ereignishandler enthält, sendet Nutzerereignisse an die Kontrollprogrammkarte, mit deren Hilfe festgestellt werden kann, was in dem Objekt geschehen ist:
| # | Class | Ereignis | ID | lparam | dparam | sparam |
|---|---|---|---|---|---|---|
| 1 | CButton | Klicken Sie auf das Objekt | (ushort)CHARTEVENT_CLICK | X-Koordinate des Cursors | Y-Koordinate des Cursors | Name des Schaltflächenobjekts |
| 2 | CButtonTriggered | Klicken Sie auf das Objekt | (ushort)CHARTEVENT_CLICK | X-Koordinate des Cursors | Y-Koordinate des Cursors | Name des Schaltflächenobjekts |
| 3 | CTabButton | Klicken Sie auf das Objekt | (ushort)CHARTEVENT_CLICK | X-Koordinate des Cursors | Y-Koordinate des Cursors | Name des Schaltflächenobjekts |
| 4 | CButtonSwitch | Klicken Sie auf die Schaltfläche Objekt | (ushort)CHARTEVENT_CLICK | Schaltfläche ID | 0 | Objektname umschalten |
Die Tabelle zeigt, dass zur Vereinfachung des Codes kein Verweis vom Tab Control auf das Chart des Nutzerereignisprogramms vorhanden ist. Wenn das Programm eine Reaktion auf das Umschalten der Tabulatoren erfordert, können wir das Ereignis durch Klicken auf den TabButton bestimmen. Über den Namen der Schaltfläche können wir die Nummer der Registerkarte herausfinden oder den Index der ausgewählten Registerkarte vom TabControl-Objekt abfragen usw.
Auf jeden Fall werden wir in Zukunft solche Klassen bei der Erstellung verschiedener Steuerelemente, die für die Verwendung in unseren Programmen nützlich sind, im Detail analysieren.
Jetzt müssen wir die im Artikel vorgestellte Tabellenklasse leicht verfeinern, die heruntergeladen werden sollte (Datei Dashboard.mqh), nur den Code der Tabellenklasse aus der Datei kopieren (Zeilen 12 – 285) und den kopierten Code im Ordner \MQL5\Experts\FrameViewer\ in der Datei Table.mqh speichern.
Fügen wir die Klasse hinzu, damit die Arbeit mit Tabellen und tabellarischen Daten ein wenig bequemer wird.
Verbinden wir mit der Datei eine Datei der Klasse eines dynamischen Arrays von Zeigern auf Instanzen der Klasse CObject und ihrer Abkömmlinge CArrayObj und eine Datei der Klasse zur vereinfachten Erstellung von nutzerdefinierten Zeichnungen CCanvas:
//+------------------------------------------------------------------+
//|                                                        Table.mqh |
//|                                  Copyright 2025, MetaQuotes Ltd. |
//|                                             https://www.mql5.com |
//+------------------------------------------------------------------+
#property copyright "Copyright 2025, MetaQuotes Ltd."
#property link      "https://www.mql5.com"

#include <Arrays\ArrayObj.mqh>
#include <Canvas\Canvas.mqh>
Dem privaten Abschnitt der Tabellenzellenklasse fügen wir neue Variablen hinzu, um die Breite, Höhe und Farbe des Textes in der Zelle zu speichern:
//+------------------------------------------------------------------+
//| Table cell class                                                 |
//+------------------------------------------------------------------+
class CTableCell : public CObject
  {
private:
   int               m_row;                     // Row
   int               m_col;                     // Column
   int               m_x;                       // X coordinate
   int               m_y;                       // Y coordinate
   int               m_w;                       // Width
   int               m_h;                       // Height
   string            m_text;                    // Text in the cell
   color             m_fore_color;              // Text color in the cell
public:
Im öffentlichen Abschnitt fügen wir Methoden zum Lesen und Setzen neuer Eigenschaften sowie eine Methode hinzu, die den in die Zelle geschriebenen Text auf dem angegebenen Canvas-Objekt ausgibt:
public:
//--- Methods for setting values
   void              SetRow(const uint row)     { this.m_row=(int)row;  }
   void              SetColumn(const uint col)  { this.m_col=(int)col;  }
   void              SetX(const uint x)         { this.m_x=(int)x;      }
   void              SetY(const uint y)         { this.m_y=(int)y;      }
   void              SetXY(const uint x,const uint y)
                       {
                        this.m_x=(int)x;
                        this.m_y=(int)y;
                       }
   void              SetWidth(const uint w)     { this.m_w=(int)w;      }
   void              SetHeight(const uint h)    { this.m_h=(int)h;      }
   void              SetSize(const uint w,const uint h)
                       {
                        this.m_w=(int)w;
                        this.m_h=(int)h;
                       }
   void              SetText(const string text) { this.m_text=text;     }

//--- Methods for getting values
   int               Row(void)            const { return this.m_row;    }
   int               Column(void)         const { return this.m_col;    }
   int               X(void)              const { return this.m_x;      }
   int               Y(void)              const { return this.m_y;      }
   int               Width(void)          const { return this.m_w;      }
   int               Height(void)         const { return this.m_h;      }
   string            Text(void)           const { return this.m_text;   }

//--- Prints the text written in cell properties to the canvas, the pointer to which is passed to the method
   void              TextOut(CCanvas *canvas, const int x_shift, const int y_shift, const color bg_color=clrNONE, const uint flags=0, const uint alignment=0)
                       {
                        if(canvas==NULL)
                           return;
                        //--- Remember current font flags
                        uint flags_prev=canvas.FontFlagsGet();
                        //--- Set background color
                        uint clr=(bg_color==clrNONE ? 0x00FFFFFF : ::ColorToARGB(bg_color));
                        //--- Fill in the cell with the set background color (erase the previous label)
                        canvas.FillRectangle(this.m_x+1, this.m_y+1, this.m_x+this.m_w-1, this.m_y+this.m_h-1, clr);
                        //--- Set font flags
                        canvas.FontFlagsSet(flags);
                        //--- Print text in the cell
                        canvas.TextOut(this.m_x+x_shift, this.m_y+y_shift, this.m_text, ::ColorToARGB(this.m_fore_color), alignment);
                        //--- Return previously memorized font flags and update canvas
                        canvas.FontFlagsSet(flags_prev);
                        canvas.Update(false);
                       }

//--- A virtual method for comparing two objects
Am Ende der Klassenauflistung implementieren wir eine neue Table-Control-Klasse:
//+------------------------------------------------------------------+
//| Table control class                                              |
//+------------------------------------------------------------------+
class CTableDataControl : public CTableData
  {
protected:
   uchar             m_alpha;
   color             m_fore_color;

//--- Converts RGB to color
   color             RGBToColor(const double r,const double g,const double b) const;
//--- Writes RGB component values to variables
   void              ColorToRGB(const color clr,double &r,double &g,double &b);
//--- Returns color component (1) Red, (2) Green, (3) Blue
   double            GetR(const color clr)      { return clr&0xff ;                    }
   double            GetG(const color clr)      { return(clr>>8)&0xff;                 }
   double            GetB(const color clr)      { return(clr>>16)&0xff;                }

//--- Returns a new color
   color             NewColor(color base_color, int shift_red, int shift_green, int shift_blue);

public:
//--- Returns a pointer to itself
   CTableDataControl*Get(void)                                 { return &this;         }

//--- (1) Sets, (2) returns transparency
   void              SetAlpha(const uchar alpha)               { this.m_alpha=alpha;   }
   uchar             Alpha(void)                         const { return this.m_alpha;  }

//--- Draws (1) a background grid, (2) with automatic cell size
   void              DrawGrid(CCanvas *canvas,const int x,const int y,const uint header_h,const uint rows,const uint columns,const uint row_size,const uint col_size,
                              const color line_color=clrNONE,bool alternating_color=true);
   void              DrawGridAutoFill(CCanvas *canvas,const uint border,const uint header_h,const uint rows,const uint columns,const color line_color=clrNONE,bool alternating_color=true);

//--- Prints (1) a text message, (2) a filled rectangle at the specified coordinates
   void              DrawText(CCanvas *canvas,const string text,const int x,const int y,const color clr=clrNONE,const uint align=0,const int width=WRONG_VALUE,const int height=WRONG_VALUE);
   void              DrawRectangleFill(CCanvas *canvas,const int x,const int y,const int width,const int height,const color clr,const uchar alpha);


//--- Constructors/Destructor
                     CTableDataControl (const uint id) : CTableData(id), m_fore_color(clrDimGray), m_alpha(255) {}
                     CTableDataControl (void) : m_alpha(255) {}
                    ~CTableDataControl (void) {}
  };
//+------------------------------------------------------------------+
//| Draws background grid                                            |
//+------------------------------------------------------------------+
void CTableDataControl::DrawGrid(CCanvas *canvas,const int x,const int y,const uint header_h,const uint rows,const uint columns,const uint row_size,const uint col_size,
                                 const color line_color=clrNONE,bool alternating_color=true)
  {
//--- Clear all lists of the tabular data object (delete cells from rows and all rows)
   this.Clear();
//--- Row height cannot be less than 2
   int row_h=int(row_size<2 ? 2 : row_size);
//--- Row width cannot be less than 2
   int col_w=int(col_size<2 ? 2 : col_size);

//--- Left coordinate (X1) of the table
   int x1=x;
//--- Calculate X2 coordinate (on the right) depending on the number of columns and their width
   int x2=x1+col_w*int(columns>0 ? columns : 1);
//--- Y1 coordinate is located under the panel header area
   int y1=(int)header_h+y;

//--- Calculate Y2 coordinate (from below) depending on the number of rows and their height
   int y2=y1+row_h*int(rows>0 ? rows : 1);
//--- Set coordinates of the table
   this.SetCoords(x1,y1-header_h,x2,y2-header_h);

//--- Get color of grid lines of table, either by default or passed to method
   color clr=(line_color==clrNONE ? C'200,200,200' : line_color);
//--- Draw table border
   canvas.Rectangle(x1,y1,x2,y2,::ColorToARGB(clr,this.m_alpha));
//--- In a loop by table rows
   for(int i=0;i<(int)rows;i++)
     {
      //--- calculate Y coordinate of next horizontal grid line (Y coordinate of next row of table)
      int row_y=y1+row_h*i;
      //--- if the flag of "alternating" row colors is passed and the row is even
      if(alternating_color && i%2==0)
        {
         //--- lighten background color of table and draw a background rectangle
         color new_color=this.NewColor(clr,45,45,45);
         canvas.FillRectangle(x1+1,row_y+1,x2-1,row_y+row_h-1,::ColorToARGB(new_color,this.m_alpha));
        }
      //--- Draw horizontal grid line of table
      canvas.Line(x1,row_y,x2,row_y,::ColorToARGB(clr,this.m_alpha));

      //--- Create new table row object
      CTableRow *row_obj=new CTableRow(i);
      if(row_obj==NULL)
        {
         ::PrintFormat("%s: Failed to create table row object at index %lu",(string)__FUNCTION__,i);
         continue;
        }
      //--- Add it to list of rows of tabular data object
      //--- (if failed to add object, delete created object)
      if(!this.AddRow(row_obj))
         delete row_obj;
      //--- Set Y coordinate in created row object, given offset from panel header
      row_obj.SetY(row_y-header_h);
     }

//--- In loop by table columns
   for(int i=0;i<(int)columns;i++)
     {
      //--- calculate X coordinate of next vertical grid line (X coordinate of next table column)
      int col_x=x1+col_w*i;
      //--- If grid line has gone beyond panel, break cycle
      if(x1==1 && col_x>=x1+canvas.Width()-2)
         break;
      //--- Draw vertical grid line of table
      canvas.Line(col_x,y1,col_x,y2,::ColorToARGB(clr,this.m_alpha));

      //--- Get the number of created rows from tabular data object
      int total=this.RowsTotal();
      //--- In loop through table rows
      for(int j=0;j<total;j++)
        {
         //--- get next row
         CTableRow *row=this.GetRow(j);
         if(row==NULL)
            continue;
         //--- Create new table cell
         CTableCell *cell=new CTableCell(row.Row(),i);
         if(cell==NULL)
           {
            ::PrintFormat("%s: Failed to create table cell object at index %lu",(string)__FUNCTION__,i);
            continue;
           }
         //--- Add created cell to row
         //--- (if failed to add object, delete created object)
         if(!row.AddCell(cell))
           {
            delete cell;
            continue;
           }
         //--- In created cell object, set its X coordinate and Y coordinate from row object.
         cell.SetXY(col_x,row.Y());
         cell.SetSize(col_w, row_h);
        }
     }
//--- Update canvas without redrawing chart
   canvas.Update(false);
  }
//+------------------------------------------------------------------+
//| Draws background grid with automatic cell size                   |
//+------------------------------------------------------------------+
void CTableDataControl::DrawGridAutoFill(CCanvas *canvas,const uint border,const uint header_h,const uint rows,const uint columns,const color line_color=clrNONE,bool alternating_color=true)
  {
//--- X1 coordinate (left) of table
   int x1=(int)border;
//--- X2 coordinate (right) of table
   int x2=canvas.Width()-(int)border-1;
//--- Y1 coordinate (top) of table
   int y1=int(header_h+border-1);
//--- Y2 coordinate (lower) of table
   int y2=canvas.Height()-(int)border-1;
//--- Set coordinates of table
   this.SetCoords(x1,y1,x2,y2);

//--- Get color of grid lines of table, either by default or passed to method
   color clr=(line_color==clrNONE ? C'200,200,200' : line_color);
//--- If indentation from edge of panel is greater than zero, draw border of table
//--- otherwise, panel border acts as table border
   if(border>0)
      canvas.Rectangle(x1,y1,x2,y2,::ColorToARGB(clr,this.m_alpha));

//--- Height of entire table grid
   int greed_h=y2-y1;
//--- Calculate row height depending on table height and number of rows
   int row_h=(int)::round((double)greed_h/(double)rows);
//--- In loop through number of rows
   for(int i=0;i<(int)rows;i++)
     {
      //--- calculate Y coordinate of next horizontal grid line (Y coordinate of next row of table)
      int row_y=y1+row_h*i;
      //--- if the flag of "alternating" row colors is passed and the row is even
      if(alternating_color && i%2==0)
        {
         //--- lighten background color of table and draw a background rectangle
         color new_color=this.NewColor(clr,45,45,45);
         canvas.FillRectangle(x1+1,row_y+1,x2-1,row_y+row_h-1,::ColorToARGB(new_color,this.m_alpha));
        }
      //--- Draw horizontal grid line of table
      canvas.Line(x1,row_y,x2,row_y,::ColorToARGB(clr,this.m_alpha));

      //--- Create new table row object
      CTableRow *row_obj=new CTableRow(i);
      if(row_obj==NULL)
        {
         ::PrintFormat("%s: Failed to create table row object at index %lu",(string)__FUNCTION__,i);
         continue;
        }
      //--- Add it to list of rows of tabular data object
      //--- (if failed to add object, delete created object)
      if(!this.AddRow(row_obj))
         delete row_obj;
      //--- Set Y coordinate in created row object, given offset from panel header
      row_obj.SetY(row_y-header_h);
     }

//--- Width of table grid
   int greed_w=x2-x1;
//--- Calculate column width depending on table width and number of columns
   int col_w=(int)::round((double)greed_w/(double)columns);
//--- In loop by table columns
   for(int i=0;i<(int)columns;i++)
     {
      //--- calculate X coordinate of next vertical grid line (X coordinate of next table column)
      int col_x=x1+col_w*i;
      //--- If this is not the very first vertical line, draw it
      //--- (the first vertical line is either table border or panel border)
      if(i>0)
         canvas.Line(col_x,y1,col_x,y2,::ColorToARGB(clr,this.m_alpha));

      //--- Get the number of created rows from tabular data object
      int total=this.RowsTotal();
      //--- In loop through table rows
      for(int j=0;j<total;j++)
        {
         //--- get next row
         CTableRow *row=this.GetRow(j);
         if(row==NULL)
            continue;
         //--- Create new table cell
         CTableCell *cell=new CTableCell(row.Row(),i);
         if(cell==NULL)
           {
            ::PrintFormat("%s: Failed to create table cell object at index %lu",(string)__FUNCTION__,i);
            continue;
           }
         //--- Add created cell to row
         //--- (if failed to add object, delete created object)
         if(!row.AddCell(cell))
           {
            delete cell;
            continue;
           }
         //--- In created cell object, set its X coordinate and Y coordinate from row object.
         cell.SetXY(col_x,row.Y());
         cell.SetSize(col_w, row_h);
        }
     }
//--- Update canvas without redrawing chart
   canvas.Update(false);
  }
//+------------------------------------------------------------------+
//| Returns color with new color component                           |
//+------------------------------------------------------------------+
color CTableDataControl::NewColor(color base_color, int shift_red, int shift_green, int shift_blue)
  {
   double clR=0, clG=0, clB=0;
   this.ColorToRGB(base_color,clR,clG,clB);
   double clRn=(clR+shift_red  < 0 ? 0 : clR+shift_red  > 255 ? 255 : clR+shift_red);
   double clGn=(clG+shift_green< 0 ? 0 : clG+shift_green> 255 ? 255 : clG+shift_green);
   double clBn=(clB+shift_blue < 0 ? 0 : clB+shift_blue > 255 ? 255 : clB+shift_blue);
   return this.RGBToColor(clRn,clGn,clBn);
  }
//+------------------------------------------------------------------+
//| Converts RGB to color                                            |
//+------------------------------------------------------------------+
color CTableDataControl::RGBToColor(const double r,const double g,const double b) const
  {
   int int_r=(int)::round(r);
   int int_g=(int)::round(g);
   int int_b=(int)::round(b);
   int clr=0;
   clr=int_b;
   clr<<=8;
   clr|=int_g;
   clr<<=8;
   clr|=int_r;
//---
   return (color)clr;
  }
//+------------------------------------------------------------------+
//| Retrieving RGB component values                                  |
//+------------------------------------------------------------------+
void CTableDataControl::ColorToRGB(const color clr,double &r,double &g,double &b)
  {
   r=GetR(clr);
   g=GetG(clr);
   b=GetB(clr);
  }
//+------------------------------------------------------------------+
//| Prints text message to specified coordinates                     |
//+------------------------------------------------------------------+
void CTableDataControl::DrawText(CCanvas *canvas,const string text,const int x,const int y,const color clr=clrNONE,const uint align=0,const int width=WRONG_VALUE,const int height=WRONG_VALUE)
  {
//--- Declare variables to record width and height of text in them
   int w=width;
   int h=height;
//--- If width and height of text passed to method have zero values,
//--- entire canvas space is completely erased with transparent color
   if(width==0 && height==0)
      canvas.Erase(0x00FFFFFF);
//--- Otherwise
   else
     {
      //--- If passed width and height have default values (-1), get its width and height from text
      if(width==WRONG_VALUE && height==WRONG_VALUE)
         canvas.TextSize(text,w,h);
      //--- otherwise,
      else
        {
         //--- if width passed to method has default value (-1), get width from text, or
         //--- if width passed to method has value greater than zero, use width passed to method, or
         //--- if width passed to method has zero value, use value 1 for width
         w=(width ==WRONG_VALUE ? canvas.TextWidth(text)  : width>0  ? width  : 1);
         //--- if height passed to method has default value (-1), get height from text, or
         //--- if height passed to method has value greater than zero, use height passed to method, or
         //--- if height passed to method has zero value, use value 1 for height
         h=(height==WRONG_VALUE ? canvas.TextHeight(text) : height>0 ? height : 1);
        }
      //--- Fill space according to specified coordinates and by resulting width and height with transparent color (erase previous entry)
      canvas.FillRectangle(x,y,x+w,y+h,0x00FFFFFF);
     }
//--- Print text in place cleared of previous text and update workspace without redrawing screen
   canvas.TextOut(x,y,text,::ColorToARGB(clr==clrNONE ? this.m_fore_color : clr),align);
   canvas.Update(false);
  }
//+------------------------------------------------------------------+
//| Prints filled rectangle to specified coordinates                 |
//+------------------------------------------------------------------+
void CTableDataControl::DrawRectangleFill(CCanvas *canvas,const int x,const int y,const int width,const int height,const color clr,const uchar alpha)
  {
   canvas.FillRectangle(x,y,x+width,y+height,::ColorToARGB(clr,alpha));
   canvas.Update();
  }
//+------------------------------------------------------------------+
Diese Klasse enthält die Methoden, deren Prinzip im Artikel „Erstellen eines Dashboards zur Anzeige von Daten in Indikatoren und EAs“ im Abschnitt Beschreibung des Informationspanels beschrieben wurde. In dem genannten Artikel gehörten die Methoden zum Panel-Objekt. Hier sind sie in einer separaten Klasse untergebracht, die von der Tabellenklasse abgeleitet wurde.
Alle tabellarischen Datenobjekte haben hier den Klassentyp CTableDataControl, ein Tabellensteuerungsobjekt, mit dem sich Tabellen schnell steuern lassen.
Schauen wir uns an, was wir in dem vor langer Zeit erschienenen Artikel zum Herunterladen und Verbinden mit dem Expert Advisor aufgefordert wurden:
Und der letzte „Höhepunkt der Aufführung“ ist die Arbeit mit Optimierungsergebnissen! Musste ein Händler bisher Daten aufbereiten, um die Ergebnisse zu verarbeiten, sie irgendwo hochladen und an anderer Stelle weiterverarbeiten, so kann er dies nun „ohne die Kasse zu verlassen“ tun – während der Optimierung selbst. Um diese Funktion zu demonstrieren, benötigen wir mehrere Include-Dateien, in denen die einfachsten Beispiele einer solchen Verarbeitung implementiert wurden.
Laden Sie die an den Artikel angehängten Dateien mit der Erweiterung MQH in den Ordner MQL5\Include hoch. Nehmen Sie einen beliebigen EA und fügen Sie diesen Block am Ende ein:
//--- connect code to work with optimization results
#include <FrameGenerator.mqh>
//--- frame generator
CFrameGenerator fg;
//+------------------------------------------------------------------+
//| Tester function                                                  |
//+------------------------------------------------------------------+
double OnTester()
  {
//--- here insert your own function to calculate optimization criterion
   double TesterCritetia=MathAbs(TesterStatistics(STAT_SHARPE_RATIO)*TesterStatistics(STAT_PROFIT));
   TesterCritetia=TesterStatistics(STAT_PROFIT)>0?TesterCritetia:(-TesterCritetia);
//--- call at each end of testing and pass optimization criterion as parameter
   fg.OnTester(TesterCritetia);
//---
   return(TesterCritetia);
  }
//+------------------------------------------------------------------+
//| TesterInit function                                              |
//+------------------------------------------------------------------+
void OnTesterInit()
  {
//--- prepare chart for displaying balance charts
   fg.OnTesterInit(3); //parameter sets number of balance lines on chart
  }
//+------------------------------------------------------------------+
//| TesterPass function                                              |
//+------------------------------------------------------------------+
void OnTesterPass()
  {
//--- handle test results and display graphics
   fg.OnTesterPass();
  }
//+------------------------------------------------------------------+
//| TesterDeinit function                                            |
//+------------------------------------------------------------------+
void OnTesterDeinit()
  {
//--- completing optimization
   fg.OnTesterDeinit();
  }
//+------------------------------------------------------------------+
//|  Event handling on chart                                         |
//+------------------------------------------------------------------+
void OnChartEvent(const int id,const long &lparam,const double &dparam,const string &sparam)
  {
   //--- starts playback of frames upon completion of optimization when clicking on header
   fg.OnChartEvent(id,lparam,dparam,sparam,100); // 100 - this is pause in ms between frames
  }
//+------------------------------------------------------------------+
Als Beispiel wurde ein standardmäßig gelieferter EA Moving Averages.mq5 genommen. Fügen wir den Code ein und speichern den Expert Advisor unter folgendem Namen: Moving Averages With Frames.mq5. Kompilieren und Optimierung durchführen.
Gehen Sie zum Ende des Artikels und sehen Sie sich die angehängten Dateien an. Es gibt dort vier Dateien mit der Erweiterung *.mqh. Laden Sie sie hoch und sortieren Sie sie:
- specialchart.mqh (7.61 KB) – eine Klasse eines speziellen Charts, auf dem die Gleichgewichtslinien jedes Prüfers und die Saldenkurve bei der Reproduktion des abgeschlossenen Optimierungsprozesses eingezeichnet sind;
- colorprogressbar.mqh (4.86 KB) – eine Fortschrittsbalkenklasse, die den Optimierungsprozess anzeigt und während der Optimierung mit farbigen Spalten gefüllt wird. Grün steht für eine gewinnbringende Serie, rot für eine Verlustserie, die sich am unteren Rand eines speziellen Charts befindet;
- simpletable.mqh (10.74 KB) – eine Klasse einer einfachen Tabelle, die die Daten jedes Optimierungsdurchgangs anzeigt – das erzielte Ergebnis und die Werte der EA-Konfigurationsparameter, mit denen der EA bei diesem Durchgang gestartet wurde. Links neben den Charts eines speziellen Charts befinden sich zwei Tabellen;
- framegenerator.mqh (14.88 KB) – eine Klasse für den Datenaustausch zwischen dem Testagenten und dem Terminal und die Anzeige von Informationen auf einem speziellen Chart. Sie ist die Hauptklasse für die Implementierung der visuellen Optimierung.
Auf der Grundlage der gewonnenen Erkenntnisse beschließen wir, folgende Maßnahmen zu ergreifen: (1) eine Fortschrittsbalkenklasse, (2) eine spezielle Chart-Klasse und (3) eine Frame-Betrachterklasse. Wir haben bereits eine Klasse von Tabellen (4), sie wurde in den Ordner des zukünftigen Expert Advisors hochgeladen und leicht modifiziert.
Die Einführung einer weiteren kleinen Klasse, einer Frame-Klasse (5), ist erforderlich. Was ist der Zweck der Maßnahme? Wir werden für jedes der vier Optimierungskriterien – Sharpe Ratio, Gesamtgewinn, Rentabilität und Erholungsfaktor – die Charts der drei besten Durchgänge auswählen und anzeigen. Es ist praktisch, dies zu tun, wenn wir eine Liste von Objekten haben, die auf der Grundlage der Klasse eines dynamischen Arrays von Zeigern auf Instanzen der Klasse CObject und ihrer Abkömmlinge der Standardbibliothek erstellt wurden. Es genügt, die Liste nach dem gewünschten Kriterium zu sortieren, und alle Objekte in der Liste werden nach dem Wert der Eigenschaft des ausgewählten Kriteriums sortiert. Ein Objekt mit dem maximalen Parameterwert wird am Ende der Liste stehen. Es müssen noch zwei Objekte gefunden werden, die einen geringeren Eigenschaftswert haben als das zuvor gefundene Objekt. Und die Methoden für eine solche Suche sind bereits alle in der genannten Klasse implementiert.
Die Klasse der Fortschrittsanzeige, die Klasse des speziellen Charts und die Klasse des Frame-Betrachters werden auf der Grundlage der aus dem Artikel heruntergeladenen Codes erstellt – wir schauen uns einfach an, wie es dort gemacht wird, und verwenden diese Grundlage, um unsere eigenen Klassen zu implementieren, wobei wir korrigieren, Unnötiges entfernen und etwas Notwendiges hinzufügen. Schauen wir uns die resultierenden Codes an, und wenn Sie möchten, können wir sie mit denen aus dem alten Artikel vergleichen – ein Archiv mit alten Dateien wird am Ende dieses Artikels angehängt.
Wir werden alle Klassen in eine einzige Datei schreiben. Wir erstellen ihn (falls noch nicht geschehen) in \MQL5\Experts\FrameViewer\FrameViewer.mqh und füllen ihn aus.
Verbinden wir die Dateien der benötigten Klassen und Bibliotheken mit der erstellten Datei und definieren einige Makrosubstitutionen:
//+------------------------------------------------------------------+
//|                                                  FrameViewer.mqh |
//|                                  Copyright 2025, MetaQuotes Ltd. |
//|                                             https://www.mql5.com |
//+------------------------------------------------------------------+
#property copyright "Copyright 2025, MetaQuotes Ltd."
#property link      "https://www.mql5.com"

#include "Controls.mqh"                               // Classes of controls
#include "Table.mqh"                                  // Table class
#include <Arrays\ArrayDouble.mqh>                     // Array of physical data

#define  CELL_W               128                     // Width of table cells
#define  CELL_H               19                      // Height of table cell
#define  BUTT_RES_W           CELL_W+30               // Width of optimization result selection button
#define  DATA_COUNT           8                       // Amount of data
#define  FRAME_ID             1                       // Frame ID
#define  TABLE_OPT_STAT_ID    1                       // ID of statistics table on optimization tab
#define  TABLE_OPT_STAT_ID    2                       // ID of statistics table on optimization tab
Fast jedes grafische Objekt, das zum Zeichnen verwendet wird, hat mehrere CCanvas-Objekte. Eine kann als Untergrund dienen, auf dem sich zwei weitere befinden: Auf der ersten wird das Hintergrundbild gezeichnet, und die zweite zeigt, was über dem Hintergrund gezeichnet werden soll. Bei Objekten, deren Methoden zum Zeichnen bestimmt sind, wird diesen Methoden ein Zeiger auf das gewünschte Canvas-Objekt übergeben, auf das die Methode zeichnen wird.
Da es eine Menge Klassencode gibt und jede Klasse und ihre Methoden vollständig kommentiert sind, werden wir hier nicht alles im Detail und Schritt für Schritt beschreiben. Schauen wir uns einfach den Code der Klassen und Methoden an, für die wir einen kurzen Überblick über den vorgestellten Code geben werden.
Also, die Fortschrittsbalken-Klasse:
//+------------------------------------------------------------------+
//|  Progress bar class that draws in two colors                     |
//+------------------------------------------------------------------+
class CColorProgressBar :public CObject
  {
private:
   CCanvas          *m_background;                    // Pointer to CCanvas class object for drawing on background
   CCanvas          *m_foreground;                    // Pointer to CCanvas class object for drawing on foreground
   CRect             m_bound;                         // Coordinates and dimensions of workspace
   color             m_good_color, m_bad_color;       // Colors of profitable and loss series
   color             m_back_color, m_fore_color;      // Background and frame colors
   bool              m_passes[];                      // Number of processed passes
   int               m_last_index;                    // Last pass index
public:
//--- Constructor/destructor
                     CColorProgressBar(void);
                    ~CColorProgressBar(void){};

//--- Sets pointer to canvas
   void              SetCanvas(CCanvas *background, CCanvas *foreground)
                       {
                        if(background==NULL)
                          {
                           ::Print(__FUNCTION__, ": Error. Background is NULL");
                           return;
                          }
                        if(foreground==NULL)
                          {
                           ::Print(__FUNCTION__, ": Error. Foreground is NULL");
                           return;
                          }

                        this.m_background=background;
                        this.m_foreground=foreground;
                       }
//--- Sets coordinates and dimensions of workspace on canvas
   void              SetBound(const int x1, const int y1, const int x2, const int y2)
                       {
                        this.m_bound.SetBound(x1, y1, x2, y2);
                       }
//--- Return of coordinates of bounds of rectangular area
   int               X1(void)                      const { return this.m_bound.left;   }
   int               Y1(void)                      const { return this.m_bound.top;    }
   int               X2(void)                      const { return this.m_bound.right;  }
   int               Y2(void)                      const { return this.m_bound.bottom; }

//--- Setting background color and frame
   void              SetBackColor(const color clr)       { this.m_back_color=clr;      }
   void              SetForeColor(const color clr)       { this.m_fore_color=clr;      }
//--- Returning background color and frame
   color             BackColor(void)               const { return this.m_back_color;   }
   color             ForeColor(void)               const { return this.m_fore_color;   }
//--- Resets counter to zero
   void              Reset(void)                         { this.m_last_index=0;        }
//--- Adds result for drawing strip in progress bar
   void              AddResult(bool good, const bool chart_redraw);
//--- Updates progress bar on chart
   void              Update(const bool chart_redraw);
  };
//+------------------------------------------------------------------+
//| Constructor                                                      |
//+------------------------------------------------------------------+
CColorProgressBar::CColorProgressBar() : m_last_index(0), m_good_color(clrSeaGreen), m_bad_color(clrLightPink)
  {
//--- Set size of pass array with reserve
   ::ArrayResize(this.m_passes, 5000, 1000);
   ::ArrayInitialize(this.m_passes, 0);
  }
//+------------------------------------------------------------------+
//| Adding result                                                    |
//+------------------------------------------------------------------+
void CColorProgressBar::AddResult(bool good, const bool chart_redraw)
  {
   this.m_passes[this.m_last_index]=good;
//--- Add another vertical line of desired color to progress bar
   this.m_foreground.LineVertical(this.X1()+1+this.m_last_index, this.Y1()+1, this.Y2()-1, ::ColorToARGB(good ? this.m_good_color : this.m_bad_color));
//--- Update on chart
   this.m_foreground.Update(chart_redraw);
//--- Updating index
   this.m_last_index++;
   if(this.m_last_index>=this.m_bound.Width()-1)
      this.m_last_index=0;
  }
//+------------------------------------------------------------------+
//| Updating progress bar on chart                                   |
//+------------------------------------------------------------------+
void CColorProgressBar::Update(const bool chart_redraw)
  {
//--- Fill background with background color
   this.m_background.FillRectangle(this.X1(), this.Y1(), this.X2(), this.Y2(), ::ColorToARGB(this.m_back_color));
//--- Draw border
   this.m_background.Rectangle(this.X1(), this.Y1(), this.X2(), this.Y2(), ::ColorToARGB(this.m_fore_color));
//--- Update chart
   this.m_background.Update(chart_redraw);
  }
Die Klasse hat keine eigenen Canvas-Objekte zum Zeichnen. Um das Canvas-Objekt festzulegen, auf dem gezeichnet werden soll, gibt es eine Methode, der ein Zeiger auf ein vorhandenes Canvas übergeben wird. Und sie wird den Klassenvariablen zugewiesen. Die Methoden der Klasse zeichnen auf diese Leinwand. Hier gibt es zwei Objekte – eines zum Zeichnen des Hintergrunds des Fortschrittsbalkens und eines zum Zeichnen im Vordergrund über dem gezeichneten Hintergrund. CCanvas-Objekte einer speziellen Chart-Klasse dienen als Leinwand, auf der dieser Fortschrittsbalken gezeichnet wird.
Eine Klasse zur Darstellung von Statistikdiagrammen und Tabellen der Optimierungsergebnisse sowie der EA-Einstellungsparameter:
//+------------------------------------------------------------------+
//| Class for rendering statistics charts and tables                 |
//| of optimization results and EA’s settings parameters             |
//+------------------------------------------------------------------+
class CStatChart: public CObject
  {
private:
   color             m_back_color;        // Background color
   color             m_fore_color;        // Border color
   int               m_line_width;        // Line width in pixels
   int               m_lines;             // Number of lines on chart
   CArrayDouble      m_seria[];           // Arrays for storing chart values
   bool              m_profitseria[];     // Profitable series or not
   int               m_lastseria_index;   // Index of fresh line on chart
   color             m_profit_color;      // Color of profitable series
   color             m_loss_color;        // Color of loss series
   color             m_selected_color;    // Color of selected best series

protected:
   CCanvas          *m_background;        // Pointer to object of CCanvas class for drawing on background
   CCanvas          *m_foreground;        // Pointer to CCanvas class object for drawing on foreground
   CRect             m_bound_chart;       // Workspace of chart
   CRect             m_bound_head;        // Chart header workspace
   CColorProgressBar m_progress_bar;      // Progress bar
   CButton           m_button_replay;     // Replay button
   CButtonSwitch     m_button_res;        // Button for selecting one of top three results
   int               m_tab_id;            // Tab ID

public:
//--- Constructor/destructor
                     CStatChart() : m_lastseria_index(0), m_profit_color(clrForestGreen), m_loss_color(clrOrangeRed), m_selected_color(clrDodgerBlue), m_tab_id(0) {};
                    ~CStatChart() { this.m_background=NULL; this.m_foreground=NULL; }

//--- Sets pointer to canvas
   void              SetCanvas(CCanvas *background, CCanvas *foreground)
                       {
                        if(background==NULL)
                          {
                           ::Print(__FUNCTION__, ": Error. Background is NULL");
                           return;
                          }
                        if(foreground==NULL)
                          {
                           ::Print(__FUNCTION__, ": Error. Foreground is NULL");
                           return;
                          }
                        this.m_background=background;
                        this.m_foreground=foreground;
                        this.m_progress_bar.SetCanvas(background, foreground);
                       }
//--- Sets coordinates and dimensions of chart workspace and progress bar on canvas
   void              SetChartBounds(const int x1, const int y1, const int x2, const int y2)
                       {
                        this.m_bound_chart.SetBound(x1, y1, x2, y2);
                        this.SetBoundHeader(x1, y1-CELL_H, x2, y1);
                        this.m_progress_bar.SetBound(x1, y2-CELL_H, x2, y2);
                       }
//--- Sets coordinates and dimensions of chart header on canvas
   void              SetBoundHeader(const int x1, const int y1, const int x2, const int y2)
                       {
                        this.m_bound_head.SetBound(x1, y1, x2, y2);
                       }
//--- Returns pointer to (1) itself, (2) progress bar
   CStatChart       *Get(void)                           { return &this;                     }
   CColorProgressBar*GetProgressBar(void)                { return(&this.m_progress_bar);     }

//--- Setting/returning tab ID
   void              SetTabID(const int id)              { this.m_tab_id=id;                 }
   int               TabID(void)                   const { return this.m_tab_id;             }

//--- Returning coordinates of bounds of chart’s rectangular area
   int               X1(void)                      const { return this.m_bound_chart.left;   }
   int               Y1(void)                      const { return this.m_bound_chart.top;    }
   int               X2(void)                      const { return this.m_bound_chart.right;  }
   int               Y2(void)                      const { return this.m_bound_chart.bottom; }
//--- Return of coordinates of bounds of rectangular header area
   int               HeaderX1(void)                const { return this.m_bound_head.left;    }
   int               HeaderY1(void)                const { return this.m_bound_head.top;     }
   int               HeaderX2(void)                const { return this.m_bound_head.right;   }
   int               HeaderY2(void)                const { return this.m_bound_head.bottom;  }
//--- Return of coordinates of bounds of rectangular area of progress bar
   int               ProgressBarX1(void)           const { return this.m_progress_bar.X1();  }
   int               ProgressBarY1(void)           const { return this.m_progress_bar.Y1();  }
   int               ProgressBarX2(void)           const { return this.m_progress_bar.X2();  }
   int               ProgressBarY2(void)           const { return this.m_progress_bar.Y2();  }

//--- Returns pointer to button of: (1) replay, (2) result selection (3) worst, (4) average, (5) best result
   CButton          *ButtonReplay(void)                  { return(&this.m_button_replay);    }
   CButtonSwitch    *ButtonResult(void)                  { return(&this.m_button_res);       }
   CButtonTriggered *ButtonResultMin(void)               { return(this.m_button_res.GetButton(0)); }
   CButtonTriggered *ButtonResultMid(void)               { return(this.m_button_res.GetButton(1)); }
   CButtonTriggered *ButtonResultMax(void)               { return(this.m_button_res.GetButton(2)); }

//--- (1) Hides, (2) shows, (3) brings results selection button to foreground
   bool              ButtonsResultHide(void)             { return(this.m_button_res.Hide());       }
   bool              ButtonsResultShow(void)             { return(this.m_button_res.Show());       }
   bool              ButtonsResultBringToTop(void)       { return(this.m_button_res.BringToTop()); }

//--- Creates replay button
   bool              CreateButtonReplay(void)
                       {
                        if(this.m_background==NULL)
                          {
                           ::PrintFormat("%s: Фон не задан (сначала используйте функцию SetCanvas())");
                           return false;
                          }
                        string text="Optimization Completed: Click to Replay";
                        int w=this.m_background.TextWidth(text);

                        //--- Upper-left coordinate of button
                        CPoint cp=this.m_bound_head.CenterPoint();
                        int x=cp.x-w/2;
                        int y=this.Y1()+this.m_bound_head.top-2;

                        //--- Create button and set new colors for it, hide created button
                        if(!this.m_button_replay.Create(::StringFormat("Tab%d_ButtonReplay", this.m_tab_id), text, x, y, w, CELL_H-1))
                           return false;

                        this.m_button_replay.SetDefaultColors(COLOR_BACKGROUND, STATE_OFF, C'144,238,144', C'144,228,144', C'144,218,144', clrSilver);
                        this.m_button_replay.SetDefaultColors(COLOR_BORDER, STATE_OFF, C'144,238,144', C'144,228,144', C'144,218,144', clrSilver);
                        this.m_button_replay.SetDefaultColors(COLOR_FOREGROUND, STATE_OFF, clrBlack, clrBlack, clrBlack, clrGray);
                        this.m_button_replay.ResetUsedColors(STATE_OFF);
                        this.m_button_replay.Draw(false);
                        this.m_button_replay.Hide();
                        return true;
                       }

//--- Creates results selection button
   bool              CreateButtonResults(void)
                       {
                        if(this.m_background==NULL)
                          {
                           ::PrintFormat("%s: Фон не задан (сначала используйте функцию SetCanvas())");
                           return false;
                          }
                        //--- Upper-left coordinate of button
                        int x=this.m_bound_head.left+1;
                        int y=this.m_progress_bar.Y1()+CELL_H+2;
                        int w=BUTT_RES_W;

                        //--- Creatу button and set new colors for it, hidу created button
                        if(!this.m_button_res.Create(::StringFormat("Tab%u_ButtonRes",this.m_tab_id), "", x, y, w, CELL_H-1))
                           return false;

                        string text[3]={"Worst result of the top 3", "Average result of the top 3", "Best result of the top 3"};
                        if(!this.m_button_res.AddNewButton(text, w))
                           return false;
                        this.m_button_res.GetButton(0).SetDefaultColors(COLOR_BORDER, STATE_OFF, C'228,228,228', C'228,228,228', C'228,228,228', clrSilver);
                        this.m_button_res.GetButton(0).ResetUsedColors(STATE_OFF);
                        this.m_button_res.GetButton(1).SetDefaultColors(COLOR_BORDER, STATE_OFF, C'228,228,228', C'228,228,228', C'228,228,228', clrSilver);
                        this.m_button_res.GetButton(1).ResetUsedColors(STATE_OFF);
                        this.m_button_res.GetButton(2).SetDefaultColors(COLOR_BORDER, STATE_OFF, C'228,228,228', C'228,228,228', C'228,228,228', clrSilver);
                        this.m_button_res.GetButton(2).ResetUsedColors(STATE_OFF);
                        this.m_button_res.Draw(false);
                        this.m_button_res.Hide();
                        return true;
                       }

//--- Sets background color
   void              SetBackColor(const color clr)
                       {
                        this.m_back_color=clr;
                        this.m_progress_bar.SetBackColor(clr);
                       }
//--- Sets border color
   void              SetForeColor(const color clr)
                       {
                        this.m_fore_color=clr;
                        this.m_progress_bar.SetForeColor(clr);
                       }

//--- Sets number of lines on chart
   void              SetLines(const int num)
                       {
                        this.m_lines=num;
                        ::ArrayResize(this.m_seria, num);
                        ::ArrayResize(this.m_profitseria, num);
                       }

//--- Setting color of (1) profitable, (2) loss, (3) selected series
   void              SetProfitColorLine(const color clr)    { this.m_profit_color=clr;    }
   void              SetLossColorLine(const color clr)      { this.m_loss_color=clr;      }
   void              SetSelectedLineColor(const color clr)  { this.m_selected_color=clr;  }

//--- Updating object on screen
   void              Update(color clr, const int line_width, const bool chart_redraw);
//--- Adding data from array
   void              AddSeria(const double  &array[], bool profit);
//--- Draws chart
   void              Draw(const int seria_index, color clr, const int line_width, const bool chart_redraw);
//--- Draws line in usual coordinates (from left to right, from bottom to top)
   void              Line(int x1, int y1, int x2, int y2, uint col, int size);
//--- Getting max. and min. values in the series
   double            MaxValue(const int seria_index);
   double            MinValue(const int seria_index);

//--- Event handler
   void OnChartEvent(const int id,const long& lparam,const double& dparam,const string& sparam)
     {
      //--- If replay button is not hidden, call its event handler
      if(!this.m_button_replay.IsHidden())
         this.m_button_replay.OnChartEvent(id, lparam, dparam, sparam);
      //--- If result selection button is not hidden, call its event handler
      if(!this.m_button_res.IsHidden())
         this.m_button_res.OnChartEvent(id, lparam, dparam, sparam);
     }
  };
Auf der angegebenen Leinwand (Hintergrund und Vordergrund) zeichnet die Klasse Tabellen mit Parametern und Testergebnissen, Charts mit Durchläufen, einen Fortschrittsbalken und Schaltflächen zum Starten der Wiedergabe des abgeschlossenen Optimierungsprozesses und zur Auswahl der besten Ergebnisse für bestimmte Optimierungskriterien.
Es sei darauf hingewiesen, dass die hier besprochenen Klassen die Struktur CRect verwenden, um die Grenzen des rechteckigen Bereichs der Leinwand anzugeben, in dem sich das verfolgte Objekt oder der verfolgte Bereich befindet.
Die Struktur ist in \MQL5\Include\Controls\Rect.mqh beschrieben und dient als praktisches Hilfsmittel zur Angabe der Grenzen eines rechteckigen Bereichs, der wichtige Elemente enthält. Auf der Leinwand können wir zum Beispiel den Bereich begrenzen, in dem der Mauszeiger verfolgt werden soll, oder wir können die Größe des Begrenzungsrechtecks für die gesamte Leinwandgröße festlegen. In diesem Fall ist der gesamte Bereich des gesamten Objekts für die Interaktion mit dem Cursor verfügbar. Die Methoden, die die Koordinaten der Begrenzungen eines rechteckigen Bereichs zurückgeben, werden innerhalb der Struktur erstellt. Darüber hinaus ist es möglich, Grenzen zu setzen und ihre Werte auf verschiedene Weise zu erhalten – es hängt alles von den Bedürfnissen und der Struktur der Objekte ab. Es werden auch Methoden zum Bewegen und Verschieben eines rechteckigen Bereichs implementiert. Im Allgemeinen ist es ein praktisches Werkzeug, um die Grenzen eines beliebigen Bereichs festzulegen, der in irgendeiner Weise verfolgt werden muss.
In den hier betrachteten Klassen werden diese Bereiche benötigt, um mit dem Mauszeiger zu interagieren und anzuzeigen, wo sich Objekte auf der Leinwand befinden.
Eine Methode zur Aktualisierung des Charts:
//+------------------------------------------------------------------+
//| Updating chart                                                   |
//+------------------------------------------------------------------+
void CStatChart::Update(color clr, const int line_width, const bool chart_redraw)
  {
//--- If canvas for background or foreground is not installed, exit
   if(this.m_background==NULL || this.m_foreground==NULL)
      return;
//--- StatChart fill in background
   this.m_background.FillRectangle(this.X1(), this.Y1(), this.X2(), this.Y2(), ::ColorToARGB(this.m_back_color));
//--- StatChart draw border
   this.m_background.Rectangle(this.X1(), this.Y1(), this.X2(), this.Y2(), ::ColorToARGB(this.m_fore_color));

//--- ProgressBar fill in background and draw border
   this.m_progress_bar.Update(false);

//--- Draw each series for 80% of available chart area vertically and horizontally
   for(int i=0; i<this.m_lines; i++)
     {
      //--- If color is set missing, use colors of profitable and loss series
      if(clr==clrNONE)
        {
         clr=this.m_loss_color;
         if(this.m_profitseria[i])
            clr=this.m_profit_color;
        }
      //--- otherwise, use color set for selected line
      else
         clr=this.m_selected_color;

      //--- Draw a chart of optimization results
      this.Draw(i, clr, line_width, false);
     }
//--- Update both canvases
   this.m_background.Update(false);
   this.m_foreground.Update(chart_redraw);
  }
Der rechteckige Bereich der Leinwand, der für das Zeichnen von Durchgangsdiagrammen vorgesehen ist, wird gelöscht, und eine Ausgleichslinie und ein Fortschrittsbalken werden darauf gezeichnet.
Eine Methode, die eine neue Datenreihe hinzufügt, die in einem Chart gezeichnet werden soll:
//+------------------------------------------------------------------+
//| Adds new series of data to be drawn on chart                     |
//+------------------------------------------------------------------+
void CStatChart::AddSeria(const double &array[], bool profit)
  {
//--- Adding array to series number m_lastseria_index
   this.m_seria[this.m_lastseria_index].Resize(0);
   this.m_seria[this.m_lastseria_index].AddArray(array);
   this.m_profitseria[this.m_lastseria_index]=profit;
//--- Track index of last line (not currently in use)
   this.m_lastseria_index++;
   if(this.m_lastseria_index>=this.m_lines)
      this.m_lastseria_index=0;
  }
Jeder neue Durchlauf des Optimierers, sein Daten-Array, muss in das Serien-Array eingetragen werden, was diese Methode implementiert.
Methoden zum Abrufen der Höchst- und Mindestwerte der angegebenen Reihe im Array der Optimierungsdurchläufe:
//+------------------------------------------------------------------+
//| Getting maximum value of specified series                        |
//+------------------------------------------------------------------+
double CStatChart::MaxValue(const int seria_index)
  {
   double res=this.m_seria[seria_index].At(0);
   int total=this.m_seria[seria_index].Total();
//--- Iterate through array and compare every two adjacent series
   for(int i=1; i<total; i++)
     {
      if(this.m_seria[seria_index].At(i)>res)
         res=this.m_seria[seria_index].At(i);
     }
//--- result
   return res;
  }
//+------------------------------------------------------------------+
//| Getting minimum value of specified series                        |
//+------------------------------------------------------------------+
double CStatChart::MinValue(const int seria_index)
  {
   double res=this.m_seria[seria_index].At(0);;
   int total=this.m_seria[seria_index].Total();
//--- Iterate through array and compare every two adjacent series
   for(int i=1; i<total; i++)
     {
      if(this.m_seria[seria_index].At(i)<res)
         res=this.m_seria[seria_index].At(i);
     }
//--- result
   return res;
  }
Um die Diagramme der Optimierungsdurchgänge relativ zur Mitte eines speziellen Charts zu positionieren, sollten wir die Maximal- und Minimalwerte in den Durchlaufreihen kennen. Anhand dieser Werte können wir dann die relativen Koordinaten der Linie auf dem Chart so berechnen, dass die Linie in 80 % des Chart-Platzes passt, der für das Zeichnen von Ausgleichsdiagrammen von Optimierungsdurchläufen vorgesehen ist.
Eine Methode zum Zeichnen einer Saldenkurve auf einem Chart:
//+------------------------------------------------------------------+
//| Overloading the basic drawing function                           |
//+------------------------------------------------------------------+
void CStatChart::Line(int x1, int y1, int x2, int y2, uint col, int size)
  {
//--- If canvas is not set, exit
   if(this.m_foreground==NULL)
      return;
//--- Since Y-axis is inverted, invert y1 and y2
   int y1_adj=this.m_bound_chart.Height()-CELL_H-y1;
   int y2_adj=this.m_bound_chart.Height()-CELL_H-y2;

//--- Draw smoothed line
//--- If line thickness is less than 3, draw line using the Wu smoothing algorithm
//--- (for thicknesses of 1 and 2, LineWu() method is called in LineThick() method),
//--- otherwise, draw smoothed line of given thickness using LineThick
   this.m_foreground.LineThick(x1, y1_adj, x2, y2_adj,::ColorToARGB(col), (size<1 ? 1 : size), STYLE_SOLID, LINE_END_ROUND);
  }
Dies ist eine überladene Methode der gleichnamigen Methode der Klasse CCanvas. Die Koordinaten auf der Chart beginnen in der linken oberen Ecke. Und die üblichen Koordinaten der Saldenkurven beginnen mit dem linken unteren Rand.
Bei dieser Methode werden die Y-Koordinaten des Bildschirms umgedreht, um eine nicht invertierte Ausgleichslinie zu zeichnen, die auf den Werten der Ausgleichspunkte aus dem Array basiert.
Eine Methode, die Saldenkurven in einem Chart zeichnet:
//+------------------------------------------------------------------+
//| Drawing balance line on chart                                    |
//+------------------------------------------------------------------+
void CStatChart::Draw(const int seria_index, color clr, const int line_width, const bool chart_redraw)
  {
//--- If canvas is not set, exit
   if(this.m_foreground==NULL)
      return;

//--- Preparing coefficients for converting values into pixels
   double min=this.MaxValue(seria_index);
   double max=this.MinValue(seria_index);
   double size=this.m_seria[seria_index].Total();

//--- Indentations from chart edge
   double x_indent=this.m_bound_chart.Width()*0.05;
   double y_indent=this.m_bound_chart.Height()*0.05;

//--- Calculate coefficients
   double k_y=(max-min)/(this.m_bound_chart.Height()-2*CELL_H-2*y_indent);
   double k_x=(size)/(this.m_bound_chart.Width()-2*x_indent);

//--- Coefficients
   double start_x=this.m_bound_chart.left+x_indent;
   double start_y=this.m_bound_chart.bottom-2*CELL_H*2-y_indent;

//--- Now draw polyline passing through all points of series
   for(int i=1; i<size; i++)
     {
      //--- convert values to pixels
      int x1=(int)((i-0)/k_x+start_x);  // set value number horizontally
      int y1=(int)(start_y-(m_seria[seria_index].At(i)-min)/k_y);    // vertically
      int x2=(int)((i-1-0)/k_x+start_x);// set value number horizontally
      int y2=(int)(start_y-(m_seria[seria_index].At(i-1)-min)/k_y);  // vertically
      //--- Draw line from previous point to current one
      this.Line(x1, y1, x2, y2, clr, line_width);
     }
//--- Updating canvas with chart redrawing (if flag is set)
   this.m_foreground.Update(chart_redraw);
  }
Hier werden die notwendigen Koordinaten der Ausgleichslinie auf dem Chart berechnet (innerhalb des Chart-Bereichs, der für das Zeichnen von Saldenkurven vorgesehen ist), und in einer Schleife werden entsprechend dem Array der angegebenen Serie Linien zwischen allen im Array erfassten Saldenpunkten gezogen.
Die Klasse der Frame-Daten:
//+------------------------------------------------------------------+
//| Enumerations                                                     |
//+------------------------------------------------------------------+
enum ENUM_FRAME_PROP                                              // Frame properties
  {
   FRAME_PROP_PASS_NUM,                                           // Pass number
   FRAME_PROP_SHARPE_RATIO,                                       // Sharpe Ratio result
   FRAME_PROP_NET_PROFIT,                                         // Net Profit result
   FRAME_PROP_PROFIT_FACTOR,                                      // Profit Factor result
   FRAME_PROP_RECOVERY_FACTOR,                                    // Recovery Factor result
  };
//+------------------------------------------------------------------+
//| Frame data class                                                 |
//+------------------------------------------------------------------+
class CFrameData : public CObject
  {
protected:
   ulong             m_pass;                                      // Pass number
   double            m_sharpe_ratio;                              // Sharpe Ratio
   double            m_net_profit;                                // Total profit
   double            m_profit_factor;                             // Profitability
   double            m_recovery_factor;                           // Recovery factor
public:
//--- Setting frame properties (pass results)
   void              SetPass(const ulong pass)                    { this.m_pass=pass;              }
   void              SetSharpeRatio(const double value)           { this.m_sharpe_ratio=value;     }
   void              SetNetProfit(const double value)             { this.m_net_profit=value;       }
   void              SetProfitFactor(const double value)          { this.m_profit_factor=value;    }
   void              SetRecoveryFactor(const double value)        { this.m_recovery_factor=value;  }
//--- Returning frame properties (pass results)
   ulong             Pass(void)                             const { return this.m_pass;            }
   double            SharpeRatio(void)                      const { return this.m_sharpe_ratio;    }
   double            NetProfit(void)                        const { return this.m_net_profit;      }
   double            ProfitFactor(void)                     const { return this.m_profit_factor;   }
   double            RecoveryFactor(void)                   const { return this.m_recovery_factor; }

//--- Description of properties
   string            PassDescription(void)                  const { return ::StringFormat("Pass: %I64u", this.m_pass);                       }
   string            SharpeRatioDescription(void)           const { return ::StringFormat("Sharpe Ratio: %.2f", this.m_sharpe_ratio);        }
   string            NetProfitDescription(void)             const { return ::StringFormat("Net Profit: %.2f", this.m_net_profit);            }
   string            ProfitFactorDescription(void)          const { return ::StringFormat("Profit Factor: %.2f", this.m_profit_factor);      }
   string            RecoveryFactorDescription(void)        const { return ::StringFormat("Recovery Factor: %.2f", this.m_recovery_factor);  }

//--- Printing frame properties to log
   void              Print(void)
                       {
                        ::PrintFormat("Frame %s:", this.PassDescription());
                        ::PrintFormat(" - %s", this.SharpeRatioDescription());
                        ::PrintFormat(" - %s", this.NetProfitDescription());
                        ::PrintFormat(" - %s", this.ProfitFactorDescription());
                        ::PrintFormat(" - %s", this.RecoveryFactorDescription());
                       }

//--- A method for comparing two objects
   virtual int       Compare(const CObject *node,const int mode=0) const
                       {
                        //--- Compare real values as two-digit values
                        const CFrameData *obj=node;
                        switch(mode)
                          {
                           case FRAME_PROP_SHARPE_RATIO     :  return(::NormalizeDouble(this.SharpeRatio(),2)   > ::NormalizeDouble(obj.SharpeRatio(),2)    ?  1 :
                                                                      ::NormalizeDouble(this.SharpeRatio(),2)   < ::NormalizeDouble(obj.SharpeRatio(),2)    ? -1 : 0);
                           case FRAME_PROP_NET_PROFIT       :  return(::NormalizeDouble(this.NetProfit(),2)     > ::NormalizeDouble(obj.NetProfit(),2)      ?  1 :
                                                                      ::NormalizeDouble(this.NetProfit(),2)     < ::NormalizeDouble(obj.NetProfit(),2)      ? -1 : 0);
                           case FRAME_PROP_PROFIT_FACTOR    :  return(::NormalizeDouble(this.ProfitFactor(),2)  > ::NormalizeDouble(obj.ProfitFactor(),2)   ?  1 :
                                                                      ::NormalizeDouble(this.ProfitFactor(),2)  < ::NormalizeDouble(obj.ProfitFactor(),2)   ? -1 : 0);
                           case FRAME_PROP_RECOVERY_FACTOR  :  return(::NormalizeDouble(this.RecoveryFactor(),2)> ::NormalizeDouble(obj.RecoveryFactor(),2) ?  1 :
                                                                      ::NormalizeDouble(this.RecoveryFactor(),2)< ::NormalizeDouble(obj.RecoveryFactor(),2) ? -1 : 0);
                           //---FRAME_PROP_PASS_NUM
                           default                          :  return(this.Pass()>obj.Pass() ?  1  :  this.Pass()<obj.Pass()  ? -1  :  0);
                          }
                       }

//--- Constructors/destructor
                     CFrameData (const ulong pass, const double sharpe_ratio, const double net_profit, const double profit_factor, const double recovery_factor) :
                        m_pass(pass), m_sharpe_ratio(sharpe_ratio), m_net_profit(net_profit), m_profit_factor(profit_factor), m_recovery_factor(recovery_factor) {}
                     CFrameData (void) :
                        m_pass(0), m_sharpe_ratio(0), m_net_profit(0), m_profit_factor(0), m_recovery_factor(0) {}
                    ~CFrameData (void) {}
  };
Nach jedem Durchlauf des Optimierers wird ein Frame an das Terminal gesendet. Sie enthält alle Daten, die am Ende dieses Durchgangs empfangen wurden. Um auf die Daten eines beliebigen Durchgangs zuzugreifen, muss man in einer Schleife über alle empfangenen Frame nach einem Frame mit der gewünschten Nummer suchen und dessen Daten abrufen. Das ist überhaupt nicht zweckmäßig. Wir sollten in der Lage sein, schnell auf die Daten des gewünschten Durchgangs zuzugreifen und alle Durchgänge nach der angegebenen Eigenschaft zu sortieren, da wir die drei besten Durchgänge auswählen müssen: einen aus jedem der vier Optimierungskriterien.
Der Ausweg ist das Zwischenspeichern der Durchgänge. Hierfür benötigen wir eine Frame-Objektklasse. Nach jedem Durchgang und dem Senden eines Frames an das Terminal müssen wir ein Frame-Objekt erstellen, seine Eigenschaften mit den Daten des empfangenen Test-Frames ausfüllen und das Frame-objekt in der Liste suchen. Nachdem der Optimierungsprozess abgeschlossen ist und alle Bilder abgerufen wurden, verfügen wir über Kopien aller Bilder in der Bilderliste. Nun können wir diese Liste von Frames nach den gewünschten Eigenschaften sortieren und die Daten des gewünschten Frames schnell abrufen.
Es ist erwähnenswert, dass wir in die Methode Compare() reelle Zahlen nicht durch den Vergleich der normierten Differenz mit Null, sondern durch den Vergleich zweier normierter Zahlen miteinander vergleichen mussten. Warum ist das so?
Es gibt verschiedene Möglichkeiten, zwei reelle Zahlen zu vergleichen. Die erste besteht darin, nicht normierte Zahlen zu vergleichen. Zuerst wird mit dem ternären Operator mit „mehr“ verglichen, dann mit „weniger“, und am Ende bedeutet das, was übrig bleibt, „gleich“. Alternativ können Sie auch die normierte Differenz zweier Zahlen mit Null vergleichen. Hier mussten wir jedoch beide Zahlen auf zwei Ziffern normalisieren und diese Werte vergleichen.
Im Terminal zeigt die Ergebnistabelle nämlich zweistellige Zahlen in den Optimierungsergebnissen an. Intern sind diese Zahlen jedoch nicht auf zwei Ziffern normiert. Mit anderen Worten: Eine zweistellige Darstellung der Ergebnisse findet sich nur in der Ergebnistabelle. Und wenn in der Tabelle z. B. die Werte 1,09 und 1,08 stehen, dann ist das vielleicht gar nicht der Fall. Das können zum Beispiel folgende Nummern sein: 1.085686399864 und 1.081254322375. Beide Zahlen werden in der Tabelle auf 1,09 und 1,08 aufgerundet. Beim Vergleich können wir jedoch feststellen, dass beide Zahlen durch Normalisierung auf denselben Wert gerundet werden. Und wenn nicht normalisieren, dann kann der Wert von 1,09 fehlen. Und das führt zu einer falschen Suche nach den besten Pässen.
Die Lösung besteht darin, beide Zahlen auf zwei Ziffern zu normalisieren und erst dann ihre gerundeten Werte zu vergleichen.
Die Klasse des Frame Viewer:
//+------------------------------------------------------------------+ //| ▸Frame viewer class | //+------------------------------------------------------------------+ class CFrameViewer : public CObject { private: int m_w; // Chart width int m_h; // Chart height color m_selected_color; // Color of selected series from top three uint m_line_width; // Width of line of selected series from top three bool m_completed; // Optimization completion flag CFrameData m_frame_tmp; // Frame object for searching by property CArrayObj m_list_frames; // List of frames CTabControl m_tab_control; // Tab Control //--- Declare tab objects on Tab Control //--- Tab 0 (Optimization) of Tab Control CTableDataControl m_table_inp_0; // Table of optimization parameters on tab 0 CTableDataControl m_table_stat_0; // Table of optimization results on tab 0 CTableDataControl m_table_stat_0; // Table of optimization results on tab 0 CColorProgressBar*m_progress_bar; // Progress bar on optimization chart on tab 0 //--- Tab 1 (Sharpe Ratio) of Tab Control CTableDataControl m_table_inp_1; // Table of optimization parameters on tab 1 CTableDataControl m_table_stat_1; // Table of optimization results on tab 1 CStatChart m_chart_stat_1; // Table of optimization results on tab 1 //--- Tab 2 (Net Profit) of Tab Control CTableDataControl m_table_inp_2; // Table of optimization parameters on tab 2 CTableDataControl m_table_stat_2; // Table of optimization results on tab 2 CStatChart m_chart_stat_2; // Chart of optimization results on tab 2 //--- Tab 3 (Profit Factor) of Tab Control CTableDataControl m_table_inp_3; // Table of optimization parameters on tab 3 CTableDataControl m_table_stat_3; // Table of optimization results on tab 3 CStatChart m_chart_stat_3; // Chart of optimization results on tab 3 //--- Tab 4 (Recovery Factor) of Tab Control CTableDataControl m_table_inp_4; // Table of optimization parameters on tab 4 CTableDataControl m_table_stat_4; // able of optimization results on tab 4 CStatChart m_chart_stat_4; // Chart of optimization results on tab 4 protected: //--- Returns pointer to table of optimization parameters by tab index CTableDataControl*GetTableInputs(const uint tab_id) { switch(tab_id) { case 0 : return this.m_table_inp_0.Get(); case 1 : return this.m_table_inp_1.Get(); case 2 : return this.m_table_inp_2.Get(); case 3 : return this.m_table_inp_3.Get(); case 4 : return this.m_table_inp_4.Get(); default: return NULL; } } //--- Returns pointer to table of optimization results by tab index CTableDataControl*GetTableStats(const uint tab_id) { switch(tab_id) { case 0 : return this.m_table_stat_0.Get(); case 1 : return this.m_table_stat_1.Get(); case 2 : return this.m_table_stat_2.Get(); case 3 : return this.m_table_stat_3.Get(); case 4 : return this.m_table_stat_4.Get(); default: return NULL; } } //--- Returns pointer to chart of optimization results by tab index CStatChart *GetChartStats(const uint tab_id) { switch(tab_id) { case 0 : return this.m_chart_stat_0.Get(); case 1 : return this.m_chart_stat_1.Get(); case 2 : return this.m_chart_stat_2.Get(); case 3 : return this.m_chart_stat_3.Get(); case 4 : return this.m_chart_stat_4.Get(); default: return NULL; } } //--- Adds frame object to list bool AddFrame(CFrameData *frame) { if(frame==NULL) { ::PrintFormat("%s: Error: Empty object passed",__FUNCTION__); return false; } this.m_frame_tmp.SetPass(frame.Pass()); this.m_list_frames.Sort(FRAME_PROP_PASS_NUM); int index=this.m_list_frames.Search(frame); if(index>WRONG_VALUE) return false; return this.m_list_frames.Add(frame); } //--- Draws table of optimization statistics on specified tab void TableStatDraw(const uint tab_id, const int x, const int y, const int w, const int h, const bool chart_redraw); //--- Draws table of input optimization parameters on specified tab void TableInpDraw(const uint tab_id, const int x, const int y, const int w, const int h, const uint rows, const bool chart_redraw); //--- Draws chart of optimization on specified tab void ChartOptDraw(const uint tab_id, const bool opt_completed, const bool chart_redraw); //--- Draws data tables and optimization chart void DrawDataChart(const uint tab_id); //--- Draws charts of top three passes by optimization criterion void DrawBestFrameData(const uint tab_id, const int res_index); //--- Controls view of control objects on optimization charts void ControlObjectsView(const uint tab_id); //--- Replaying frames after optimization completion void ReplayFrames(const int delay_ms); //--- Retrieving data of current frame and printing it on specified tab in table and on optimization results chart bool DrawFrameData(const uint tab_id, const string text, color clr, const uint line_width, ulong &pass, string ¶ms[], uint &par_count, double &data[]); //--- Prints data of specified frame to optimization chart bool DrawFrameDataByPass(const uint tab_id, const ulong pass_num, const string text, color clr, const uint line_width, double &data[]); //--- Fills array with frame indexes of top three passes for specified optimization criterion (by tab index) bool FillArrayBestFrames(const uint tab_id, ulong &array_passes[]); //--- Prints out three best passes on each tab on optimization results charts void DrawBestFrameDataAll(void); //--- Searches for and returns pointer to frame object with a property value less than sample CFrameData *FrameSearchLess(CFrameData *frame, const int mode); public: //--- Setting thickness of selected line void SetSelectedLineWidth(const uint width) { this.m_line_width=width; } //--- Setting color of profitable series void SetProfitColorLine(const color clr) { int total=this.m_tab_control.TabsTotal(); for(int i=1; i<total; i++) { CStatChart *chart=this.GetChartStats(i); if(chart!=NULL) chart.SetProfitColorLine(clr); } } //--- Setting color of loss series void SetLossColorLine(const color clr) { int total=this.m_tab_control.TabsTotal(); for(int i=1; i<total; i++) { CStatChart *chart=this.GetChartStats(i); if(chart!=NULL) chart.SetLossColorLine(clr); } } //--- Setting color of selected series void SetSelectedLineColor(const color clr) { int total=this.m_tab_control.TabsTotal(); for(int i=1; i<total; i++) { CStatChart *chart=this.GetChartStats(i); if(chart!=NULL) chart.SetSelectedLineColor(clr); } } //--- Event handlers of strategy tester void OnTester(const double OnTesterValue); int OnTesterInit(const int lines, const int selected_line_width, const color selected_line_color); void OnTesterPass(void); void OnTesterDeinit(void); //--- Chart event handlers void OnChartEvent(const int id,const long &lparam,const double &dparam,const string &sparam,const int delay_ms); protected: //--- Handler for (1) changing tab of Tab Control element, (2) selecting Button Switch void OnTabSwitchEvent(const int tab_id); void OnButtonSwitchEvent(const int tab_id, const uint butt_id); public: //--- Constructor/destructor CFrameViewer(void); ~CFrameViewer(void){ this.m_list_frames.Clear(); } };
Wir wissen genau, wie viele Registerkarten es geben wird und welche Elemente auf jeder Registerkarte zu finden sein werden. Daher werden hier keine neuen Objekte erstellt, sondern es werden lediglich Instanzen der für jede Registerkarte erforderlichen Objekte, Zugriffsmethoden auf diese und Methoden für die Arbeit der Klasse deklariert.
Konstrukteure
//+------------------------------------------------------------------+
//| Constructor                                                      |
//+------------------------------------------------------------------+
CFrameViewer::CFrameViewer(void) : m_completed(false), m_progress_bar(NULL), m_selected_color(clrDodgerBlue), m_line_width(1)
  {
//--- Chart window size
   this.m_w=(int)::ChartGetInteger(0, CHART_WIDTH_IN_PIXELS);
   this.m_h=(int)::ChartGetInteger(0, CHART_HEIGHT_IN_PIXELS);
//--- Get pointer to progress bar from statistics chart object
   this.m_progress_bar=this.m_chart_stat_0.GetProgressBar();
   this.m_list_frames.Clear();
  }
Im Konstruktor werden die Breite und Höhe des Charts, auf dem der Expert Advisor läuft, ermittelt und gespeichert, ein Zeiger auf den Fortschrittsbalken gesucht und geschrieben und die Liste der Frames gelöscht.
Wenn wir die Optimierung starten, bereiten wir vor dem Start einen Chart vor, auf dem eine Kopie des Expert Advisors im Frame-Modus auf dem Client-Terminal gestartet werden soll. Das Chart wird vom Terminal abgetrennt, Tab Control befindet sich in voller Größe darauf. Die übrigen Elemente befinden sich auf den Registerkarten, auf denen die Saldentabellen der Durchgänge und die Kontrollschaltflächen angezeigt werden.
All dies muss in OnTesterInit() durchgeführt werden. Zu diesem Zweck stellt die Klasse gleichnamige Handler zur Verfügung, die im Expert Advisor von einer Instanz der Klasse CFrameViewer aus gestartet werden.
OnTesterInit:
//+------------------------------------------------------------------+
//| It must be called in handler of OnTesterInit() Expert Advisor    |
//+------------------------------------------------------------------+
int CFrameViewer::OnTesterInit(const int lines, const int selected_line_width, const color selected_line_color)
  {
//--- Chart ID with expert running in Frame mode
   long chart_id=::ChartID();

//--- Preparing a floating chart for drawing statistics tables and balance lines
   ::ResetLastError();
   if(!::ChartSetInteger(chart_id, CHART_SHOW, false))
     {
      ::PrintFormat("%s: ChartSetInteger() failed. Error %d",__FUNCTION__, GetLastError());
      return INIT_FAILED;
     }
   if(!::ChartSetInteger(chart_id, CHART_IS_DOCKED, false))
     {
      ::PrintFormat("%s: ChartSetInteger() failed. Error %d",__FUNCTION__, GetLastError());
      return INIT_FAILED;
     }
//--- Clearing chart completely of all graphical objects
   ::ObjectsDeleteAll(chart_id);

//--- Based on chart size create Tab Control with five tabs
   int w=(int)::ChartGetInteger(chart_id, CHART_WIDTH_IN_PIXELS);
   int h=(int)::ChartGetInteger(chart_id, CHART_HEIGHT_IN_PIXELS);
   if(this.m_tab_control.Create("TabControl", "", 0, 0, w, h))
     {
      //--- If control is created successfully, add five tabs to it
      bool res=true;
      for(int i=0; i<5; i++)
        {
         string tab_text=(i==1 ? "Sharpe Ratio" : i==2 ? "Net Profit" : i==3 ? "Profit Factor" : i==4 ? "Recovery Factor" : "Optimization");
         res &=this.m_tab_control.AddTab(i, tab_text);
        }
      if(!res)
        {
         ::PrintFormat("%s: Errors occurred while adding tabs to the Tab Control",__FUNCTION__);
         return INIT_FAILED;
        }
     }
   else
     {
      Print("Tab Control creation failed");
      return INIT_FAILED;
     }

//--- CCanvas objects in workspace of tab 0 (Optimization) for drawing background images and text
   CCanvas *tab0_background=this.m_tab_control.GetTabBackground(0);
   CCanvas *tab0_foreground=this.m_tab_control.GetTabForeground(0);
//--- CCanvas objects in workspace of tab 1 (Sharpe Ratio) for drawing background images and text
   CCanvas *tab1_background=this.m_tab_control.GetTabBackground(1);
   CCanvas *tab1_foreground=this.m_tab_control.GetTabForeground(1);
//--- CCanvas objects in workspace of tab 2 (Net Profit) for drawing background images and text
   CCanvas *tab2_background=this.m_tab_control.GetTabBackground(2);
   CCanvas *tab2_foreground=this.m_tab_control.GetTabForeground(2);
//--- CCanvas objects in workspace of tab 3 (Profit Factor) for drawing background images and text
   CCanvas *tab3_background=this.m_tab_control.GetTabBackground(3);
   CCanvas *tab3_foreground=this.m_tab_control.GetTabForeground(3);
//--- CCanvas objects in workspace of tab 4 (Recovery Factor) for drawing background images and text
   CCanvas *tab4_background=this.m_tab_control.GetTabBackground(4);
   CCanvas *tab4_foreground=this.m_tab_control.GetTabForeground(4);

//--- Set tab identifiers for objects of optimization statistics charts
   this.m_chart_stat_0.SetTabID(0);
   this.m_chart_stat_1.SetTabID(1);
   this.m_chart_stat_2.SetTabID(2);
   this.m_chart_stat_3.SetTabID(3);
   this.m_chart_stat_4.SetTabID(4);

//--- Indicate for objects of statistics charts that we draw on tab with corresponding index
   this.m_chart_stat_0.SetCanvas(tab0_background, tab0_foreground);
   this.m_chart_stat_1.SetCanvas(tab1_background, tab1_foreground);
   this.m_chart_stat_2.SetCanvas(tab2_background, tab2_foreground);
   this.m_chart_stat_3.SetCanvas(tab3_background, tab3_foreground);
   this.m_chart_stat_4.SetCanvas(tab4_background, tab4_foreground);

//--- Set number of series on optimization statistics charts
   this.m_chart_stat_0.SetLines(lines);
   this.m_chart_stat_1.SetLines(lines);
   this.m_chart_stat_2.SetLines(lines);
   this.m_chart_stat_3.SetLines(lines);
   this.m_chart_stat_4.SetLines(lines);

//--- Setting background and foreground colors of optimization statistics charts
   this.m_chart_stat_0.SetBackColor(clrIvory);
   this.m_chart_stat_0.SetForeColor(C'200,200,200');
   this.m_chart_stat_1.SetBackColor(clrIvory);
   this.m_chart_stat_1.SetForeColor(C'200,200,200');
   this.m_chart_stat_2.SetBackColor(clrIvory);
   this.m_chart_stat_2.SetForeColor(C'200,200,200');
   this.m_chart_stat_3.SetBackColor(clrIvory);
   this.m_chart_stat_3.SetForeColor(C'200,200,200');
   this.m_chart_stat_4.SetBackColor(clrIvory);
   this.m_chart_stat_4.SetForeColor(C'200,200,200');

//--- Set thickness and color of selected line of best pass
   this.SetSelectedLineWidth(selected_line_width);
   this.SetSelectedLineColor(selected_line_color);

//--- Draw two tables with optimization results and input parameters on tab 0 (Optimization),
//--- and window with progress bar for printing charts and optimization process
   this.TableStatDraw(0, 4, 4, CELL_W*2, CELL_H, false);
   this.TableInpDraw(0, 4, this.m_table_stat_0.Y2()+4, CELL_W*2, CELL_H, 0, false);
   this.ChartOptDraw(0, this.m_completed, true);
//--- Create optimization replay button on tab 0
   if(!this.m_chart_stat_0.CreateButtonReplay())
     {
      Print("Button Replay creation failed");
      return INIT_FAILED;
     }

//--- Draw two tables with optimization results and input parameters on tab 1 (Sharpe Ratio),
//--- and window to print charts of optimization results
   this.TableStatDraw(1, 4, 4, CELL_W*2, CELL_H, false);
   this.TableInpDraw(1, 4, this.m_table_stat_1.Y2()+4, CELL_W*2, CELL_H, 0, false);
   this.ChartOptDraw(1, this.m_completed, true);
//--- Create result selection button on tab 1
   if(!this.m_chart_stat_1.CreateButtonResults())
     {
      Print("Tab1: There were errors when creating the result buttons");
      return INIT_FAILED;
     }

//--- Draw two tables with optimization results and input parameters on tab 2 (Net Profit),
//--- and window to print charts of optimization results
   this.TableStatDraw(2, 4, 4, CELL_W*2, CELL_H, false);
   this.TableInpDraw(2, 4, this.m_table_stat_1.Y2()+4, CELL_W*2, CELL_H, 0, false);
   this.ChartOptDraw(2, this.m_completed, true);
//--- Create result selection button on tab 2
   if(!this.m_chart_stat_2.CreateButtonResults())
     {
      Print("Tab2: There were errors when creating the result buttons");
      return INIT_FAILED;
     }

//--- Draw two tables with optimization results and input parameters on tab 3 (Profit Factor),
//--- and window to print charts of optimization results
   this.TableStatDraw(3, 4, 4, CELL_W*2, CELL_H, false);
   this.TableInpDraw(3, 4, this.m_table_stat_1.Y2()+4, CELL_W*2, CELL_H, 0, false);
   this.ChartOptDraw(3, this.m_completed, true);
//--- Create result selection button on tab 3
   if(!this.m_chart_stat_3.CreateButtonResults())
     {
      Print("Tab3: There were errors when creating the result buttons");
      return INIT_FAILED;
     }

//--- Draw two tables with optimization results and input parameters on tab 4 (Recovery Factor),
//--- and window to print charts of optimization results
   this.TableStatDraw(4, 4, 4, CELL_W*2, CELL_H, false);
   this.TableInpDraw(4, 4, this.m_table_stat_1.Y2()+4, CELL_W*2, CELL_H, 0, false);
   this.ChartOptDraw(4, this.m_completed, true);
//--- Create result selection button on tab 4
   if(!this.m_chart_stat_4.CreateButtonResults())
     {
      Print("Tab4: There were errors when creating the result buttons");
      return INIT_FAILED;
     }

   return INIT_SUCCEEDED;
  }
Hier werden alle Elemente Block für Block erstellt. Jeder Codeblock ist für die Erstellung eines Elements der Programmoberfläche verantwortlich.
Nachdem die Optimierung abgeschlossen ist, ist es notwendig, einige Änderungen an der erstellten Schnittstelle vorzunehmen – die Überschriften der Charts neu zu malen, ihre Texte zu ändern und die Schaltfläche zum Starten der Wiedergabe auf der ersten Registerkarte (mit der Kennung 0) zu drucken. All dies muss in OnTesterDeinit() implementiert werden.
OnTesterDeinit:
//+------------------------------------------------------------------+
//| It must be called in handler of OnTesterDeinit() Expert Advisor  |
//+------------------------------------------------------------------+
void CFrameViewer::OnTesterDeinit(void)
  {
//--- Get pointers to canvas to draw background and foreground
   CCanvas *background=this.m_tab_control.GetTabBackground(0);
   CCanvas *foreground=this.m_tab_control.GetTabForeground(0);

   if(background==NULL || foreground==NULL)
      return;

//--- Set optimization completion flag
   this.m_completed=true;

//--- Chart header coordinates
   int x1=this.m_chart_stat_0.HeaderX1();
   int y1=this.m_chart_stat_0.HeaderY1();
   int x2=this.m_chart_stat_0.HeaderX2();
   int y2=this.m_chart_stat_0.HeaderY2();

   int x=(x1+x2)/2;
   int y=(y1+y2)/2;

//--- Repaint background and erase header text
   background.FillRectangle(x1, y1, x2, y2, ::ColorToARGB(clrLightGreen));
   foreground.FillRectangle(x1, y1, x2, y2, 0x00FFFFFF);

//--- Change text and color of header
   string text="Optimization Complete: Click to Replay";
   foreground.FontSet("Calibri", -100, FW_BLACK);
   foreground.TextOut(x, y, text, ::ColorToARGB(clrMidnightBlue), TA_CENTER|TA_VCENTER);
   background.Update(false);
   foreground.Update(true);

//--- Get active tab index and call method for controlling print of control objects on optimization charts
   int tab_selected=this.m_tab_control.GetSelectedTabID();
   this.ControlObjectsView(tab_selected);

//--- On each tab (1-4), draw charts of three best optimization passes
   this.DrawBestFrameDataAll();
   ::ChartRedraw();
  }
Nach Abschluss eines jeden Optimierungsdurchlaufs wird ein Ereignis des Testers erzeugt, das in OnTester() behandelt werden kann. Sie wird auf der Seite der EA-Instanz gestartet, die auf dem Testagenten läuft.
In diesem Handler müssen alle Daten über den abgeschlossenen Durchgang gesammelt, ein Frame gebildet und mit der Funktion FrameAdd() an das Client-Terminal gesendet werden.
OnTester:
//+------------------------------------------------------------------+
//| Prepares array of balance values and sends it in frame           |
//| It must be called in Expert Advisor in OnTester() handler        |
//+------------------------------------------------------------------+
void CFrameViewer::OnTester(const double OnTesterValue)
  {
//--- Variables for working with pass results
   double balance[];
   int    data_count=0;
   double balance_current=::TesterStatistics(STAT_INITIAL_DEPOSIT);

//--- Temporary variables for working with trades
   ulong  ticket=0;
   double profit;
   string symbol;
   long   entry;

//--- Request entire trading history
   ::ResetLastError();
   if(!::HistorySelect(0, ::TimeCurrent()))
     {
      PrintFormat("%s: HistorySelect() failed. Error ",__FUNCTION__, ::GetLastError());
      return;
     }

//--- Collect data of trades
   uint deals_total=::HistoryDealsTotal();
   for(uint i=0; i<deals_total; i++)
     {
      ticket=::HistoryDealGetTicket(i);
      if(ticket==0)
         continue;
      symbol=::HistoryDealGetString(ticket, DEAL_SYMBOL);
      entry =::HistoryDealGetInteger(ticket, DEAL_ENTRY);
      profit=::HistoryDealGetDouble(ticket, DEAL_PROFIT);
      if(entry!=DEAL_ENTRY_OUT && entry!=DEAL_ENTRY_INOUT)
         continue;

      balance_current+=profit;
      data_count++;
      ::ArrayResize(balance, data_count);
      balance[data_count-1]=balance_current;
     }
//--- data[] array to send data to frame
   double data[];
   ::ArrayResize(data, ::ArraySize(balance)+DATA_COUNT);
   ::ArrayCopy(data, balance, DATA_COUNT, 0);

//--- Fill in first DATA_COUNT values of array with test results
   data[0]=::TesterStatistics(STAT_SHARPE_RATIO);           // Sharpe Ratio
   data[1]=::TesterStatistics(STAT_PROFIT);                 // net profit
   data[2]=::TesterStatistics(STAT_PROFIT_FACTOR);          // profit factor
   data[3]=::TesterStatistics(STAT_RECOVERY_FACTOR);        // recovery factor
   data[4]=::TesterStatistics(STAT_TRADES);                 // number of trades
   data[5]=::TesterStatistics(STAT_DEALS);                  // number of deals
   data[6]=::TesterStatistics(STAT_EQUITY_DDREL_PERCENT);   // maximum drawdown of funds as percentage
   data[7]=OnTesterValue;                                   // value of user optimization criterion
   if(data[2]==DBL_MAX)
      data[2]=0;
//--- Create data frame and send it to terminal
   if(!::FrameAdd(::MQLInfoString(MQL_PROGRAM_NAME), FRAME_ID, deals_total, data))
      ::PrintFormat("%s: Frame add error: ",__FUNCTION__, ::GetLastError());
  }
Wenn der Expert Advisor einen vom Agenten im Client-Terminal gesendeten Frame empfängt, wird das Ereignis von einem TesterPass erzeugt, das in OnTesterPass() behandelt wird.
In diesem Handler übernehmen wir die Informationen aus dem Frame, zeichnen eine Saldenkurve dieses Durchlaufs auf der Chart und füllen die Tabellen mit den Testergebnissen und Parametern aus. Wir speichern den bearbeiteten Frame in einem neuen Frame-Objekt und fügen ihn zu einer Liste von Frame hinzu, um mit ihm zu arbeiten, wenn es notwendig ist, die erforderlichen Durchgänge zu suchen, um sie auf Charts zu drucken.
OnTesterPass:
//+------------------------------------------------------------------+
//| Retrieves data frame during optimization and prints chart        |
//| It must be called in Expert Advisor in OnTesterPass() handler    |
//+------------------------------------------------------------------+
void CFrameViewer::OnTesterPass(void)
  {
//--- Variables to work with frames
   string name;
   ulong  pass;
   long   id;
   double value, data[];
   string params[];
   uint   par_count;

//--- Auxiliary variables
   static datetime start=::TimeLocal();
   static int      frame_counter=0;

//--- When receive new frame, we receive data from it
   while(!::IsStopped() && ::FrameNext(pass, name, id, value, data))
     {
      frame_counter++;
      string text=::StringFormat("Frames completed (tester passes): %d in %s", frame_counter,::TimeToString(::TimeLocal()-start, TIME_MINUTES|TIME_SECONDS));
      //--- Get input parameters of Expert Advisor, for which frame was formed, and send them to tables and on chart
      //--- Upon successful retrieval of frame write its data to frame object and locate it in list
      if(this.DrawFrameData(0, text, clrNONE, 0, pass, params, par_count, data))
        {
         //--- Results of tester's pass
         double sharpe_ratio=data[0];
         double net_profit=data[1];
         double profit_factor=data[2];
         double recovery_factor=data[3];

         //--- Create new frame object and save it in list
         CFrameData *frame=new CFrameData(pass, sharpe_ratio, net_profit, profit_factor, recovery_factor);
         if(frame!=NULL)
           {
            if(!this.AddFrame(frame))
               delete frame;
           }
         ::ChartRedraw();
        }
     }
  }
Nachdem der Optimierungsprozess abgeschlossen ist, bleibt der Expert Advisor, der im Frame-Modus läuft, im Terminal auf dem Floating Chart aktiv. Die gesamte Arbeit mit diesem Expert Advisor wird innerhalb von OnChartEvent() organisiert, da wir die Prozesse, die wir benötigen, mit Hilfe von Schaltflächen auf dem Chart und dem Mauszeiger steuern werden.
OnChartEvent:
//+------------------------------------------------------------------+
//|  Event handling on chart                                         |
//+------------------------------------------------------------------+
void CFrameViewer::OnChartEvent(const int id,const long &lparam,
                                   const double &dparam,const string &sparam,
                                   const int delay_ms)
  {
//--- Call event handlers for the tab control object and optimization result charts
   this.m_tab_control.OnChartEvent(id, lparam, dparam, sparam);
   this.m_chart_stat_0.OnChartEvent(id, lparam, dparam, sparam);
   this.m_chart_stat_1.OnChartEvent(id, lparam, dparam, sparam);
   this.m_chart_stat_2.OnChartEvent(id, lparam, dparam, sparam);
   this.m_chart_stat_3.OnChartEvent(id, lparam, dparam, sparam);
   this.m_chart_stat_4.OnChartEvent(id, lparam, dparam, sparam);

//--- If chart change event has arrived
   if(id==CHARTEVENT_CHART_CHANGE)
     {
      //--- get chart size
      int w=(int)::ChartGetInteger(0, CHART_WIDTH_IN_PIXELS);
      int h=(int)::ChartGetInteger(0, CHART_HEIGHT_IN_PIXELS);
      if(w!=this.m_w || h!=this.m_h)
        {
         if(w==0 || h==0)
            return;

         //--- Change size of Tab Control
         this.m_tab_control.Resize(w, h);

         //--- Get ID of selected tab and draw data tables and optimization chart on tab
         int tab_selected=this.m_tab_control.GetSelectedTabID();
         this.DrawDataChart(tab_selected);

         //--- Get pointer to toggle button and selected button for printing optimization results
         CButtonSwitch *button_switch=(tab_selected>0 ? this.GetChartStats(tab_selected).ButtonResult() : NULL);
         uint res_index=(button_switch!=NULL ? button_switch.SelectedButton() : -1);

         //--- Depending on selected tab
         switch(tab_selected)
           {
            //--- tab 0 (Optimization)
            case 0 :
               //--- Draw chart with line of last pass and two empty tables
               this.DrawDataChart(0);
               //--- It starts replay of performed optimization,
               //--- which stops working with the rest while replay goes on
               //if(this.m_completed)
               //   this.ReplayFrames(1);
              break;

            //--- tabs 1 - 4
            default:
               //--- Retrieve index of selected optimization pass button
               res_index=button_switch.SelectedButton();
               //--- Draw chart with results of three best passes of selected tab
               this.DrawDataChart(tab_selected);
               this.DrawBestFrameData(tab_selected, -1);
               this.DrawBestFrameData(tab_selected, res_index);

               //--- On tab 0 draw chart with line of last pass and two empty tables
               this.DrawDataChart(0);
               //--- It starts replay of performed optimization,
               //--- which stops working with the rest while replay goes on
               //--- To re-draw charts of all passes, you can click replay button
               //if(this.m_completed)
               //   this.ReplayFrames(1);
              break;
           }

         //--- Remember new dimensions for later verification
         this.m_w=w;
         this.m_h=h;
        }
     }

//--- If optimization process is not completed, exit
   if(!this.m_completed)
      return;

//--- If custom event has arrived
   if(id>CHARTEVENT_CUSTOM)
     {
      //--- If Replay button event has arrived and optimization is complete
      if(sparam==this.m_chart_stat_0.ButtonReplay().Name() && this.m_completed)
        {
         //--- hide Replay button,
         this.m_chart_stat_0.ButtonReplay().Hide();

         //--- Initialize chart of optimization results,
         this.ChartOptDraw(0, this.m_completed, true);

         //--- start replay,
         this.m_completed=false;       // block it so as not to run it several times in a row
         this.ReplayFrames(delay_ms);  // replay procedure
         this.m_completed=true;        // unlock

         //--- After replay is complete, show Replay button and redraw chart
         this.m_chart_stat_0.ButtonReplay().Show();
         ::ChartRedraw();
        }

      //--- Get pointers to tab buttons
      CTabButton *tab_btn0=this.m_tab_control.GetTabButton(0);
      CTabButton *tab_btn1=this.m_tab_control.GetTabButton(1);
      CTabButton *tab_btn2=this.m_tab_control.GetTabButton(2);
      CTabButton *tab_btn3=this.m_tab_control.GetTabButton(3);
      CTabButton *tab_btn4=this.m_tab_control.GetTabButton(4);
      if(tab_btn0==NULL || tab_btn1==NULL || tab_btn2==NULL || tab_btn3==NULL || tab_btn4==NULL)
         return;

      //--- Get ID of selected tab
      int tab_selected=this.m_tab_control.GetSelectedTabID();

      //--- If switch event has arrived to tab 0
      if(sparam==tab_btn0.Name())
        {
         //--- On tab 0, draw chart with last pass line and two tables with empty results
         this.DrawDataChart(0);
         //--- It starts replay of performed optimization
         //--- (it can take a long time - if desired, you can click Replay button to print charts)
         //if(this.m_completed)
         //   this.ReplayFrames(1);
         ::ChartRedraw();
         return;
        }

      //--- Get pointer to chart of selected tab
      CStatChart *chart_stat=this.GetChartStats(tab_selected);
      if(tab_selected==0 || chart_stat==NULL)
         return;
      //--- Get pointers to chart buttons of selected tab (tab index 1-4)
      CButtonTriggered *button_min=chart_stat.ButtonResultMin();
      CButtonTriggered *button_mid=chart_stat.ButtonResultMid();
      CButtonTriggered *button_max=chart_stat.ButtonResultMax();
      if(button_min==NULL || button_mid==NULL || button_max==NULL)
         return;

      //--- If switch event has arrived to tab 1
      if(sparam==tab_btn1.Name())
        {
         //--- call handler for switching to tab
         this.OnTabSwitchEvent(1);
        }
      //--- If switch event has arrived to tab 2
      if(sparam==tab_btn2.Name())
        {
         //--- call handler for switching to tab
         this.OnTabSwitchEvent(2);
        }
      //--- If switch event has arrived to tab 3
      if(sparam==tab_btn3.Name())
        {
         //--- call handler for switching to tab
         this.OnTabSwitchEvent(3);
        }
      //--- If switch event has arrived to tab 4
      if(sparam==tab_btn4.Name())
        {
         //--- call handler for switching to tab
         this.OnTabSwitchEvent(4);
        }

      //--- If event has arrived click on minimum result button of selected tab
      if(sparam==button_min.Name())
        {
         //--- call handler for toggle button switching
         this.OnButtonSwitchEvent(tab_selected, 0);
        }
      //--- If event has arrived click on mid result button of selected tab
      if(sparam==button_mid.Name())
        {
         //--- call handler for toggle button switching
         this.OnButtonSwitchEvent(tab_selected, 1);
        }
      //--- If event has arrived click on max result button of selected tab
      if(sparam==button_max.Name())
        {
         //--- call handler for toggle button switching
         this.OnButtonSwitchEvent(tab_selected, 2);
        }
     }
  }
Die Ereignisse für das Umschalten der Registerkarte und das Klicken der Umschaltknöpfe werden in den entsprechenden nutzerdefinierten Handlern behandelt. Alle dort durchgeführten Aktionen sind identisch. Der einzige Unterschied besteht in der Registerkarten-ID. Daher sind diese Ereignisse so konzipiert, dass sie in eigenen Handlern behandelt werden.
Handler für den Tabulatorwechsel:
//+------------------------------------------------------------------+
//| ▸Tab switching handler                                           |
//+------------------------------------------------------------------+
void CFrameViewer::OnTabSwitchEvent(const int tab_id)
  {
   //--- Get pointer to chart of selected tab
   CStatChart *chart_stat=this.GetChartStats(tab_id);
   if(chart_stat==NULL)
      return;

   //--- Get pointer to chart toggle button of selected tab
   CButtonSwitch *button_switch=chart_stat.ButtonResult();
   if(button_switch==NULL)
      return;

   //--- Index of pressed button
   uint butt_index=button_switch.SelectedButton();
   //--- Initialize chart of results on tab_id and
   this.DrawDataChart(tab_id);
   //--- call method that controls display of control elements on all tabs
   this.ControlObjectsView(tab_id);

   //--- Draw all three best passes
   this.DrawBestFrameData(tab_id, -1);
   //--- Highlight pass selected by button
   this.DrawBestFrameData(tab_id, butt_index);
  }
Handler für das Umschalten von Schaltflächen:
//+------------------------------------------------------------------+
//| Handler for toggle button switching                              |
//+------------------------------------------------------------------+
void CFrameViewer::OnButtonSwitchEvent(const int tab_id, const uint butt_id)
  {
   //--- Initialize chart of results on tab_id
   this.DrawDataChart(tab_id);
   //--- Draw all three best passes
   this.DrawBestFrameData(tab_id, -1);
   //--- Highlight pass selected by butt_id button
   this.DrawBestFrameData(tab_id, butt_id);
  }
Eine Methode, die Datentabellen und Optimierungsdiagramme zeichnet:
//+------------------------------------------------------------------+
//| Draws data tables and optimization chart                         |
//+------------------------------------------------------------------+
void CFrameViewer::DrawDataChart(const uint tab_id)
  {
//--- Draw table of statistics, table of input parameters, and optimization chart
   this.TableStatDraw(tab_id, 4, 4, CELL_W*2, CELL_H, false);
   this.TableInpDraw(tab_id, 4, this.GetTableStats(tab_id).Y2()+4, CELL_W*2, CELL_H, this.GetTableInputs(tab_id).RowsTotal(), false);
   this.ChartOptDraw(tab_id, this.m_completed, true);
   //--- call method that controls display of control elements on all tabs
   this.ControlObjectsView(tab_id);
  }
Nachdem alle Tabellen und Charts gezeichnet sind, müssen die Steuerelemente richtig angeordnet werden. Ausblenden von Schaltflächen auf inaktiven Registerkarten und Anzeigen von Schaltflächen auf der aktiven Registerkarte. Dies wird durch die Methode ControlObjectsView implementiert.
Eine Methode, die die Anzeige von Steuerelementen in Optimierungsdiagrammen steuert:
//+-------------------------------------------------------------------+
//|Controls view of control objects on optimization charts            |
//+-------------------------------------------------------------------+
void CFrameViewer::ControlObjectsView(const uint tab_id)
  {
//--- Get index of active tab
   int tab_index=this.m_tab_control.GetSelectedTabID();

//--- Get pointer to active tab and optimization statistics table
   CTab              *tab=this.m_tab_control.GetTab(tab_index);
   CTableDataControl *table_stat=this.GetTableStats(tab_index);

   if(tab==NULL || table_stat==NULL)
      return;

//--- Coordinates of left and right boundaries of header of optimization results chart
   int w=0, cpx=0, x=0, y=0;
   int x1=table_stat.X2()+10;
   int x2=tab.GetField().Right()-10;

//--- Depending on selected tab index
   switch(tab_index)
     {
      //--- Optimization
      case 0 :
         //--- Shift Replay button to center of header
         w=this.m_chart_stat_0.ButtonReplay().Width();
         cpx=(x1+x2)/2;
         x=cpx-w/2;
         this.m_chart_stat_0.ButtonReplay().MoveX(x);

         //--- If optimization is completed, show button in foreground
         if(this.m_completed)
           {
            this.m_chart_stat_0.ButtonReplay().Show();
            this.m_chart_stat_0.ButtonReplay().BringToTop();
           }

         //--- Hide buttons of all other tabs
         this.m_chart_stat_1.ButtonsResultHide();
         this.m_chart_stat_2.ButtonsResultHide();
         this.m_chart_stat_3.ButtonsResultHide();
         this.m_chart_stat_4.ButtonsResultHide();
        break;

      //--- Sharpe Ratio
      case 1 :
         //--- Hide Replay button
         this.m_chart_stat_0.ButtonReplay().Hide();

         //--- Get Y coordinate and move toggle button to it
         y=this.m_chart_stat_1.ProgressBarY1()+CELL_H+2;
         this.m_chart_stat_1.ButtonResult().MoveY(y);

         //--- Move toggle button on tab 1 to foreground,
         //--- and hide all other buttons on other tabs
         this.m_chart_stat_1.ButtonsResultBringToTop();
         this.m_chart_stat_2.ButtonsResultHide();
         this.m_chart_stat_3.ButtonsResultHide();
         this.m_chart_stat_4.ButtonsResultHide();
        break;

      //--- Net Profit
      case 2 :
         this.m_chart_stat_0.ButtonReplay().Hide();

         //--- Get Y coordinate and move toggle button to it
         y=this.m_chart_stat_2.ProgressBarY1()+CELL_H+2;
         this.m_chart_stat_2.ButtonResult().MoveY(y);

         //--- Move toggle button on tab 2 to foreground,
         //--- and hide all other buttons on other tabs
         this.m_chart_stat_2.ButtonsResultBringToTop();
         this.m_chart_stat_1.ButtonsResultHide();
         this.m_chart_stat_3.ButtonsResultHide();
         this.m_chart_stat_4.ButtonsResultHide();
        break;

      //--- Profit Factor
      case 3 :
         this.m_chart_stat_0.ButtonReplay().Hide();

         //--- Get Y coordinate and move toggle button to it
         y=this.m_chart_stat_3.ProgressBarY1()+CELL_H+2;
         this.m_chart_stat_3.ButtonResult().MoveY(y);

         //--- Move toggle button on tab 3 to foreground,
         //--- and hide all other buttons on other tabs
         this.m_chart_stat_3.ButtonsResultBringToTop();
         this.m_chart_stat_1.ButtonsResultHide();
         this.m_chart_stat_2.ButtonsResultHide();
         this.m_chart_stat_4.ButtonsResultHide();
        break;

      //--- Recovery Factor
      case 4 :
         this.m_chart_stat_0.ButtonReplay().Hide();

         //--- Get Y coordinate and move toggle button to it
         y=this.m_chart_stat_4.ProgressBarY1()+CELL_H+2;
         this.m_chart_stat_4.ButtonResult().MoveY(y);

         //--- Move toggle button on tab 4 to foreground,
         //--- and hide all other buttons on other tabs
         this.m_chart_stat_4.ButtonsResultBringToTop();
         this.m_chart_stat_1.ButtonsResultHide();
         this.m_chart_stat_2.ButtonsResultHide();
         this.m_chart_stat_3.ButtonsResultHide();
        break;
      default:
        break;
     }
//--- Redraw chart
   ::ChartRedraw();
  }
Eine Methode, die Frames nach Abschluss der Optimierung wiedergibt:
//+------------------------------------------------------------------+
//| Replaying frames after optimization completion                   |
//+------------------------------------------------------------------+
void CFrameViewer::ReplayFrames(const int delay_ms)
  {
//--- Variables to work with frames
   string name;
   ulong  pass;
   long   id;
   double value, data[];
   string params[];
   uint   par_count;

//--- Frame counter
   int frame_counter=0;

//--- Reset progress bar counters
   this.m_progress_bar.Reset();
   this.m_progress_bar.Update(false);

//--- Move frame pointer to the beginning and start iterating through frames
   ::FrameFirst();
   while(!::IsStopped() && ::FrameNext(pass, name, id, value, data))
     {
      //--- Increase frame counter and prepare header text of optimization chart
      frame_counter++;
      string text=::StringFormat("Playing with pause %d ms: frame %d", delay_ms, frame_counter);
      //--- Get input parameters of Expert Advisor, for which frame is formed, frame data, and print them on chart
      if(this.DrawFrameData(0, text, clrNONE, 0, pass, params, par_count, data))
         ::ChartRedraw();

      //--- Wait for delay_ms milliseconds
      ::Sleep(delay_ms);
     }
  }
Alle empfangenen Bilder sind nach der Optimierung zur Ansicht verfügbar. Hier werden in einer einfachen Schleife vom ersten Frame an alle verfügbaren Frames durchlaufen und ihre Daten in Tabellen und auf dem Chart ausgegeben.
Eine Methode, die die Daten des angegebenen Frames auf dem Optimierungsdiagramm ausgibt:
//+------------------------------------------------------------------+
//| Prints data of specified frame on optimization chart             |
//+------------------------------------------------------------------+
bool CFrameViewer::DrawFrameDataByPass(const uint tab_id, const ulong pass_num, const string text, color clr, const uint line_width, double &data[])
  {
//--- Variables to work with frames
   string name;
   ulong  pass;
   long   id;
   uint   par_count;
   double value;
   string params[];

//--- Move frame pointer to the beginning and start search of pass_num frame
   ::FrameFirst();
   while(::FrameNext(pass, name, id, value, data))
     {
      //--- If passe number matches the desired one -
      //--- get frame data and print it in table
      //--- and on chart on tab tab_id
      if(pass==pass_num)
        {
         if(DrawFrameData(tab_id, text, clr, line_width, pass, params, par_count, data))
            return true;
        }
     }
//--- Pass not found
   return false;
  }
Da die nach der Optimierung verfügbaren Bilder nur in einer Schleife von FrameFirst() --> FrameNext() und unter Verwendung von Standardmethoden abgerufen werden können, durchlaufen wir hier alle verfügbaren Bilder auf der Suche nach dem gewünschten Durchgang. Sobald der gewünschte Frame gefunden ist, werden seine Daten auf dem Chart ausgedruckt.
Grundsätzlich haben wir nach der Optimierung eine fertige Liste von Frame-Objekten, und wir können das gewünschte Objekt schnell aus der Liste holen. Sie können einen solchen Zugriff auf den gewünschten Frame verwenden, aber in diesem Fall müssen Sie weitere Methoden implementieren, um Daten aus dem Frame-Objekt und dem Serien-Array abzurufen, sie in das gewünschte Format zu konvertieren und sie im Chart zu drucken. Der Zugriff wurde jedoch genau so belassen, wie er in der obigen Methode dargestellt ist, um die Menge des Codes in der Klasse zu reduzieren und das Verständnis zu vereinfachen.
Eine Methode, die Charts der drei besten Durchgänge nach Optimierungskriterien erstellt:
//+------------------------------------------------------------------+
//| Draws charts of top three passes by optimization criterion       |
//+------------------------------------------------------------------+
void CFrameViewer::DrawBestFrameData(const uint tab_id, const int res_index)
  {
//--- If incorrect identifiers of table and pressed button are passed, exit
   if(tab_id<1 || tab_id>4 || res_index>2)
     {
      ::PrintFormat("%s: Error. Incorrect table (%u) or selected button (%d) identifiers passed",__FUNCTION__, tab_id, res_index);
      return;
     }

//--- Arrays for getting results of passes
   ulong array_passes[3];
   double data[];

//--- Create header text of pass chart
   string res=
     (
      tab_id==1 ? "Results by Sharpe Ratio"     :
      tab_id==2 ? "Results by Net Profit"       :
      tab_id==3 ? "Results by Profit Factor"    :
      tab_id==4 ? "Results by Recovery Factor"  :
      ""
     );
   string text="Optimization Completed: "+res;

//--- Fill in array_passes array by indexes of three best passes
   this.FillArrayBestFrames(tab_id, array_passes);
//--- If index of pass button is set to negative number -
   if(res_index<0)
     {
      //--- print all three passes on chart
      //--- (line color is specified as clrNONE for automatic line color selection of profitable or loss series)
      for(int i=0; i<(int)array_passes.Size(); i++)
         this.DrawFrameDataByPass(tab_id, array_passes[i], text, clrNONE, 0, data);
     }
   //--- Otherwise, print series indicated by index of pressed button on chart (res_index),
   //--- by color set in m_selected_color, and width specified in m_line_width
   else
      this.DrawFrameDataByPass(tab_id, array_passes[res_index], text, this.m_selected_color, this.m_line_width, data);
  }
Hier wird das Array zunächst mit den Frame-Indizes der drei besten Durchgänge in der FillArrayBestFrames()-Methode gefüllt, und dann wird der gewünschte Durchgang (oder alle drei) auf dem Chart ausgedruckt.
Eine Methode, die ein Array mit den Frame-Indizes der drei besten Durchläufe für das angegebene Optimierungskriterium füllt:
//+------------------------------------------------------------------+
//| Fills array with frame indexes of top three passes               |
//| for specified optimization criterion (by tab index)              |
//+------------------------------------------------------------------+
bool CFrameViewer::FillArrayBestFrames(const uint tab_id, ulong &array_passes[])
  {
//--- Clear array of optimization pass indexes passed to method
   ::ZeroMemory(array_passes);

   //FRAME_PROP_PASS_NUM,           // Pass number
   //FRAME_PROP_SHARPE_RATIO,       // Sharpe Ratio result
   //FRAME_PROP_NET_PROFIT,         // Net Profit result
   //FRAME_PROP_PROFIT_FACTOR,      // Profit Factor result
   //FRAME_PROP_RECOVERY_FACTOR,    // Recovery Factor result

//--- By using tab ID, determine property by which best optimization passes will be searched
//--- Check tab ID to be within 1 to 4
   if(tab_id<FRAME_PROP_SHARPE_RATIO || tab_id>FRAME_PROP_RECOVERY_FACTOR)
     {
      ::PrintFormat("%s: Error: Invalid tab ID passed (%u)",__FUNCTION__, tab_id);
      return false;
     }

//--- Convert table ID to frame property
   ENUM_FRAME_PROP prop=(ENUM_FRAME_PROP)tab_id;

//--- Sort frame list in ascending order by property,
//--- which corresponds to tab_id value as ENUM_FRAME_PROP
   this.m_list_frames.Sort(prop);

//--- After sorting, frame with best result will be at list end
//--- Using index, get frame from list with maximum result value and
   int index=this.m_list_frames.Total()-1;
   CFrameData *frame_next=this.m_list_frames.At(index);
   if(frame_next==NULL)
      return false;

//--- register pass number to last cell of array_passes
   array_passes[2]=frame_next.Pass();

//--- Now find objects for which optimization result in descending order is less than maximum found
//--- In loop from 1 to 0 (remaining cells of array_passes)
   for(int i=1; i>=0; i--)
     {
      //--- look for previous object with property value less than that of frame_next object
      frame_next=this.FrameSearchLess(frame_next, prop);
      //--- In next cell of array_passes, enter pass number of found object
      //--- If object is not found, it means that there are no objects with value less than that of frame_next object,
      //--- and in this case, enter its previous value to next cell of array_passes
      array_passes[i]=(frame_next!=NULL ? frame_next.Pass() : array_passes[i+1]);
     }
//--- Success
   return true;
  }
Die gesamte Logik der Methode wird in den Kommentaren zum Code ausführlich erläutert. Am Ende des Methodenlaufs im Array werden die Nummern der ersten drei Durchgänge mit der Größe 3 durch das Optimierungskriterium, das der Tabellennummer entspricht, aufgezeichnet, auf dem Chart müssen die Daten dieser Durchgänge gedruckt werden. Die Methode FrameSearchLess() wird verwendet, um nach Frame zu suchen, deren Eigenschaftswert niedriger ist als der des aktuellen Frames.
Eine Methode zum Suchen und Zurückgeben eines Zeigers auf ein Frame-Objekt mit einem Eigenschaftswert, der kleiner ist als die Probe:
//+------------------------------------------------------------------+
//| Searches for and returns pointer to frame object,                |
//| with property value less than sample                             |
//+------------------------------------------------------------------+
CFrameData *CFrameViewer::FrameSearchLess(CFrameData *frame, const int mode)
  {
//--- Depending on type of frame property
   switch(mode)
     {
      //--- to temporary object record corresponding property of object passed to method
      case FRAME_PROP_SHARPE_RATIO     :  this.m_frame_tmp.SetSharpeRatio(frame.SharpeRatio());       break;
      case FRAME_PROP_NET_PROFIT       :  this.m_frame_tmp.SetNetProfit(frame.NetProfit());           break;
      case FRAME_PROP_PROFIT_FACTOR    :  this.m_frame_tmp.SetProfitFactor(frame.ProfitFactor());     break;
      case FRAME_PROP_RECOVERY_FACTOR  :  this.m_frame_tmp.SetRecoveryFactor(frame.RecoveryFactor()); break;
      default                          :  this.m_frame_tmp.SetPass(frame.Pass());                     break;
     }
//--- Sort array of frames by specified property and
   this.m_list_frames.Sort(mode);
//--- get index of nearest object with lower property value, or -1
   int index=this.m_list_frames.SearchLess(&this.m_frame_tmp);
//--- Get object by index from list and return pointer to it, or NULL
   CFrameData *obj=this.m_list_frames.At(index);
   return obj;
  }
Der Methode wird ein Frame übergeben, und in der sortierten Liste der Frame wird die Methode SearchLess() der Klasse CArrayObj der Standardbibliothek verwendet, um das nächstgelegene Objekt zu suchen, dessen Eigenschaftswert kleiner ist als der des an die Methode übergebenen Objekts.
Eine Methode, die auf jeder Registerkarte die drei besten Durchläufe auf den Charts der Optimierungsergebnisse ausgibt
//+------------------------------------------------------------------+
//| Prints on optimization results charts                            |
//| on each tab three best passes                                    |
//+------------------------------------------------------------------+
void CFrameViewer::DrawBestFrameDataAll(void)
  {
//--- In a loop through all tabs from tab 1, draw charts of top three passes for each tab
   for(int i=1; i<this.m_tab_control.TabsTotal(); i++)
      this.DrawBestFrameData(i,-1);
  }
Eine Methode zum Abrufen von Daten des aktuellen Frames und zum Drucken dieser Daten auf einer bestimmten Registerkarte in einer Tabelle und auf einem Chart mit Optimierungsergebnissen:
//+-------------------------------------------------------------------+ //| Retrieving data of current frame and printing it on specified tab | //| in table and on optimization results chart | //+-------------------------------------------------------------------+ bool CFrameViewer::DrawFrameData(const uint tab_id, const string text, color clr, const uint line_width, ulong &pass, string ¶ms[], uint &par_count, double &data[]) { //--- Check passed tab ID if(tab_id>4) { ::PrintFormat("%s: Error: Invalid tab ID passed (%u)",__FUNCTION__, tab_id); return false; } //--- Get pointers to objects used on specified tab CCanvas *foreground=this.m_tab_control.GetTabForeground(tab_id); CTableDataControl *table_stat=this.GetTableStats(tab_id); CTableDataControl *table_inp=this.GetTableInputs(tab_id); CStatChart *chart_stat=this.GetChartStats(tab_id); if(foreground==NULL || table_stat==NULL || table_inp==NULL || chart_stat==NULL) return false; //--- Get input parameters of Expert Advisor, for which frame is formed, frame data, and print them on chart ::ResetLastError(); if(::FrameInputs(pass, params, par_count)) { //--- Draw table of input parameters on chart this.TableInpDraw(tab_id, 4, table_stat.Y2()+4, CELL_W*2, CELL_H, par_count, false); //--- Iterate through parameters, params[i], string looks as "parameter=value" for(uint i=0; i<par_count; i++) { //--- Fill in table with names and values of input parameters string array[]; //--- Split string in params[i] into two substrings and update cells in string of test parameters table if(::StringSplit(params[i],'=',array)==2) { //--- Fill in strings of optimized parameters with pale yellow color, //--- parameters that are not available for optimization - to pale pink, the rest - to default colors bool enable=false; double value=0, start=0, step=0, stop=0; color clr=clrMistyRose; if(::ParameterGetRange(array[0], enable, value, start, step, stop)) clr=(enable ? clrLightYellow : clrNONE); //--- Get two cells of table by parameter index and print text of parameter name and its value to them CTableCell *cell_0=table_inp.GetCell(i, 0); CTableCell *cell_1=table_inp.GetCell(i, 1); if(cell_0!=NULL && cell_1!=NULL) { //--- Update captions in cells cell_0.SetText(array[0]); cell_1.SetText(array[1]); cell_0.TextOut(foreground, 4, CELL_H/2, clr, 0, TA_VCENTER); cell_1.TextOut(foreground, 4, CELL_H/2, clr, 0, TA_VCENTER); } } } //--- Update optimization statistics table //--- Table header string foreground.FillRectangle(table_stat.X1()+1, 4+1, table_stat.X1()+CELL_W*2-1, 4+CELL_H-1, 0x00FFFFFF); foreground.FontSet("Calibri", -100, FW_BLACK); foreground.TextOut(4+(CELL_W*2)/2, 4+CELL_H/2, ::StringFormat("Optimization results (pass %I64u)", pass), ::ColorToARGB(clrMidnightBlue), TA_CENTER|TA_VCENTER); //--- In loop by number of strings in table int total=table_stat.RowsTotal(); for(int i=0; i<total; i++) { //--- get two cells of current string and CTableCell *cell_0=table_stat.GetCell(i, 0); CTableCell *cell_1=table_stat.GetCell(i, 1); if(cell_0!=NULL && cell_1!=NULL) { //--- update values of pass results in second cell string text="---"; switch(i) { case 0 : text=::StringFormat("%.2f", data[0]); break; // Sharpe Ratio case 1 : text=::StringFormat("%.2f", data[1]); break; // Net Profit case 2 : text=::StringFormat("%.2f", data[2]); break; // Profit Factor case 3 : text=::StringFormat("%.2f", data[3]); break; // Recovery Factor case 4 : text=::StringFormat("%.0f", data[4]); break; // Trades case 5 : text=::StringFormat("%.0f", data[5]); break; // Deals case 6 : text=::StringFormat("%.2f%%", data[6]);break; // Equity DD case 7 : text=::StringFormat("%G", data[7]); break; // OnTester() default: break; } //--- Highlight background of table string corresponding to selected tab with color. //--- Remaining strings will have default color color clr=(tab_id>0 ? (i==tab_id-1 ? C'223,242,231' : clrNONE) : clrNONE); //--- Update captions in cells cell_0.TextOut(foreground, 4, CELL_H/2, clr, 0, TA_VCENTER); cell_1.SetText(text); cell_1.TextOut(foreground, 4, CELL_H/2, clr, 0, TA_VCENTER); } } //--- Array for accepting values of balance of current frame double seria[]; ::ArrayCopy(seria, data, 0, DATA_COUNT, ::ArraySize(data)-DATA_COUNT); //--- Send array for printing on special balance chart chart_stat.AddSeria(seria, data[1]>0); //--- Update balance lines on chart chart_stat.Update(clr, line_width, false); //--- Update progress bar (only for tab with ID 0) if(tab_id==0) this.m_progress_bar.AddResult(data[1]>0, false); //--- Update caption on chart header int x1=chart_stat.HeaderX1(); int y1=chart_stat.HeaderY1(); int x2=chart_stat.HeaderX2(); int y2=chart_stat.HeaderY2(); int x=(x1+x2)/2; int y=(y1+y2)/2; foreground.FillRectangle(x1, y1, x2, y2, 0x00FFFFFF); foreground.FontSet("Calibri", -100, FW_BLACK); foreground.TextOut(x, y, text, ::ColorToARGB(clrMidnightBlue), TA_CENTER|TA_VCENTER); foreground.Update(false); //--- Success return true; } //--- Failed... else PrintFormat("%s: FrameInputs() failed. Error %d",__FUNCTION__, ::GetLastError()); return false; }
Bei der Methode werden die Daten aus dem Frame abgerufen, alle Tabellen mit diesen Daten gefüllt und eine Saldenkurve dieses Optimierungsdurchgangs erstellt.
Eine Methode, die eine Tabelle mit Optimierungsstatistiken auf der angegebenen Registerkarte zeichnet:
//+------------------------------------------------------------------+
//| Draws table of optimization statistics on specified tab          |
//+------------------------------------------------------------------+
void CFrameViewer::TableStatDraw(const uint tab_id, const int x, const int y, const int w, const int h, const bool chart_redraw)
  {
//--- Check passed tab ID
   if(tab_id>4)
     {
      ::PrintFormat("%s: Error: Invalid tab ID passed (%u)",__FUNCTION__, tab_id);
      return;
     }
//--- Get pointers to objects used on specified tab
   CCanvas           *background=this.m_tab_control.GetTabBackground(tab_id);
   CCanvas           *foreground=this.m_tab_control.GetTabForeground(tab_id);
   CTableDataControl *table_stat=this.GetTableStats(tab_id);

   if(background==NULL || foreground==NULL || table_stat==NULL)
      return;

//--- Draw header of optimization results table
   background.FillRectangle(x, y, x+CELL_W*2, y+CELL_H, ::ColorToARGB(C'195,209,223'));   // C'180,190,230'
   foreground.FillRectangle(x+1, y+1, x+CELL_W*2-1, y+CELL_H-1, 0x00FFFFFF);
   foreground.FontSet("Calibri", -100, FW_BLACK);
   foreground.TextOut(x+(CELL_W*2)/2, y+CELL_H/2, "Optimization results", ::ColorToARGB(clrMidnightBlue), TA_CENTER|TA_VCENTER);

//--- Set table's identifier and draw table grid
   table_stat.SetID(TABLE_OPT_STAT_ID+10*tab_id);
   table_stat.DrawGrid(background, x, y+CELL_H, 0, DATA_COUNT, 2, CELL_H, CELL_W, C'200,200,200', false);

//--- Draw empty table of optimization results - only headers, without values
//--- In a loop by table rows
   int total=table_stat.RowsTotal();
   for(int row=0; row<total; row++)
     {
      //--- iterate through columns of rows
      for(int col=0; col<2; col++)
        {
         //--- Get table cell in current row and column
         CTableCell *cell=table_stat.GetCell(row, col);
         //--- Define text in cell
         //--- For left cell, these will be headers of results of parameters optimized
         if(col%2==0)
           {
            string text="OnTester()";
            switch(row)
              {
               case 0 : text="Sharpe Ratio";    break;
               case 1 : text="Net Profit";      break;
               case 2 : text="Profit Factor";   break;
               case 3 : text="Recovery Factor"; break;
               case 4 : text="Trades";          break;
               case 5 : text="Deals";           break;
               case 6 : text="Equity DD";       break;
               default: break;
              }
            cell.SetText(text);
           }
         //--- For right cell, text will be strikeout for table initialized
         else
            cell.SetText(tab_id==0 ? " --- " : "");

         //--- Print corresponding text in cell
         cell.TextOut(foreground, 4, CELL_H/2, clrNONE, 0, TA_VCENTER);
        }
     }

//--- Update background and foreground canvas
   background.Update(false);
   foreground.Update(chart_redraw);
  }
Die Methode zeichnet eine Tabelle der Optimierungsergebnisse, wobei nur die Zeilenköpfe der Tabelle ausgefüllt werden. Die Datenzellen werden nach der oben beschriebenen Methode in die Tabelle eingegeben.
Eine Zeichenmethode für die Tabelle mit Eingabeparametern für die Optimierung auf der angegebenen Registerkarte:
//+------------------------------------------------------------------+
//|Draws table of input optimization parameters on the specified tab |
//+------------------------------------------------------------------+
void CFrameViewer::TableInpDraw(const uint tab_id, const int x, const int y, const int w, const int h, const uint rows, const bool chart_redraw)
  {
//--- Check passed tab ID
   if(tab_id>4)
     {
      ::PrintFormat("%s: Error: Invalid tab ID passed (%u)",__FUNCTION__, tab_id);
      return;
     }
//--- Get pointers to objects used on specified tab
   CCanvas           *background=this.m_tab_control.GetTabBackground(tab_id);
   CCanvas           *foreground=this.m_tab_control.GetTabForeground(tab_id);
   CTableDataControl *table_inp=this.GetTableInputs(tab_id);

   if(background==NULL || foreground==NULL || table_inp==NULL)
      return;

//--- Draw header of optimization parameters table
   background.FillRectangle(x, y, x+CELL_W*2, y+CELL_H, ::ColorToARGB(C'195,209,223'));
   foreground.FillRectangle(x+1, y+1, x+CELL_W*2-1, y+CELL_H-1, 0x00FFFFFF);
   foreground.FontSet("Calibri", -100, FW_BLACK);
   foreground.TextOut(x+(CELL_W*2)/2, y+CELL_H/2, "Input parameters", ::ColorToARGB(clrMidnightBlue), TA_CENTER|TA_VCENTER);

//--- Set table's identifier and draw table grid
   table_inp.SetID(TABLE_OPT_INP_ID+10*tab_id);
   table_inp.DrawGrid(background, x, y+CELL_H, 0, rows, 2, CELL_H, CELL_W, C'200,200,200', false);

//--- Update background and foreground canvas
   background.Update(false);
   foreground.Update(chart_redraw);
  }
Diese Methode zeichnet genau wie die vorhergehende eine leere Tabelle mit Optimierungsparametern, die in der Methode DrawFrameData() mit Daten gefüllt wird, wobei die Parameter, mit denen ein Durchlauf des Testers durchgeführt wurde, bereits bekannt sind.
Eine Methode, die das Optimierungsdiagramm auf der angegebenen Registerkarte zeichnet:
//+------------------------------------------------------------------+
//| Draws chart of optimization on specified tab                     |
//+------------------------------------------------------------------+
void CFrameViewer::ChartOptDraw(const uint tab_id, const bool opt_completed, const bool chart_redraw)
  {
//--- Check passed tab ID
   if(tab_id>4)
     {
      ::PrintFormat("%s: Error: Invalid tab ID passed (%u)",__FUNCTION__, tab_id);
      return;
     }
//--- Get pointers to objects used on specified tab
   CCanvas           *background=this.m_tab_control.GetTabBackground(tab_id);
   CCanvas           *foreground=this.m_tab_control.GetTabForeground(tab_id);
   CTab              *tab=this.m_tab_control.GetTab(tab_id);
   CTableDataControl *table_stat=this.GetTableStats(tab_id);
   CStatChart        *chart_stat=this.GetChartStats(tab_id);

   if(background==NULL || foreground==NULL || tab==NULL || table_stat==NULL || chart_stat==NULL)
      return;

//--- Calculate coordinates of four corners of optimization results chart
   int x1=table_stat.X2()+10;
   int y1=table_stat.Y1();
   int x2=tab.GetField().Right()-10;
   int y2=tab.GetField().Bottom()-tab.GetButton().Height()-12;

//--- Check size limits by minimum width and height (480 x 180)
   int w_min=480;
   if(x2-x1<w_min)
      x2=x1+w_min;
   if(y2-y1<180)
      y2=y1+180;

//--- Set dimensions of bounding rectangle of optimization results chart
   chart_stat.SetChartBounds(x1, y1, x2, y2);

//--- Color and text of chart header
   color clr=clrLightGreen;   // header color at optimization completion
   string suff=
     (
      tab_id==1 ? "Results by Sharpe Ratio"     :
      tab_id==2 ? "Results by Net Profit"       :
      tab_id==3 ? "Results by Profit Factor"    :
      tab_id==4 ? "Results by Recovery Factor"  :
                     "Click to Replay"
     );
   string text="Optimization Completed: "+suff;

//--- If optimization is not completed, specify color and text of header
   if(!opt_completed)
     {
      clr=C'195,209,223';
      text=::StringFormat("Optimization%sprogress%s", (tab_id==0 ? " " : " in "), (tab_id==0 ? "" : ": Waiting ... "));
     }

//--- Draw header and text
   background.FillRectangle(x1, 4, x2, y1, ::ColorToARGB(clr));
   foreground.FillRectangle(x1, 4, x2, y2, 0x00FFFFFF);
   foreground.FontSet("Calibri", -100, FW_BLACK);
   foreground.TextOut((x1+x2)/2, 4+CELL_H/2, text, ::ColorToARGB(clrMidnightBlue), TA_CENTER|TA_VCENTER);

//--- Erase whole chart of optimization results
   background.FillRectangle(x1, y1, x2, y2, 0x00FFFFFF);
   foreground.FillRectangle(x1, y1, x2, y2, 0x00FFFFFF);

//--- Update optimization chart
   chart_stat.Update(clrNONE, 0, chart_redraw);
  }
Die Methode bereitet ein sauberes Chart mit einer Kopfzeile vor, auf der die Ausgleichslinien der abgeschlossenen Optimierungsdurchgänge aus den Zeichenmethoden gedruckt werden.
Wir haben alle notwendigen Klassen für die visuelle Optimierung vollständig implementiert. Jetzt kann die Klassendatei von CFrameViewer an jeden Expert Advisor angehängt werden, um den Fortschritt seiner Optimierung in einem separaten Chart im Terminal anzuzeigen.
Funktionalität mit dem Expert Advisor verbinden
Schauen wir, was wir haben.
Nehmen wir den EA aus der Standardauslieferung aus dem Ort: \MQL5\Experts\Advisors\ExpertMAMA.mq5 und speichern ihn in einem neuen, zuvor erstellten Ordner \MQL5\Experts\FrameViewer\ mit dem Namen ExpertMAMA_Frames.mq5.
Alles, was hinzugefügt werden muss, ist die Verbindung der CFrameViewer-Klassendatei am Ende des Listings, die Deklaration eines Objekts mit dem Typ dieser Klasse und das Hinzufügen von Handlern, in denen Handler gleichen Namens der erstellten Klasse aufgerufen werden müssen.
Die Länge der EA-Eingabevariablen kann leicht verkürzt werden, indem die Unterstriche („_“) aus den Variablennamen entfernt werden. Dadurch erhalten sie mehr Platz, um in die Breite der Tabellenzellen zu passen.
//+------------------------------------------------------------------+
//|                                                   ExpertMAMA.mq5 |
//|                             Copyright 2000-2025, MetaQuotes Ltd. |
//|                                             https://www.mql5.com |
//+------------------------------------------------------------------+
#property copyright "Copyright 2000-2025, MetaQuotes Ltd."
#property link      "https://www.mql5.com"
#property version   "1.00"
//+------------------------------------------------------------------+
//| Include                                                          |
//+------------------------------------------------------------------+
#include <Expert\Expert.mqh>
#include <Expert\Signal\SignalMA.mqh>
#include <Expert\Trailing\TrailingMA.mqh>
#include <Expert\Money\MoneyNone.mqh>
//+------------------------------------------------------------------+
//| Inputs                                                           |
//+------------------------------------------------------------------+
//--- inputs for expert
input string             InpExpertTitle      =  "ExpertMAMA";
int                      Expert_MagicNumber  =  12003;
bool                     Expert_EveryTick    =  false;
//--- inputs for signal
input int                InpSignalMAPeriod   =  12;
input int                InpSignalMAShift    =  6;
input ENUM_MA_METHOD     InpSignalMAMethod   =  MODE_SMA;
input ENUM_APPLIED_PRICE InpSignalMAApplied  =  PRICE_CLOSE;
//--- inputs for trailing
input int                InpTrailingMAPeriod =  12;
input int                InpTrailingMAShift  =  0;
input ENUM_MA_METHOD     InpTrailingMAMethod =  MODE_SMA;
input ENUM_APPLIED_PRICE InpTrailingMAApplied=  PRICE_CLOSE;
//+------------------------------------------------------------------+
//| Global expert object                                             |
//+------------------------------------------------------------------+
CExpert ExtExpert;
//+------------------------------------------------------------------+
//| Initialization function of the expert                            |
//+------------------------------------------------------------------+
int OnInit(void)
  {
//--- Initializing expert
   if(!ExtExpert.Init(Symbol(),Period(),Expert_EveryTick,Expert_MagicNumber))
     {
      //--- failed
      printf(__FUNCTION__+": error initializing expert");
      ExtExpert.Deinit();
      return(-1);
     }
//--- Creation of signal object
   CSignalMA *signal=new CSignalMA;
   if(signal==NULL)
     {
      //--- failed
      printf(__FUNCTION__+": error creating signal");
      ExtExpert.Deinit();
      return(-2);
     }
//--- Add signal to expert (will be deleted automatically))
   if(!ExtExpert.InitSignal(signal))
     {
      //--- failed
      printf(__FUNCTION__+": error initializing signal");
      ExtExpert.Deinit();
      return(-3);
     }
//--- Set signal parameters
   signal.PeriodMA(InpSignalMAPeriod);
   signal.Shift(InpSignalMAShift);
   signal.Method(InpSignalMAMethod);
   signal.Applied(InpSignalMAApplied);
//--- Check signal parameters
   if(!signal.ValidationSettings())
     {
      //--- failed
      printf(__FUNCTION__+": error signal parameters");
      ExtExpert.Deinit();
      return(-4);
     }
//--- Creation of trailing object
   CTrailingMA *trailing=new CTrailingMA;
   if(trailing==NULL)
     {
      //--- failed
      printf(__FUNCTION__+": error creating trailing");
      ExtExpert.Deinit();
      return(-5);
     }
//--- Add trailing to expert (will be deleted automatically))
   if(!ExtExpert.InitTrailing(trailing))
     {
      //--- failed
      printf(__FUNCTION__+": error initializing trailing");
      ExtExpert.Deinit();
      return(-6);
     }
//--- Set trailing parameters
   trailing.Period(InpTrailingMAPeriod);
   trailing.Shift(InpTrailingMAShift);
   trailing.Method(InpTrailingMAMethod);
   trailing.Applied(InpTrailingMAApplied);
//--- Check trailing parameters
   if(!trailing.ValidationSettings())
     {
      //--- failed
      printf(__FUNCTION__+": error trailing parameters");
      ExtExpert.Deinit();
      return(-7);
     }
//--- Creation of money object
   CMoneyNone *money=new CMoneyNone;
   if(money==NULL)
     {
      //--- failed
      printf(__FUNCTION__+": error creating money");
      ExtExpert.Deinit();
      return(-8);
     }
//--- Add money to expert (will be deleted automatically))
   if(!ExtExpert.InitMoney(money))
     {
      //--- failed
      printf(__FUNCTION__+": error initializing money");
      ExtExpert.Deinit();
      return(-9);
     }
//--- Set money parameters
//--- Check money parameters
   if(!money.ValidationSettings())
     {
      //--- failed
      printf(__FUNCTION__+": error money parameters");
      ExtExpert.Deinit();
      return(-10);
     }
//--- Tuning of all necessary indicators
   if(!ExtExpert.InitIndicators())
     {
      //--- failed
      printf(__FUNCTION__+": error initializing indicators");
      ExtExpert.Deinit();
      return(-11);
     }
//--- succeed
   return(INIT_SUCCEEDED);
  }
//+------------------------------------------------------------------+
//| Deinitialization function of the expert                          |
//+------------------------------------------------------------------+
void OnDeinit(const int reason)
  {
   ExtExpert.Deinit();
  }
//+------------------------------------------------------------------+
//| Function-event handler "tick"                                    |
//+------------------------------------------------------------------+
void OnTick(void)
  {
   ExtExpert.OnTick();
  }
//+------------------------------------------------------------------+
//| Function-event handler "trade"                                   |
//+------------------------------------------------------------------+
void OnTrade(void)
  {
   ExtExpert.OnTrade();
  }
//+------------------------------------------------------------------+
//| Function-event handler "timer"                                   |
//+------------------------------------------------------------------+
void OnTimer(void)
  {
   ExtExpert.OnTimer();
  }
//+------------------------------------------------------------------+
//| Code required to visualize optimization                          |
//+------------------------------------------------------------------+
//--- When debugging, if press "Stop" during optimization, next run of optimization will continue incomplete passes from stop point
//--- In order for each new optimization run to start anew, define preprocessor directive
#property tester_no_cache

//--- Define macro substitutions
#define   REPLAY_DELAY_MS      100           // Optimization replay delay in milliseconds
#define   STAT_LINES           1             // Number of optimization statistics lines displayed
#define   SELECTED_LINE_WD     3             // Thickness of line of selected optimization passage
#define   SELECTED_LINE_CLR    clrDodgerBlue // Color of line of selected optimization passage

//--- Connect code to work with the optimization results by frame viewer
#include  "FrameViewer.mqh"

//--- Declare frame viewer object
CFrameViewer fw;

//+------------------------------------------------------------------+
//| Tester function                                                  |
//+------------------------------------------------------------------+
double OnTester()
  {
//--- here insert your own function to calculate optimization criterion
   double TesterCritetia=MathAbs(TesterStatistics(STAT_SHARPE_RATIO)*TesterStatistics(STAT_PROFIT));
   TesterCritetia=TesterStatistics(STAT_PROFIT)>0?TesterCritetia:(-TesterCritetia);
//--- call at each end of testing and pass optimization criterion as parameter
   fw.OnTester(TesterCritetia);
//---
   return(TesterCritetia);
  }
//+------------------------------------------------------------------+
//| TesterInit function                                              |
//+------------------------------------------------------------------+
void OnTesterInit()
  {
//--- prepare chart for displaying balance lines
//--- STAT_LINES sets number of balance lines on chart,
//--- SELECTED_LINE_WD - sets width, SELECTED_LINE_CLR - sets color of line of selected passage
   fw.OnTesterInit(STAT_LINES, SELECTED_LINE_WD, SELECTED_LINE_CLR);
  }
//+------------------------------------------------------------------+
//| TesterDeinit function                                            |
//+------------------------------------------------------------------+
void OnTesterDeinit()
  {
//--- completing optimization
   fw.OnTesterDeinit();
  }
//+------------------------------------------------------------------+
//| TesterPass function                                              |
//+------------------------------------------------------------------+
void OnTesterPass()
  {
//--- handle test results and display graphics
   fw.OnTesterPass();
  }
//+------------------------------------------------------------------+
//|  Event handling on chart                                         |
//+------------------------------------------------------------------+
void OnChartEvent(const int id,const long &lparam,const double &dparam,const string &sparam)
  {
//--- starts playback of frames upon completion of optimization when clicking on header
   fw.OnChartEvent(id,lparam,dparam,sparam,REPLAY_DELAY_MS); // REPLAY_DELAY_MS - pause in ms between replay frames
  }
Dies sind alle Änderungen und Ergänzungen, die am Expert Advisor vorgenommen werden müssen (mit Ausnahme der Verkürzung der Variablennamen), damit die visuelle Optimierung funktioniert.
Kompilieren wir den Expert Advisor und optimieren ihn.
Die Optimierungseinstellungen für den Test des Programms selbst sind nicht besonders wichtig, wir stellen sie wie folgt ein:
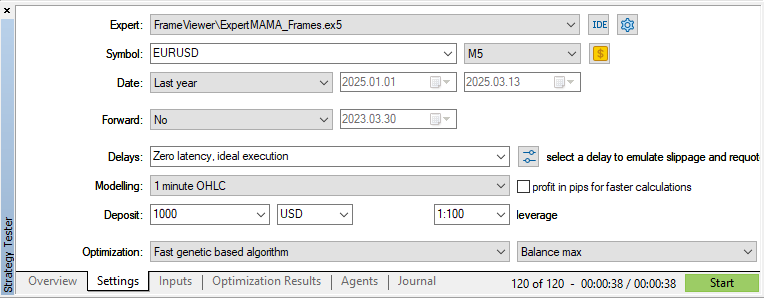
und führen die Optimierung durch:
Bevor der Optimierungsprozess beginnt, wird ein neues Chart-Fenster geöffnet. Alle Bedienelemente befinden sich auf ihr. Das ist praktisch, damit wir nicht zwischen den angehängten Charts der Optimierungsergebnisse und dem Chat der visuellen Optimierung wechseln müssen. Wir können dieses separate Fenster außerhalb des Terminals oder auf einen zweiten Monitor verschieben und haben gleichzeitig Zugriff auf alle Optimierungskarten.
Schlussfolgerung
Abschließend möchte ich sagen, dass wir nur ein kleines Beispiel dafür betrachtet haben, wie zusätzliche Funktionen zur Steuerung des Optimierungsprozesses implementiert werden können. Auf der visuellen Optimierungsgrafik können wir alle Daten ausdrucken, die wir aus den Berichten der Tester erhalten oder die nach jedem Optimierungsdurchgang unabhängig berechnet wurden. Wie die Funktionalität und die visuelle Darstellung aussehen können, ist eine Frage des Geschmacks und der Bedürfnisse jedes Entwicklers, der die visuelle Optimierung nutzt, um die gewünschten Ergebnisse und die Bequemlichkeit bei der Nutzung der gewonnenen Daten zu erreichen. Hier, in dieser Situation, ist es wichtig, dass wir an konkreten Beispielen besprochen haben, wie Sie alles, was Sie brauchen, für sich umsetzen und nutzen können.
Alle im Artikel besprochenen Dateien sind dem Artikel zum Selbststudium beigefügt. Old_article_files.zip enthält Dateien aus dem Artikel, auf deren Grundlage heute alles realisiert wurde.
Das Archiv MQL5.zip ist ebenfalls beigefügt. Nach dem Entpacken können Sie die installierten Testdateien sofort in den erforderlichen Terminalordnern abrufen.
Die Programme dieses Artikels:
| # | Name | Typ | Beschreibung |
|---|---|---|---|
| 1 | Table.mqh | Klassenbibliothek | Klassenbibliothek für die Tabellenerstellung |
| 2 | Controls.mqh | Klassenbibliothek | Eine Klassenbibliothek zur Erstellung von UI-Steuerelementen |
| 3 | FrameViewer.mqh | Klassenbibliothek | Eine Klassenbibliothek zur Implementierung visueller Optimierungsfunktionen im Expert Advisor |
| 4 | ExpertMAMA_Frames.mq5 | Expert Advisor | Expert Advisor zum Testen der visuellen Optimierung |
| 5 | MQL5.zip | Archive | Ein Archiv mit den oben genannten Dateien zum Entpacken in das MQL5-Verzeichnis des Client-Terminals |
| 6 | Old_article_files.zip | Archive | Archiv der Dateien des ursprünglichen Artikels, auf dessen Grundlage alle Dateien dieses Artikels erstellt wurden |
Übersetzt aus dem Russischen von MetaQuotes Ltd.
Originalartikel: https://www.mql5.com/ru/articles/17457
Warnung: Alle Rechte sind von MetaQuotes Ltd. vorbehalten. Kopieren oder Vervielfältigen untersagt.
Dieser Artikel wurde von einem Nutzer der Website verfasst und gibt dessen persönliche Meinung wieder. MetaQuotes Ltd übernimmt keine Verantwortung für die Richtigkeit der dargestellten Informationen oder für Folgen, die sich aus der Anwendung der beschriebenen Lösungen, Strategien oder Empfehlungen ergeben.

- Freie Handelsapplikationen
- Über 8.000 Signale zum Kopieren
- Wirtschaftsnachrichten für die Lage an den Finanzmärkte
Sie stimmen der Website-Richtlinie und den Nutzungsbedingungen zu.
Nach der Offenlegung des Opt-Formats blieb die Verwendung von Frames nur bei der Übertragung von Daten, die nicht in der Opt-Datei enthalten sind, sinnvoll.
Im Beispiel dieses Artikels könnte die vorgeschlagene grafische Benutzeroberfläche verwendet werden, um eine opt-Datei zu visualisieren.
Nach der Offenlegung des Opt-Formats war die Verwendung von Rahmen nur noch bei der Übertragung von Daten sinnvoll, die nicht in der Opt-Datei enthalten sind.
Im Beispiel dieses Artikels könnte die vorgeschlagene grafische Benutzeroberfläche verwendet werden, um eine opt-Datei zu visualisieren.