
MQL5 中的策略可视化:在标准图表中展示优化结果

目录
概述
mql5.com 包含大量信息,每次您浏览文章目录、参考资料或教科书时,您一定会发现一些新的、有趣的东西。
这次就是这样。我偶然发现了一篇简单的文章,乍一看似乎并不复杂,它简要地描述了策略测试器。一切似乎都很简单,而且早已为人所知,但是……但是文章的最后一部分引起了我的兴趣。它建议只需将一小段代码连接到 EA 交易,并向其中添加几个标准处理程序,然后…… MetaTrader 5 平台策略测试器的常用优化器就会变成可视化的优化器。嗯……那很有意思。
我就开始学习并整理资料。结果,我萌生了一个想法,即稍微改进外观并扩展查看优化结果的功能。
我们来看一下:EA 交易将打开一个包含五个标签页的新窗口。第一个标签页将显示所有通过,其中每个新的通过都会显示一条余额线。其他四个标签页也将包含图表,但将在优化完成后才能使用。每个标签页将显示四个优化标准之一的三次最优通过的数据。每个标签页上都会有两个表格:一个是优化通过的结果,另一个是本次优化过程中 EA 交易的设置:
- 优化选项卡:
- 下一次通过的优化结果表格,
- EA 本次通过的输入参数表
- 当前已完成的优化通过的余额图
- 重放按钮,用于重放已执行的优化操作。
- 夏普比率选项卡:
- 所选优化通过(夏普系数排名前三者之一)的优化结果表格
- 所选优化通过(夏普系数排名前三者之一)的 EA 交易输入参数表
- 根据夏普系数绘制的三个最佳优化通过的余额图。
- 根据夏普系数所选三个最佳优化结果之一的切换开关(三个位置)。
- 净利润标签页:
- 所选优化通过(按总利润排名前三)的优化结果表格
- 所选优化通过(按总利润排名前三)的 EA 交易输入参数表
- 根据总利润选择的三个最佳优化通过的余额图。
- 根据总利润选择的三个最佳优化通过之一的切换开关(三个位置)。
- 利润因子选项卡:
- 所选通过(按盈利能力排名前三的通过之一)的优化结果表格
- 所选通过(按盈利能力排名前三的通过之一)的 EA 交易输入参数表
- 根据盈利能力所选的三个最佳优化通过的余额图
- 根据盈利能力所选的三个最佳优化通过之一的切换开关(三个位置)。
- 恢复因子标签页:
- 所选通过(按恢复因子排名前三)的优化结果表格
- 所选通过(按恢复因子排名前三)的 EA 交易输入参数表
- 按恢复因子排名前三的通过的余额图
- 用于选择恢复因子排名前三通过结果之一的切换开关(三个位置)。
要实现一组选项卡,要创建控件类,这些控件类构成选项卡控件。本文省略了创建控件的过程,直接提供了一个现成的类文件。在接下来的文章中,我们将回到对这些类的描述,以创建一些在未来可能有用的控件。
为了显示有关通过参数的信息,我们希望从“ MQL5 中的 SQLite 功能:按交易品种和幻数显示交易统计数据的仪表盘示例 ”文章中取用制作好的表格类,并稍作改进,以便更方便地创建表格并将文本输出到其单元格中。
为了实现这个想法,可以参考上面提到的文章中提供的与优化框架相关的代码,并在此基础上创建我们自己的类,尽量保留其概念。由于文章没有描述使用框架以及在帧模式下运行的 EA 交易的过程,让我们在这里尝试理解这个系统。
工作原理
让我们来看看 MQL5教程,看看它是如何描述策略测试器及其优化器的工作原理的:
...测试器的一个特别重要的功能是多线程优化,可以使用本地和分布式(联网)代理程序来执行,包括在 MQL5 云网络中。在单独的代理程序中,执行由用户手动启动的单次测试运行(具有特定的 EA 输入参数),或者由优化引起的多次运行之一(当参数值在设定的范围内迭代时)。从技术上讲,它是 metaster64.exe 文件,在测试和优化期间,其进程的副本可以在 Windows 任务管理器中获得。这就是为什么测试器是多线程的。
终端是执行管理器,它将任务分配给本地和远程代理。如有必要,它会自行启动本地代理。在优化过程中,默认情况下会启动几个代理 —— 它们的数量对应于处理器内核的数量。完成使用指定参数测试 EA 交易的下一个任务后,代理会将结果返回到终端。
每个代理都创建了自己的交易和软件环境。所有代理彼此隔离,并与客户端隔离。
从描述中可以清楚地看出:每个被测试的 EA 实例都在其自己的测试代理上启动,并且每次运行(其最终数据)都会从代理发送到终端。
终端和代理之间有一组用于数据交换的处理函数:
- OnTesterInit() — 当 TesterInit 事件发生时,EA 交易中会调用此函数,以便在策略测试器中开始优化之前执行必要的操作。
- OnTester() — 当 Tester 事件发生时,EA 交易会调用它来执行测试完成后的必要操作。
- OnTesterPass() — 在 EA 交易优化期间,当 TesterPass 处理新的数据帧时,会在 EA 交易中调用它。
- OnTesterDeinit() — 当 TesterDeinit 事件发生时,EA 会调用此函数以在 EA 优化完成后执行必要的操作。
如果 EA 具有 OnTesterInit()、OnTesterDeinit()(这两个处理函数总是成对使用,不能只使用其中一个)、OnTesterPass() 中的任何处理程序,则该 EA 将在单独的终端窗口中以特殊帧模式启动:
为了管理优化过程并将任意应用程序结果从代理传输到终端(除了交易指标之外),MQL5 中有 3 个特殊事件:OnTesterInit、OnTesterDeinit、OnTesterPass。通过在代码中描述处理函数,程序员可以在开始优化之前、优化完成后以及每次单独优化过程完成后执行所需的操作。
所有处理函数都是可选的。即使没有它们,优化也能正常运行。还应该了解的是,这 3 个事件仅在优化期间起作用,而不在单个测试中起作用。
带有这些处理函数的 EA 交易会自动加载到单独的终端图表上,图表上的交易品种和周期与测试器中指定的相同。此版本的 EA 交易不进行交易,只执行服务操作。所有其他事件处理程序都不会在其中运行,特别是 OnInit、OnDeinit、OnTick。
在优化过程中,终端中只有一个 EA 交易实例在运行,并且如有必要,会接受传入的帧。但需要再次明确指出,只有当其代码中存在所描述的三个事件处理程序之一时,才会启动此 EA 交易实例。
每次优化器运行完毕后,在代理上运行的 EA 实例中都会生成 OnTester() 事件。从该事件的处理程序中,您可以将有关传递的数据发送到在特殊帧模式下在单独图表上运行的 EA 交易。发送给图表上 EA 交易的关于已完成操作的数据包称为帧。它包含有关通过编号、EA 输入变量的值(用于启动通过)以及此通过结果的信息。
所有这些数据都会发送到 EA 交易,并在其中生成一个 TesterPass 事件,该事件会在 OnTesterPass() 处理函数中进行处理,我们可以在其中读取通过数据并执行任何操作(例如,在本例中,绘制此通过的余额图并执行其他服务操作)。
要将代理的通过数据发送到终端图表上的 EA 交易,应该使用 FrameAdd() 函数。当前帧(已完成的测试)将从代理发送到 EA 交易,并在 OnTesterPass() 处理函数中进行处理。
如您所见,有些函数在 EA 实例中运行的代理上起作用,而有些函数在以帧模式运行的终端图表上的 EA 交易中起作用。当然,所有这些都必须在 EA 代码中进行描述。
因此,EA 的操作顺序以及我们在代理和终端之间传输数据时的操作如下:
- 在 OnTesterInit 处理函数(终端图表上的 EA 交易)中,需要准备所有图形结构 —— 一个单独的图表,EA 交易以帧模式运行,以及该图表的内容:余额图表、参数和结果表格、选项卡控件对象和用于选择选项卡上操作的按钮;
- 在 OnTester 处理函数(代理上的一个 EA 交易实例)中,需要收集有关已完成的交易的所有信息 —— 将每次平仓交易的余额结果写入数组,接收并将此交易的接收结果写入数组,并使用 FrameAdd() 将所有这些数据发送到 EA;
- 在 OnTesterPass 处理函数(终端图表上的 EA 交易实例)中,我们使用 FrameAdd() 接收代理发送的下一帧,读取其数据并在图表上绘制余额图,创建一个帧对象并将其保存到数组中,以便根据优化标准进行后续排序和选择;
- OnTesterDeinit 和 OnChartEvent 处理函数(终端图表上的 EA 交易实例)在优化完成后处理优化数据 —— 重复生成优化过程,以显示某些优化标准的最佳结果。
为我们的任务创建类
为了创建选项卡控件,创建了一个名为 Controls.mqh 的文件,其中包含一组控件。该文件附在文章末尾,应直接放在我们将要编写测试 EA 的文件夹中,例如,放在终端目录 \MQL5\Experts\FrameViewer\Controls.mqh 中。
这里我们不探讨为每个控件创建的每个类,只是简要概述。
总共实施了十个类,对应八个独立的控件:
| # | 类 | 父类 | 描述 | 功能 |
|---|---|---|---|---|
| 1 | CBaseCanvas | CObject | 绘图基类 | 基础画布。它包含用于设置和更改大小和位置、隐藏和显示的方法。 |
| 2 | CPanel | CBaseCanvas | 面板类 | 它包含用于设置和更改颜色以及鼠标事件处理函数的方法,它可以附加子控件。 |
| 3 | CLabel | CPanel | 文本标签类 | 它会在画布上按照设定的坐标打印一段文本。 |
| 4 | CButton | CLabel | 简单按钮类 | 状态不固定的常规按钮。它通过改变颜色来对悬停和鼠标点击做出反应。 |
| 5 | CButtonTriggered | CButton | 双态按钮类 | 具有两种状态的按钮:开/关 它会对鼠标悬停、点击和状态变化做出反应,并通过改变颜色来响应。 |
| 6 | CTabButton | CButtonTriggered | 选项卡按钮类 | 与选项卡字段交界处缺少边框的双向按钮。 |
| 7 | CButtonSwitch | CPanel | 切换按钮类 | 带有两个或多个双态按钮的面板,其中只有一个按钮可以处于开启状态。它可以让你在现有按钮的基础上添加新按钮。 |
| 8 | CTabWorkArea | CObject | 选项卡的工作区类 | 具有两个基本绘图类的对象 —— 用于背景和前景。 |
| 9 | CTab | CPanel | 选项卡对象类 | 带有按钮和输入框的面板。工作区位于绘图所在的选项卡区域。 |
| 10 | CTabControl | CPanel | 选项卡控件对象类 | 允许您添加和管理选项卡对象的面板。 |
控件对象成功创建后,必须对每个对象调用其 Create() 方法,并指定其坐标和尺寸。之后,该元件即可使用。
控件元素(包括已实现的事件处理函数)会将用户事件发送到控制程序图表,该图表可用于确定对象中已执行的操作:
| # | 类 | 事件 | ID | lparam | dparam | sparam |
|---|---|---|---|---|---|---|
| 1 | CButton | 点击该对象 | ( ushort ) CHARTEVENT_CLICK | 光标的 X 坐标 | 光标的 Y 坐标 | 按钮对象名称 |
| 2 | CButtonTriggered | 点击该对象 | ( ushort ) CHARTEVENT_CLICK | 光标的 X 坐标 | 光标的 Y 坐标 | 按钮对象名称 |
| 3 | CTabButton | 点击该对象 | ( ushort ) CHARTEVENT_CLICK | 光标的 X 坐标 | 光标的 Y 坐标 | 按钮对象名称 |
| 4 | CButtonSwitch | 点击对象按钮 | ( ushort ) CHARTEVENT_CLICK | 按钮 ID | 0 | 切换对象名称 |
该表显示,为了简化代码,选项卡控件没有引用用户事件程序的图表。如果程序需要对标签切换做出反应,那么您可以通过单击标签按钮来确定事件。通过按钮名称,您可以找到选项卡编号,或者从 TabControl 对象请求所选选项卡的索引等。
在任何情况下,将来在创建对我们的程序有用的各种控件时,我们都会详细分析这些类。
现在我们必须稍微改进文章中介绍的表格类,该表格类需要下载(Dashboard.mqh 文件),仅从文件中复制表格类代码(第 12 至 285 行),并将复制的代码保存到 \MQL5\Experts\FrameViewer\ 文件夹中的 Table.mqh 文件中。
添加该类可以便更方便地处理表格和表格数据。
连接到包含指向 CObject 类及其子类 CArrayObj 实例的指针的动态数组的类文件,以及用于简化创建自定义绘图的 CCanvas 类的文件:
//+------------------------------------------------------------------+
//|                                                        Table.mqh |
//|                                  Copyright 2025, MetaQuotes Ltd. |
//|                                             https://www.mql5.com |
//+------------------------------------------------------------------+
#property copyright "Copyright 2025, MetaQuotes Ltd."
#property link      "https://www.mql5.com"

#include <Arrays\ArrayObj.mqh>
#include <Canvas\Canvas.mqh>
在表格单元格类的私有部分添加新变量,用于存储单元格中文本的宽度、高度和颜色:
//+------------------------------------------------------------------+
//| Table cell class                                                 |
//+------------------------------------------------------------------+
class CTableCell : public CObject
  {
private:
   int               m_row;                     // Row
   int               m_col;                     // Column
   int               m_x;                       // X coordinate
   int               m_y;                       // Y coordinate
   int               m_w;                       // Width
   int               m_h;                       // Height
   string            m_text;                    // Text in the cell
   color             m_fore_color;              // Text color in the cell
public:
在公有部分,添加用于读取和设置新属性的方法,以及一个将单元格中写入的文本打印到指定画布对象的方法:
public:
//--- Methods for setting values
   void              SetRow(const uint row)     { this.m_row=(int)row;  }
   void              SetColumn(const uint col)  { this.m_col=(int)col;  }
   void              SetX(const uint x)         { this.m_x=(int)x;      }
   void              SetY(const uint y)         { this.m_y=(int)y;      }
   void              SetXY(const uint x,const uint y)
                       {
                        this.m_x=(int)x;
                        this.m_y=(int)y;
                       }
   void              SetWidth(const uint w)     { this.m_w=(int)w;      }
   void              SetHeight(const uint h)    { this.m_h=(int)h;      }
   void              SetSize(const uint w,const uint h)
                       {
                        this.m_w=(int)w;
                        this.m_h=(int)h;
                       }
   void              SetText(const string text) { this.m_text=text;     }

//--- Methods for getting values
   int               Row(void)            const { return this.m_row;    }
   int               Column(void)         const { return this.m_col;    }
   int               X(void)              const { return this.m_x;      }
   int               Y(void)              const { return this.m_y;      }
   int               Width(void)          const { return this.m_w;      }
   int               Height(void)         const { return this.m_h;      }
   string            Text(void)           const { return this.m_text;   }

//--- Prints the text written in cell properties to the canvas, the pointer to which is passed to the method
   void              TextOut(CCanvas *canvas, const int x_shift, const int y_shift, const color bg_color=clrNONE, const uint flags=0, const uint alignment=0)
                       {
                        if(canvas==NULL)
                           return;
                        //--- Remember current font flags
                        uint flags_prev=canvas.FontFlagsGet();
                        //--- Set background color
                        uint clr=(bg_color==clrNONE ? 0x00FFFFFF : ::ColorToARGB(bg_color));
                        //--- Fill in the cell with the set background color (erase the previous label)
                        canvas.FillRectangle(this.m_x+1, this.m_y+1, this.m_x+this.m_w-1, this.m_y+this.m_h-1, clr);
                        //--- Set font flags
                        canvas.FontFlagsSet(flags);
                        //--- Print text in the cell
                        canvas.TextOut(this.m_x+x_shift, this.m_y+y_shift, this.m_text, ::ColorToARGB(this.m_fore_color), alignment);
                        //--- Return previously memorized font flags and update canvas
                        canvas.FontFlagsSet(flags_prev);
                        canvas.Update(false);
                       }

//--- A virtual method for comparing two objects
在类列表的末尾,实现一个新的表格控件类:
//+------------------------------------------------------------------+
//| Table control class                                              |
//+------------------------------------------------------------------+
class CTableDataControl : public CTableData
  {
protected:
   uchar             m_alpha;
   color             m_fore_color;

//--- Converts RGB to color
   color             RGBToColor(const double r,const double g,const double b) const;
//--- Writes RGB component values to variables
   void              ColorToRGB(const color clr,double &r,double &g,double &b);
//--- Returns color component (1) Red, (2) Green, (3) Blue
   double            GetR(const color clr)      { return clr&0xff ;                    }
   double            GetG(const color clr)      { return(clr>>8)&0xff;                 }
   double            GetB(const color clr)      { return(clr>>16)&0xff;                }

//--- Returns a new color
   color             NewColor(color base_color, int shift_red, int shift_green, int shift_blue);

public:
//--- Returns a pointer to itself
   CTableDataControl*Get(void)                                 { return &this;         }

//--- (1) Sets, (2) returns transparency
   void              SetAlpha(const uchar alpha)               { this.m_alpha=alpha;   }
   uchar             Alpha(void)                         const { return this.m_alpha;  }

//--- Draws (1) a background grid, (2) with automatic cell size
   void              DrawGrid(CCanvas *canvas,const int x,const int y,const uint header_h,const uint rows,const uint columns,const uint row_size,const uint col_size,
                              const color line_color=clrNONE,bool alternating_color=true);
   void              DrawGridAutoFill(CCanvas *canvas,const uint border,const uint header_h,const uint rows,const uint columns,const color line_color=clrNONE,bool alternating_color=true);

//--- Prints (1) a text message, (2) a filled rectangle at the specified coordinates
   void              DrawText(CCanvas *canvas,const string text,const int x,const int y,const color clr=clrNONE,const uint align=0,const int width=WRONG_VALUE,const int height=WRONG_VALUE);
   void              DrawRectangleFill(CCanvas *canvas,const int x,const int y,const int width,const int height,const color clr,const uchar alpha);


//--- Constructors/Destructor
                     CTableDataControl (const uint id) : CTableData(id), m_fore_color(clrDimGray), m_alpha(255) {}
                     CTableDataControl (void) : m_alpha(255) {}
                    ~CTableDataControl (void) {}
  };
//+------------------------------------------------------------------+
//| Draws background grid                                            |
//+------------------------------------------------------------------+
void CTableDataControl::DrawGrid(CCanvas *canvas,const int x,const int y,const uint header_h,const uint rows,const uint columns,const uint row_size,const uint col_size,
                                 const color line_color=clrNONE,bool alternating_color=true)
  {
//--- Clear all lists of the tabular data object (delete cells from rows and all rows)
   this.Clear();
//--- Row height cannot be less than 2
   int row_h=int(row_size<2 ? 2 : row_size);
//--- Row width cannot be less than 2
   int col_w=int(col_size<2 ? 2 : col_size);

//--- Left coordinate (X1) of the table
   int x1=x;
//--- Calculate X2 coordinate (on the right) depending on the number of columns and their width
   int x2=x1+col_w*int(columns>0 ? columns : 1);
//--- Y1 coordinate is located under the panel header area
   int y1=(int)header_h+y;

//--- Calculate Y2 coordinate (from below) depending on the number of rows and their height
   int y2=y1+row_h*int(rows>0 ? rows : 1);
//--- Set coordinates of the table
   this.SetCoords(x1,y1-header_h,x2,y2-header_h);

//--- Get color of grid lines of table, either by default or passed to method
   color clr=(line_color==clrNONE ? C'200,200,200' : line_color);
//--- Draw table border
   canvas.Rectangle(x1,y1,x2,y2,::ColorToARGB(clr,this.m_alpha));
//--- In a loop by table rows
   for(int i=0;i<(int)rows;i++)
     {
      //--- calculate Y coordinate of next horizontal grid line (Y coordinate of next row of table)
      int row_y=y1+row_h*i;
      //--- if the flag of "alternating" row colors is passed and the row is even
      if(alternating_color && i%2==0)
        {
         //--- lighten background color of table and draw a background rectangle
         color new_color=this.NewColor(clr,45,45,45);
         canvas.FillRectangle(x1+1,row_y+1,x2-1,row_y+row_h-1,::ColorToARGB(new_color,this.m_alpha));
        }
      //--- Draw horizontal grid line of table
      canvas.Line(x1,row_y,x2,row_y,::ColorToARGB(clr,this.m_alpha));

      //--- Create new table row object
      CTableRow *row_obj=new CTableRow(i);
      if(row_obj==NULL)
        {
         ::PrintFormat("%s: Failed to create table row object at index %lu",(string)__FUNCTION__,i);
         continue;
        }
      //--- Add it to list of rows of tabular data object
      //--- (if failed to add object, delete created object)
      if(!this.AddRow(row_obj))
         delete row_obj;
      //--- Set Y coordinate in created row object, given offset from panel header
      row_obj.SetY(row_y-header_h);
     }

//--- In loop by table columns
   for(int i=0;i<(int)columns;i++)
     {
      //--- calculate X coordinate of next vertical grid line (X coordinate of next table column)
      int col_x=x1+col_w*i;
      //--- If grid line has gone beyond panel, break cycle
      if(x1==1 && col_x>=x1+canvas.Width()-2)
         break;
      //--- Draw vertical grid line of table
      canvas.Line(col_x,y1,col_x,y2,::ColorToARGB(clr,this.m_alpha));

      //--- Get the number of created rows from tabular data object
      int total=this.RowsTotal();
      //--- In loop through table rows
      for(int j=0;j<total;j++)
        {
         //--- get next row
         CTableRow *row=this.GetRow(j);
         if(row==NULL)
            continue;
         //--- Create new table cell
         CTableCell *cell=new CTableCell(row.Row(),i);
         if(cell==NULL)
           {
            ::PrintFormat("%s: Failed to create table cell object at index %lu",(string)__FUNCTION__,i);
            continue;
           }
         //--- Add created cell to row
         //--- (if failed to add object, delete created object)
         if(!row.AddCell(cell))
           {
            delete cell;
            continue;
           }
         //--- In created cell object, set its X coordinate and Y coordinate from row object.
         cell.SetXY(col_x,row.Y());
         cell.SetSize(col_w, row_h);
        }
     }
//--- Update canvas without redrawing chart
   canvas.Update(false);
  }
//+------------------------------------------------------------------+
//| Draws background grid with automatic cell size                   |
//+------------------------------------------------------------------+
void CTableDataControl::DrawGridAutoFill(CCanvas *canvas,const uint border,const uint header_h,const uint rows,const uint columns,const color line_color=clrNONE,bool alternating_color=true)
  {
//--- X1 coordinate (left) of table
   int x1=(int)border;
//--- X2 coordinate (right) of table
   int x2=canvas.Width()-(int)border-1;
//--- Y1 coordinate (top) of table
   int y1=int(header_h+border-1);
//--- Y2 coordinate (lower) of table
   int y2=canvas.Height()-(int)border-1;
//--- Set coordinates of table
   this.SetCoords(x1,y1,x2,y2);

//--- Get color of grid lines of table, either by default or passed to method
   color clr=(line_color==clrNONE ? C'200,200,200' : line_color);
//--- If indentation from edge of panel is greater than zero, draw border of table
//--- otherwise, panel border acts as table border
   if(border>0)
      canvas.Rectangle(x1,y1,x2,y2,::ColorToARGB(clr,this.m_alpha));

//--- Height of entire table grid
   int greed_h=y2-y1;
//--- Calculate row height depending on table height and number of rows
   int row_h=(int)::round((double)greed_h/(double)rows);
//--- In loop through number of rows
   for(int i=0;i<(int)rows;i++)
     {
      //--- calculate Y coordinate of next horizontal grid line (Y coordinate of next row of table)
      int row_y=y1+row_h*i;
      //--- if the flag of "alternating" row colors is passed and the row is even
      if(alternating_color && i%2==0)
        {
         //--- lighten background color of table and draw a background rectangle
         color new_color=this.NewColor(clr,45,45,45);
         canvas.FillRectangle(x1+1,row_y+1,x2-1,row_y+row_h-1,::ColorToARGB(new_color,this.m_alpha));
        }
      //--- Draw horizontal grid line of table
      canvas.Line(x1,row_y,x2,row_y,::ColorToARGB(clr,this.m_alpha));

      //--- Create new table row object
      CTableRow *row_obj=new CTableRow(i);
      if(row_obj==NULL)
        {
         ::PrintFormat("%s: Failed to create table row object at index %lu",(string)__FUNCTION__,i);
         continue;
        }
      //--- Add it to list of rows of tabular data object
      //--- (if failed to add object, delete created object)
      if(!this.AddRow(row_obj))
         delete row_obj;
      //--- Set Y coordinate in created row object, given offset from panel header
      row_obj.SetY(row_y-header_h);
     }

//--- Width of table grid
   int greed_w=x2-x1;
//--- Calculate column width depending on table width and number of columns
   int col_w=(int)::round((double)greed_w/(double)columns);
//--- In loop by table columns
   for(int i=0;i<(int)columns;i++)
     {
      //--- calculate X coordinate of next vertical grid line (X coordinate of next table column)
      int col_x=x1+col_w*i;
      //--- If this is not the very first vertical line, draw it
      //--- (the first vertical line is either table border or panel border)
      if(i>0)
         canvas.Line(col_x,y1,col_x,y2,::ColorToARGB(clr,this.m_alpha));

      //--- Get the number of created rows from tabular data object
      int total=this.RowsTotal();
      //--- In loop through table rows
      for(int j=0;j<total;j++)
        {
         //--- get next row
         CTableRow *row=this.GetRow(j);
         if(row==NULL)
            continue;
         //--- Create new table cell
         CTableCell *cell=new CTableCell(row.Row(),i);
         if(cell==NULL)
           {
            ::PrintFormat("%s: Failed to create table cell object at index %lu",(string)__FUNCTION__,i);
            continue;
           }
         //--- Add created cell to row
         //--- (if failed to add object, delete created object)
         if(!row.AddCell(cell))
           {
            delete cell;
            continue;
           }
         //--- In created cell object, set its X coordinate and Y coordinate from row object.
         cell.SetXY(col_x,row.Y());
         cell.SetSize(col_w, row_h);
        }
     }
//--- Update canvas without redrawing chart
   canvas.Update(false);
  }
//+------------------------------------------------------------------+
//| Returns color with new color component                           |
//+------------------------------------------------------------------+
color CTableDataControl::NewColor(color base_color, int shift_red, int shift_green, int shift_blue)
  {
   double clR=0, clG=0, clB=0;
   this.ColorToRGB(base_color,clR,clG,clB);
   double clRn=(clR+shift_red  < 0 ? 0 : clR+shift_red  > 255 ? 255 : clR+shift_red);
   double clGn=(clG+shift_green< 0 ? 0 : clG+shift_green> 255 ? 255 : clG+shift_green);
   double clBn=(clB+shift_blue < 0 ? 0 : clB+shift_blue > 255 ? 255 : clB+shift_blue);
   return this.RGBToColor(clRn,clGn,clBn);
  }
//+------------------------------------------------------------------+
//| Converts RGB to color                                            |
//+------------------------------------------------------------------+
color CTableDataControl::RGBToColor(const double r,const double g,const double b) const
  {
   int int_r=(int)::round(r);
   int int_g=(int)::round(g);
   int int_b=(int)::round(b);
   int clr=0;
   clr=int_b;
   clr<<=8;
   clr|=int_g;
   clr<<=8;
   clr|=int_r;
//---
   return (color)clr;
  }
//+------------------------------------------------------------------+
//| Retrieving RGB component values                                  |
//+------------------------------------------------------------------+
void CTableDataControl::ColorToRGB(const color clr,double &r,double &g,double &b)
  {
   r=GetR(clr);
   g=GetG(clr);
   b=GetB(clr);
  }
//+------------------------------------------------------------------+
//| Prints text message to specified coordinates                     |
//+------------------------------------------------------------------+
void CTableDataControl::DrawText(CCanvas *canvas,const string text,const int x,const int y,const color clr=clrNONE,const uint align=0,const int width=WRONG_VALUE,const int height=WRONG_VALUE)
  {
//--- Declare variables to record width and height of text in them
   int w=width;
   int h=height;
//--- If width and height of text passed to method have zero values,
//--- entire canvas space is completely erased with transparent color
   if(width==0 && height==0)
      canvas.Erase(0x00FFFFFF);
//--- Otherwise
   else
     {
      //--- If passed width and height have default values (-1), get its width and height from text
      if(width==WRONG_VALUE && height==WRONG_VALUE)
         canvas.TextSize(text,w,h);
      //--- otherwise,
      else
        {
         //--- if width passed to method has default value (-1), get width from text, or
         //--- if width passed to method has value greater than zero, use width passed to method, or
         //--- if width passed to method has zero value, use value 1 for width
         w=(width ==WRONG_VALUE ? canvas.TextWidth(text)  : width>0  ? width  : 1);
         //--- if height passed to method has default value (-1), get height from text, or
         //--- if height passed to method has value greater than zero, use height passed to method, or
         //--- if height passed to method has zero value, use value 1 for height
         h=(height==WRONG_VALUE ? canvas.TextHeight(text) : height>0 ? height : 1);
        }
      //--- Fill space according to specified coordinates and by resulting width and height with transparent color (erase previous entry)
      canvas.FillRectangle(x,y,x+w,y+h,0x00FFFFFF);
     }
//--- Print text in place cleared of previous text and update workspace without redrawing screen
   canvas.TextOut(x,y,text,::ColorToARGB(clr==clrNONE ? this.m_fore_color : clr),align);
   canvas.Update(false);
  }
//+------------------------------------------------------------------+
//| Prints filled rectangle to specified coordinates                 |
//+------------------------------------------------------------------+
void CTableDataControl::DrawRectangleFill(CCanvas *canvas,const int x,const int y,const int width,const int height,const color clr,const uchar alpha)
  {
   canvas.FillRectangle(x,y,x+width,y+height,::ColorToARGB(clr,alpha));
   canvas.Update();
  }
//+------------------------------------------------------------------+
此类包含“制作仪表板以显示指标和 EA 数据”文章的信息面板描述部分中描述的方法原理。在上述文章中,方法属于面板对象。在这里它们被放置在一个单独的类中,该类继承自表格类。
这里的所有表格数据对象都将具有 CTableDataControl 类的类型,即表格控件对象,从而可以快速控制表格。
让我们看看在那篇很久以前的文章中,我们被要求下载什么并连接到 EA 交易:
而本次演出的最后一个“亮点”就是使用优化结果!以前,交易者必须准备数据来处理结果,将其上传到某个地方,然后在其他地方进行处理,但现在这可以在“无需离开收银台”的情况下完成 —— 在优化过程中即可完成。为了演示此功能,我们需要几个包含文件,其中实现了此类处理的最简单示例。
将附加到文章的 MQH 扩展名文件上传到 MQL5\Include 文件夹。任选一个 EA,并在末尾插入以下代码块:
//--- connect code to work with optimization results
#include <FrameGenerator.mqh>
//--- frame generator
CFrameGenerator fg;
//+------------------------------------------------------------------+
//| Tester function                                                  |
//+------------------------------------------------------------------+
double OnTester()
  {
//--- here insert your own function to calculate optimization criterion
   double TesterCritetia=MathAbs(TesterStatistics(STAT_SHARPE_RATIO)*TesterStatistics(STAT_PROFIT));
   TesterCritetia=TesterStatistics(STAT_PROFIT)>0?TesterCritetia:(-TesterCritetia);
//--- call at each end of testing and pass optimization criterion as parameter
   fg.OnTester(TesterCritetia);
//---
   return(TesterCritetia);
  }
//+------------------------------------------------------------------+
//| TesterInit function                                              |
//+------------------------------------------------------------------+
void OnTesterInit()
  {
//--- prepare chart for displaying balance charts
   fg.OnTesterInit(3); //parameter sets number of balance lines on chart
  }
//+------------------------------------------------------------------+
//| TesterPass function                                              |
//+------------------------------------------------------------------+
void OnTesterPass()
  {
//--- handle test results and display graphics
   fg.OnTesterPass();
  }
//+------------------------------------------------------------------+
//| TesterDeinit function                                            |
//+------------------------------------------------------------------+
void OnTesterDeinit()
  {
//--- completing optimization
   fg.OnTesterDeinit();
  }
//+------------------------------------------------------------------+
//|  Event handling on chart                                         |
//+------------------------------------------------------------------+
void OnChartEvent(const int id,const long &lparam,const double &dparam,const string &sparam)
  {
   //--- starts playback of frames upon completion of optimization when clicking on header
   fg.OnChartEvent(id,lparam,dparam,sparam,100); // 100 - this is pause in ms between frames
  }
//+------------------------------------------------------------------+
例如,我们选取了一个标准提供的 EA Moving Averages.mq5文件。插入代码并保存为以下名称的 EA 交易 Moving Averages With Frames.mq5。编译并运行优化。
请翻到文章末尾查看附件,那里有四个扩展名为 *.mqh 的文件。上传并整理一下:
- specialchart.mqh (7.61 KB) — 特殊图表类,上面绘制了每个测试器通过的余额线以及重现已完成的优化过程时的余额线;
- colorprogressbar.mqh (4.86 KB) — 进度条类,用于显示优化过程,在优化过程中填充彩色列。绿色代表盈利系列,红色代表亏损系列,位于特殊图表的底部;
- simpletable.mqh (10.74 KB) — 简单的表格类,显示每次优化过程的数据 — 获得的结果以及 EA 配置参数的值,EA 在此过程中就是用这些参数启动的。特殊图表的左侧有两个表格;
- framegenerator.mqh (14.88 KB) — 用于在测试代理和终端之间交换数据并在特殊图表上显示信息的类。它是实现可视化优化的主要类。
根据所掌握的知识,我们决定制作以下内容:(1)进度条类,(2)特殊图表类,以及(3)帧查看器类。我们已经有一个表格类(4),它被上传到未来 EA 交易的文件夹中并稍作修改。
还需要实现另一个小类,即帧类(5)。它的目的是什么?我们将选择并展示四个优化标准(夏普比率、总利润、盈利能力和回收率)中前三次最佳通过结果的图表。如果我们有一个基于指向 CObject 类及其标准库派生类实例的指针的动态数组的类而创建的对象列表,那么这样做会很方便。按所需标准对列表进行排序就足够了,列表中的所有对象都将按所选标准的属性值进行排序。具有最大参数值的对象将位于列表末尾。仍然需要找到两个属性值小于前一个找到的对象的属性值的对象。上述类中已经实现了这种搜索的所有方法。
进度条类、特殊图表类和帧查看器类都是根据文章中下载的代码创建的 —— 我们只是看看那里是如何实现的,并以此为基础来实现我们自己的类,进行修正、删除不必要的内容,并添加必要的内容。查看生成的代码,如果需要,可以将其与旧文章中的代码进行比较 —— 旧文件的存档将附在本文末尾。
我们将把所有类都写在一个文件中。在 \MQL5\Experts\FrameViewer\FrameViewer.mqh 中创建它(如果我们已经创建过的话),然后开始填写它。
将所需类和库的文件连接到创建的文件,并定义一些宏替换:
//+------------------------------------------------------------------+
//|                                                  FrameViewer.mqh |
//|                                  Copyright 2025, MetaQuotes Ltd. |
//|                                             https://www.mql5.com |
//+------------------------------------------------------------------+
#property copyright "Copyright 2025, MetaQuotes Ltd."
#property link      "https://www.mql5.com"

#include "Controls.mqh"                               // Classes of controls
#include "Table.mqh"                                  // Table class
#include <Arrays\ArrayDouble.mqh>                     // Array of physical data

#define  CELL_W               128                     // Width of table cells
#define  CELL_H               19                      // Height of table cell
#define  BUTT_RES_W           CELL_W+30               // Width of optimization result selection button
#define  DATA_COUNT           8                       // Amount of data
#define  FRAME_ID             1                       // Frame ID
#define  TABLE_OPT_STAT_ID    1                       // ID of statistics table on optimization tab
#define  TABLE_OPT_STAT_ID    2                       // ID of statistics table on optimization tab
几乎每个用于绘图的图形对象都包含多个 CCanvas 对象。一个可以作为基础,上面放置另外两个:第一个上面绘制背景图像,第二个上面显示应该在背景上绘制的内容。对于那些方法用于绘制的对象,将指向所需画布对象的指针传递给这些方法,方法将在这些方法上绘制。
由于有很多类代码,并且每个类及其方法都有完整的注释,因此我们在这里不会详细一步一步地描述所有内容。只需查看类和方法的代码,我们将简要概述所呈现的代码。
所以,进度条类:
//+------------------------------------------------------------------+
//|  Progress bar class that draws in two colors                     |
//+------------------------------------------------------------------+
class CColorProgressBar :public CObject
  {
private:
   CCanvas          *m_background;                    // Pointer to CCanvas class object for drawing on background
   CCanvas          *m_foreground;                    // Pointer to CCanvas class object for drawing on foreground
   CRect             m_bound;                         // Coordinates and dimensions of workspace
   color             m_good_color, m_bad_color;       // Colors of profitable and loss series
   color             m_back_color, m_fore_color;      // Background and frame colors
   bool              m_passes[];                      // Number of processed passes
   int               m_last_index;                    // Last pass index
public:
//--- Constructor/destructor
                     CColorProgressBar(void);
                    ~CColorProgressBar(void){};

//--- Sets pointer to canvas
   void              SetCanvas(CCanvas *background, CCanvas *foreground)
                       {
                        if(background==NULL)
                          {
                           ::Print(__FUNCTION__, ": Error. Background is NULL");
                           return;
                          }
                        if(foreground==NULL)
                          {
                           ::Print(__FUNCTION__, ": Error. Foreground is NULL");
                           return;
                          }

                        this.m_background=background;
                        this.m_foreground=foreground;
                       }
//--- Sets coordinates and dimensions of workspace on canvas
   void              SetBound(const int x1, const int y1, const int x2, const int y2)
                       {
                        this.m_bound.SetBound(x1, y1, x2, y2);
                       }
//--- Return of coordinates of bounds of rectangular area
   int               X1(void)                      const { return this.m_bound.left;   }
   int               Y1(void)                      const { return this.m_bound.top;    }
   int               X2(void)                      const { return this.m_bound.right;  }
   int               Y2(void)                      const { return this.m_bound.bottom; }

//--- Setting background color and frame
   void              SetBackColor(const color clr)       { this.m_back_color=clr;      }
   void              SetForeColor(const color clr)       { this.m_fore_color=clr;      }
//--- Returning background color and frame
   color             BackColor(void)               const { return this.m_back_color;   }
   color             ForeColor(void)               const { return this.m_fore_color;   }
//--- Resets counter to zero
   void              Reset(void)                         { this.m_last_index=0;        }
//--- Adds result for drawing strip in progress bar
   void              AddResult(bool good, const bool chart_redraw);
//--- Updates progress bar on chart
   void              Update(const bool chart_redraw);
  };
//+------------------------------------------------------------------+
//| Constructor                                                      |
//+------------------------------------------------------------------+
CColorProgressBar::CColorProgressBar() : m_last_index(0), m_good_color(clrSeaGreen), m_bad_color(clrLightPink)
  {
//--- Set size of pass array with reserve
   ::ArrayResize(this.m_passes, 5000, 1000);
   ::ArrayInitialize(this.m_passes, 0);
  }
//+------------------------------------------------------------------+
//| Adding result                                                    |
//+------------------------------------------------------------------+
void CColorProgressBar::AddResult(bool good, const bool chart_redraw)
  {
   this.m_passes[this.m_last_index]=good;
//--- Add another vertical line of desired color to progress bar
   this.m_foreground.LineVertical(this.X1()+1+this.m_last_index, this.Y1()+1, this.Y2()-1, ::ColorToARGB(good ? this.m_good_color : this.m_bad_color));
//--- Update on chart
   this.m_foreground.Update(chart_redraw);
//--- Updating index
   this.m_last_index++;
   if(this.m_last_index>=this.m_bound.Width()-1)
      this.m_last_index=0;
  }
//+------------------------------------------------------------------+
//| Updating progress bar on chart                                   |
//+------------------------------------------------------------------+
void CColorProgressBar::Update(const bool chart_redraw)
  {
//--- Fill background with background color
   this.m_background.FillRectangle(this.X1(), this.Y1(), this.X2(), this.Y2(), ::ColorToARGB(this.m_back_color));
//--- Draw border
   this.m_background.Rectangle(this.X1(), this.Y1(), this.X2(), this.Y2(), ::ColorToARGB(this.m_fore_color));
//--- Update chart
   this.m_background.Update(chart_redraw);
  }
该类没有自己的画布对象用于绘图。要指定要在其上绘制的画布对象,有一个方法可以传递指向现有画布的指针。它被分配给类变量。类的方法将在这张画布上绘制。这里有两个对象 —— 一个用于绘制进度条的背景,另一个用于在绘制的背景上绘制前景。特殊图表类的 CCanvas 对象将充当画布,在画布上绘制此进度条。
用于渲染统计图表和优化结果表格以及 EA 设置参数的类:
//+------------------------------------------------------------------+
//| Class for rendering statistics charts and tables                 |
//| of optimization results and EA’s settings parameters             |
//+------------------------------------------------------------------+
class CStatChart: public CObject
  {
private:
   color             m_back_color;        // Background color
   color             m_fore_color;        // Border color
   int               m_line_width;        // Line width in pixels
   int               m_lines;             // Number of lines on chart
   CArrayDouble      m_seria[];           // Arrays for storing chart values
   bool              m_profitseria[];     // Profitable series or not
   int               m_lastseria_index;   // Index of fresh line on chart
   color             m_profit_color;      // Color of profitable series
   color             m_loss_color;        // Color of loss series
   color             m_selected_color;    // Color of selected best series

protected:
   CCanvas          *m_background;        // Pointer to object of CCanvas class for drawing on background
   CCanvas          *m_foreground;        // Pointer to CCanvas class object for drawing on foreground
   CRect             m_bound_chart;       // Workspace of chart
   CRect             m_bound_head;        // Chart header workspace
   CColorProgressBar m_progress_bar;      // Progress bar
   CButton           m_button_replay;     // Replay button
   CButtonSwitch     m_button_res;        // Button for selecting one of top three results
   int               m_tab_id;            // Tab ID

public:
//--- Constructor/destructor
                     CStatChart() : m_lastseria_index(0), m_profit_color(clrForestGreen), m_loss_color(clrOrangeRed), m_selected_color(clrDodgerBlue), m_tab_id(0) {};
                    ~CStatChart() { this.m_background=NULL; this.m_foreground=NULL; }

//--- Sets pointer to canvas
   void              SetCanvas(CCanvas *background, CCanvas *foreground)
                       {
                        if(background==NULL)
                          {
                           ::Print(__FUNCTION__, ": Error. Background is NULL");
                           return;
                          }
                        if(foreground==NULL)
                          {
                           ::Print(__FUNCTION__, ": Error. Foreground is NULL");
                           return;
                          }
                        this.m_background=background;
                        this.m_foreground=foreground;
                        this.m_progress_bar.SetCanvas(background, foreground);
                       }
//--- Sets coordinates and dimensions of chart workspace and progress bar on canvas
   void              SetChartBounds(const int x1, const int y1, const int x2, const int y2)
                       {
                        this.m_bound_chart.SetBound(x1, y1, x2, y2);
                        this.SetBoundHeader(x1, y1-CELL_H, x2, y1);
                        this.m_progress_bar.SetBound(x1, y2-CELL_H, x2, y2);
                       }
//--- Sets coordinates and dimensions of chart header on canvas
   void              SetBoundHeader(const int x1, const int y1, const int x2, const int y2)
                       {
                        this.m_bound_head.SetBound(x1, y1, x2, y2);
                       }
//--- Returns pointer to (1) itself, (2) progress bar
   CStatChart       *Get(void)                           { return &this;                     }
   CColorProgressBar*GetProgressBar(void)                { return(&this.m_progress_bar);     }

//--- Setting/returning tab ID
   void              SetTabID(const int id)              { this.m_tab_id=id;                 }
   int               TabID(void)                   const { return this.m_tab_id;             }

//--- Returning coordinates of bounds of chart’s rectangular area
   int               X1(void)                      const { return this.m_bound_chart.left;   }
   int               Y1(void)                      const { return this.m_bound_chart.top;    }
   int               X2(void)                      const { return this.m_bound_chart.right;  }
   int               Y2(void)                      const { return this.m_bound_chart.bottom; }
//--- Return of coordinates of bounds of rectangular header area
   int               HeaderX1(void)                const { return this.m_bound_head.left;    }
   int               HeaderY1(void)                const { return this.m_bound_head.top;     }
   int               HeaderX2(void)                const { return this.m_bound_head.right;   }
   int               HeaderY2(void)                const { return this.m_bound_head.bottom;  }
//--- Return of coordinates of bounds of rectangular area of progress bar
   int               ProgressBarX1(void)           const { return this.m_progress_bar.X1();  }
   int               ProgressBarY1(void)           const { return this.m_progress_bar.Y1();  }
   int               ProgressBarX2(void)           const { return this.m_progress_bar.X2();  }
   int               ProgressBarY2(void)           const { return this.m_progress_bar.Y2();  }

//--- Returns pointer to button of: (1) replay, (2) result selection (3) worst, (4) average, (5) best result
   CButton          *ButtonReplay(void)                  { return(&this.m_button_replay);    }
   CButtonSwitch    *ButtonResult(void)                  { return(&this.m_button_res);       }
   CButtonTriggered *ButtonResultMin(void)               { return(this.m_button_res.GetButton(0)); }
   CButtonTriggered *ButtonResultMid(void)               { return(this.m_button_res.GetButton(1)); }
   CButtonTriggered *ButtonResultMax(void)               { return(this.m_button_res.GetButton(2)); }

//--- (1) Hides, (2) shows, (3) brings results selection button to foreground
   bool              ButtonsResultHide(void)             { return(this.m_button_res.Hide());       }
   bool              ButtonsResultShow(void)             { return(this.m_button_res.Show());       }
   bool              ButtonsResultBringToTop(void)       { return(this.m_button_res.BringToTop()); }

//--- Creates replay button
   bool              CreateButtonReplay(void)
                       {
                        if(this.m_background==NULL)
                          {
                           ::PrintFormat("%s: Фон не задан (сначала используйте функцию SetCanvas())");
                           return false;
                          }
                        string text="Optimization Completed: Click to Replay";
                        int w=this.m_background.TextWidth(text);

                        //--- Upper-left coordinate of button
                        CPoint cp=this.m_bound_head.CenterPoint();
                        int x=cp.x-w/2;
                        int y=this.Y1()+this.m_bound_head.top-2;

                        //--- Create button and set new colors for it, hide created button
                        if(!this.m_button_replay.Create(::StringFormat("Tab%d_ButtonReplay", this.m_tab_id), text, x, y, w, CELL_H-1))
                           return false;

                        this.m_button_replay.SetDefaultColors(COLOR_BACKGROUND, STATE_OFF, C'144,238,144', C'144,228,144', C'144,218,144', clrSilver);
                        this.m_button_replay.SetDefaultColors(COLOR_BORDER, STATE_OFF, C'144,238,144', C'144,228,144', C'144,218,144', clrSilver);
                        this.m_button_replay.SetDefaultColors(COLOR_FOREGROUND, STATE_OFF, clrBlack, clrBlack, clrBlack, clrGray);
                        this.m_button_replay.ResetUsedColors(STATE_OFF);
                        this.m_button_replay.Draw(false);
                        this.m_button_replay.Hide();
                        return true;
                       }

//--- Creates results selection button
   bool              CreateButtonResults(void)
                       {
                        if(this.m_background==NULL)
                          {
                           ::PrintFormat("%s: Фон не задан (сначала используйте функцию SetCanvas())");
                           return false;
                          }
                        //--- Upper-left coordinate of button
                        int x=this.m_bound_head.left+1;
                        int y=this.m_progress_bar.Y1()+CELL_H+2;
                        int w=BUTT_RES_W;

                        //--- Creatу button and set new colors for it, hidу created button
                        if(!this.m_button_res.Create(::StringFormat("Tab%u_ButtonRes",this.m_tab_id), "", x, y, w, CELL_H-1))
                           return false;

                        string text[3]={"Worst result of the top 3", "Average result of the top 3", "Best result of the top 3"};
                        if(!this.m_button_res.AddNewButton(text, w))
                           return false;
                        this.m_button_res.GetButton(0).SetDefaultColors(COLOR_BORDER, STATE_OFF, C'228,228,228', C'228,228,228', C'228,228,228', clrSilver);
                        this.m_button_res.GetButton(0).ResetUsedColors(STATE_OFF);
                        this.m_button_res.GetButton(1).SetDefaultColors(COLOR_BORDER, STATE_OFF, C'228,228,228', C'228,228,228', C'228,228,228', clrSilver);
                        this.m_button_res.GetButton(1).ResetUsedColors(STATE_OFF);
                        this.m_button_res.GetButton(2).SetDefaultColors(COLOR_BORDER, STATE_OFF, C'228,228,228', C'228,228,228', C'228,228,228', clrSilver);
                        this.m_button_res.GetButton(2).ResetUsedColors(STATE_OFF);
                        this.m_button_res.Draw(false);
                        this.m_button_res.Hide();
                        return true;
                       }

//--- Sets background color
   void              SetBackColor(const color clr)
                       {
                        this.m_back_color=clr;
                        this.m_progress_bar.SetBackColor(clr);
                       }
//--- Sets border color
   void              SetForeColor(const color clr)
                       {
                        this.m_fore_color=clr;
                        this.m_progress_bar.SetForeColor(clr);
                       }

//--- Sets number of lines on chart
   void              SetLines(const int num)
                       {
                        this.m_lines=num;
                        ::ArrayResize(this.m_seria, num);
                        ::ArrayResize(this.m_profitseria, num);
                       }

//--- Setting color of (1) profitable, (2) loss, (3) selected series
   void              SetProfitColorLine(const color clr)    { this.m_profit_color=clr;    }
   void              SetLossColorLine(const color clr)      { this.m_loss_color=clr;      }
   void              SetSelectedLineColor(const color clr)  { this.m_selected_color=clr;  }

//--- Updating object on screen
   void              Update(color clr, const int line_width, const bool chart_redraw);
//--- Adding data from array
   void              AddSeria(const double  &array[], bool profit);
//--- Draws chart
   void              Draw(const int seria_index, color clr, const int line_width, const bool chart_redraw);
//--- Draws line in usual coordinates (from left to right, from bottom to top)
   void              Line(int x1, int y1, int x2, int y2, uint col, int size);
//--- Getting max. and min. values in the series
   double            MaxValue(const int seria_index);
   double            MinValue(const int seria_index);

//--- Event handler
   void OnChartEvent(const int id,const long& lparam,const double& dparam,const string& sparam)
     {
      //--- If replay button is not hidden, call its event handler
      if(!this.m_button_replay.IsHidden())
         this.m_button_replay.OnChartEvent(id, lparam, dparam, sparam);
      //--- If result selection button is not hidden, call its event handler
      if(!this.m_button_res.IsHidden())
         this.m_button_res.OnChartEvent(id, lparam, dparam, sparam);
     }
  };
在指定的画布(背景和前景)上,该类绘制参数和测试结果表格、通过图表、进度条以及用于启动已完成优化过程回放和选择特定优化标准下最佳结果的按钮。
需要注意的是,为了指定画布上跟踪对象或区域所在的矩形区域的边界,这里讨论的类使用 CRect 结构。
该结构在 \MQL5\Include\Controls\Rect.mqh 中进行了描述,它是一个方便的工具,用于指定包含重要元素的矩形区域的边界。例如,在画布上,我们可以限制跟踪鼠标光标的区域,或者我们可以为整个画布大小指定边界矩形的大小。在这种情况下,整个对象的整个区域都可以与光标进行交互。返回矩形区域边界坐标的方法是在结构内创建的。此外,可以通过多种方式设置边界并获得它们的值 —— 这一切都取决于对象的需求和结构。还实现了用于移动和移位矩形区域的方法。一般来说,它是一个方便的工具,用于指定必须以任何方式跟踪的任何区域的边界。
在所讨论的类中,这些区域需要与鼠标光标交互,并指示对象在画布上的位置。
更新图表的方法:
//+------------------------------------------------------------------+
//| Updating chart                                                   |
//+------------------------------------------------------------------+
void CStatChart::Update(color clr, const int line_width, const bool chart_redraw)
  {
//--- If canvas for background or foreground is not installed, exit
   if(this.m_background==NULL || this.m_foreground==NULL)
      return;
//--- StatChart fill in background
   this.m_background.FillRectangle(this.X1(), this.Y1(), this.X2(), this.Y2(), ::ColorToARGB(this.m_back_color));
//--- StatChart draw border
   this.m_background.Rectangle(this.X1(), this.Y1(), this.X2(), this.Y2(), ::ColorToARGB(this.m_fore_color));

//--- ProgressBar fill in background and draw border
   this.m_progress_bar.Update(false);

//--- Draw each series for 80% of available chart area vertically and horizontally
   for(int i=0; i<this.m_lines; i++)
     {
      //--- If color is set missing, use colors of profitable and loss series
      if(clr==clrNONE)
        {
         clr=this.m_loss_color;
         if(this.m_profitseria[i])
            clr=this.m_profit_color;
        }
      //--- otherwise, use color set for selected line
      else
         clr=this.m_selected_color;

      //--- Draw a chart of optimization results
      this.Draw(i, clr, line_width, false);
     }
//--- Update both canvases
   this.m_background.Update(false);
   this.m_foreground.Update(chart_redraw);
  }
画布上用于绘制进度图的矩形区域被擦除,并在上面绘制了一条余额线和一个进度条。
向图表中添加新数据序列的方法:
//+------------------------------------------------------------------+
//| Adds new series of data to be drawn on chart                     |
//+------------------------------------------------------------------+
void CStatChart::AddSeria(const double &array[], bool profit)
  {
//--- Adding array to series number m_lastseria_index
   this.m_seria[this.m_lastseria_index].Resize(0);
   this.m_seria[this.m_lastseria_index].AddArray(array);
   this.m_profitseria[this.m_lastseria_index]=profit;
//--- Track index of last line (not currently in use)
   this.m_lastseria_index++;
   if(this.m_lastseria_index>=this.m_lines)
      this.m_lastseria_index=0;
  }
优化器的每次新通过,其数据数组都必须输入到序列数组中,而这正是该方法所实现的。
获取优化器通过次数数组中指定序列的最大值和最小值的方法:
//+------------------------------------------------------------------+
//| Getting maximum value of specified series                        |
//+------------------------------------------------------------------+
double CStatChart::MaxValue(const int seria_index)
  {
   double res=this.m_seria[seria_index].At(0);
   int total=this.m_seria[seria_index].Total();
//--- Iterate through array and compare every two adjacent series
   for(int i=1; i<total; i++)
     {
      if(this.m_seria[seria_index].At(i)>res)
         res=this.m_seria[seria_index].At(i);
     }
//--- result
   return res;
  }
//+------------------------------------------------------------------+
//| Getting minimum value of specified series                        |
//+------------------------------------------------------------------+
double CStatChart::MinValue(const int seria_index)
  {
   double res=this.m_seria[seria_index].At(0);;
   int total=this.m_seria[seria_index].Total();
//--- Iterate through array and compare every two adjacent series
   for(int i=1; i<total; i++)
     {
      if(this.m_seria[seria_index].At(i)<res)
         res=this.m_seria[seria_index].At(i);
     }
//--- result
   return res;
  }
要将优化器的通过图表相对于特殊图表的中心定位,您应该知道通过序列中的最大值和最小值。然后,利用这些值,您可以计算图表上线条的相对坐标,使线条能够适应分配给绘制优化器通过余额图的图表空间的 80%。
在图表上绘制余额线的方法:
//+------------------------------------------------------------------+
//| Overloading the basic drawing function                           |
//+------------------------------------------------------------------+
void CStatChart::Line(int x1, int y1, int x2, int y2, uint col, int size)
  {
//--- If canvas is not set, exit
   if(this.m_foreground==NULL)
      return;
//--- Since Y-axis is inverted, invert y1 and y2
   int y1_adj=this.m_bound_chart.Height()-CELL_H-y1;
   int y2_adj=this.m_bound_chart.Height()-CELL_H-y2;

//--- Draw smoothed line
//--- If line thickness is less than 3, draw line using the Wu smoothing algorithm
//--- (for thicknesses of 1 and 2, LineWu() method is called in LineThick() method),
//--- otherwise, draw smoothed line of given thickness using LineThick
   this.m_foreground.LineThick(x1, y1_adj, x2, y2_adj,::ColorToARGB(col), (size<1 ? 1 : size), STYLE_SOLID, LINE_END_ROUND);
  }
这是 CCanvas 类中同名方法的重载方法。图表上的坐标从左上角开始。通常情况下,资产负债表的坐标是从左下角开始的。
在这种方法中,屏幕 Y 坐标被翻转,根据数组中余额点的值绘制一条非倒置的余额线。
在图表上绘制余额线的方法:
//+------------------------------------------------------------------+
//| Drawing balance line on chart                                    |
//+------------------------------------------------------------------+
void CStatChart::Draw(const int seria_index, color clr, const int line_width, const bool chart_redraw)
  {
//--- If canvas is not set, exit
   if(this.m_foreground==NULL)
      return;

//--- Preparing coefficients for converting values into pixels
   double min=this.MaxValue(seria_index);
   double max=this.MinValue(seria_index);
   double size=this.m_seria[seria_index].Total();

//--- Indentations from chart edge
   double x_indent=this.m_bound_chart.Width()*0.05;
   double y_indent=this.m_bound_chart.Height()*0.05;

//--- Calculate coefficients
   double k_y=(max-min)/(this.m_bound_chart.Height()-2*CELL_H-2*y_indent);
   double k_x=(size)/(this.m_bound_chart.Width()-2*x_indent);

//--- Coefficients
   double start_x=this.m_bound_chart.left+x_indent;
   double start_y=this.m_bound_chart.bottom-2*CELL_H*2-y_indent;

//--- Now draw polyline passing through all points of series
   for(int i=1; i<size; i++)
     {
      //--- convert values to pixels
      int x1=(int)((i-0)/k_x+start_x);  // set value number horizontally
      int y1=(int)(start_y-(m_seria[seria_index].At(i)-min)/k_y);    // vertically
      int x2=(int)((i-1-0)/k_x+start_x);// set value number horizontally
      int y2=(int)(start_y-(m_seria[seria_index].At(i-1)-min)/k_y);  // vertically
      //--- Draw line from previous point to current one
      this.Line(x1, y1, x2, y2, clr, line_width);
     }
//--- Updating canvas with chart redrawing (if flag is set)
   this.m_foreground.Update(chart_redraw);
  }
在这里,计算图表上余额线的必要坐标(在用于绘制余额图的图表区域内),并在循环中,根据指定序列的数组,在数组中记录的所有余额点之间绘制线条。
帧数据类:
//+------------------------------------------------------------------+
//| Enumerations                                                     |
//+------------------------------------------------------------------+
enum ENUM_FRAME_PROP                                              // Frame properties
  {
   FRAME_PROP_PASS_NUM,                                           // Pass number
   FRAME_PROP_SHARPE_RATIO,                                       // Sharpe Ratio result
   FRAME_PROP_NET_PROFIT,                                         // Net Profit result
   FRAME_PROP_PROFIT_FACTOR,                                      // Profit Factor result
   FRAME_PROP_RECOVERY_FACTOR,                                    // Recovery Factor result
  };
//+------------------------------------------------------------------+
//| Frame data class                                                 |
//+------------------------------------------------------------------+
class CFrameData : public CObject
  {
protected:
   ulong             m_pass;                                      // Pass number
   double            m_sharpe_ratio;                              // Sharpe Ratio
   double            m_net_profit;                                // Total profit
   double            m_profit_factor;                             // Profitability
   double            m_recovery_factor;                           // Recovery factor
public:
//--- Setting frame properties (pass results)
   void              SetPass(const ulong pass)                    { this.m_pass=pass;              }
   void              SetSharpeRatio(const double value)           { this.m_sharpe_ratio=value;     }
   void              SetNetProfit(const double value)             { this.m_net_profit=value;       }
   void              SetProfitFactor(const double value)          { this.m_profit_factor=value;    }
   void              SetRecoveryFactor(const double value)        { this.m_recovery_factor=value;  }
//--- Returning frame properties (pass results)
   ulong             Pass(void)                             const { return this.m_pass;            }
   double            SharpeRatio(void)                      const { return this.m_sharpe_ratio;    }
   double            NetProfit(void)                        const { return this.m_net_profit;      }
   double            ProfitFactor(void)                     const { return this.m_profit_factor;   }
   double            RecoveryFactor(void)                   const { return this.m_recovery_factor; }

//--- Description of properties
   string            PassDescription(void)                  const { return ::StringFormat("Pass: %I64u", this.m_pass);                       }
   string            SharpeRatioDescription(void)           const { return ::StringFormat("Sharpe Ratio: %.2f", this.m_sharpe_ratio);        }
   string            NetProfitDescription(void)             const { return ::StringFormat("Net Profit: %.2f", this.m_net_profit);            }
   string            ProfitFactorDescription(void)          const { return ::StringFormat("Profit Factor: %.2f", this.m_profit_factor);      }
   string            RecoveryFactorDescription(void)        const { return ::StringFormat("Recovery Factor: %.2f", this.m_recovery_factor);  }

//--- Printing frame properties to log
   void              Print(void)
                       {
                        ::PrintFormat("Frame %s:", this.PassDescription());
                        ::PrintFormat(" - %s", this.SharpeRatioDescription());
                        ::PrintFormat(" - %s", this.NetProfitDescription());
                        ::PrintFormat(" - %s", this.ProfitFactorDescription());
                        ::PrintFormat(" - %s", this.RecoveryFactorDescription());
                       }

//--- A method for comparing two objects
   virtual int       Compare(const CObject *node,const int mode=0) const
                       {
                        //--- Compare real values as two-digit values
                        const CFrameData *obj=node;
                        switch(mode)
                          {
                           case FRAME_PROP_SHARPE_RATIO     :  return(::NormalizeDouble(this.SharpeRatio(),2)   > ::NormalizeDouble(obj.SharpeRatio(),2)    ?  1 :
                                                                      ::NormalizeDouble(this.SharpeRatio(),2)   < ::NormalizeDouble(obj.SharpeRatio(),2)    ? -1 : 0);
                           case FRAME_PROP_NET_PROFIT       :  return(::NormalizeDouble(this.NetProfit(),2)     > ::NormalizeDouble(obj.NetProfit(),2)      ?  1 :
                                                                      ::NormalizeDouble(this.NetProfit(),2)     < ::NormalizeDouble(obj.NetProfit(),2)      ? -1 : 0);
                           case FRAME_PROP_PROFIT_FACTOR    :  return(::NormalizeDouble(this.ProfitFactor(),2)  > ::NormalizeDouble(obj.ProfitFactor(),2)   ?  1 :
                                                                      ::NormalizeDouble(this.ProfitFactor(),2)  < ::NormalizeDouble(obj.ProfitFactor(),2)   ? -1 : 0);
                           case FRAME_PROP_RECOVERY_FACTOR  :  return(::NormalizeDouble(this.RecoveryFactor(),2)> ::NormalizeDouble(obj.RecoveryFactor(),2) ?  1 :
                                                                      ::NormalizeDouble(this.RecoveryFactor(),2)< ::NormalizeDouble(obj.RecoveryFactor(),2) ? -1 : 0);
                           //---FRAME_PROP_PASS_NUM
                           default                          :  return(this.Pass()>obj.Pass() ?  1  :  this.Pass()<obj.Pass()  ? -1  :  0);
                          }
                       }

//--- Constructors/destructor
                     CFrameData (const ulong pass, const double sharpe_ratio, const double net_profit, const double profit_factor, const double recovery_factor) :
                        m_pass(pass), m_sharpe_ratio(sharpe_ratio), m_net_profit(net_profit), m_profit_factor(profit_factor), m_recovery_factor(recovery_factor) {}
                     CFrameData (void) :
                        m_pass(0), m_sharpe_ratio(0), m_net_profit(0), m_profit_factor(0), m_recovery_factor(0) {}
                    ~CFrameData (void) {}
  };
优化器每次运行完成后,都会向终端发送一帧数据。它包含了本次通过结束时接收到的所有数据。要访问任何一次传输的数据,应该循环遍历所有接收到的帧,查找具有所需编号的帧,并检索其数据。这是完全不妥的,我们应该能够快速访问所需通过的数据,并能够按指定的属性对所有通过进行排序,因为我们需要选择前三个通过:从四个优化标准中各选一个。
解决办法是缓存通过。为此,我们需要一个帧对象类。每次测试完成后,向终端发送帧后,需要创建一个帧对象,用接收到的测试帧的数据填充其属性,并在列表中找到该帧对象。此外,在优化过程完成后,所有帧都被检索出来,我们将拥有帧列表中所有帧的副本。现在您可以按所需属性对帧列表进行排序,并快速从中检索所需帧的数据。
值得注意的是,在 Compare() 方法中,我们必须比较实数,而不是通过将归一化差与零进行比较,而是通过将两个归一化数相互比较。为什么要这样?
比较两个实数有多种方法。第一种方法是比较未归一化的数字。首先,用三元运算符“大于”进行比较,然后用“小于”进行比较,最后剩下的就是“等于”。或者,您可以将两个数字的归一化差值与零进行比较。然而,在这里,我们必须将这两个数字归一化为两位数,并比较这些值。
事实上,在终端中,结果表显示了优化结果中的两位数。但在内部,这些数字并没有标准化为两位数。换句话说,结果的两位数表示仅反映在结果表中。如果表中有值,例如 1.09 和 1.08,那么事实上可能不是这样。可能存在的是如下数字:1.085686399864 和 1.081254322375。表格中这两个数字分别向上取整为 1.09 和 1.08。但在比较时,您可能会遇到这样一个事实,即这两个数字都通过归一化四舍五入为相同的值。如果不进行归一化,则可能缺少 1.09 的值。这将导致对最佳通过的错误搜索。
解决方法是将这两个数字都归一化为两位数,然后再比较它们的四舍五入值。
帧查看器类:
//+------------------------------------------------------------------+ //| ▸Frame viewer class | //+------------------------------------------------------------------+ class CFrameViewer : public CObject { private: int m_w; // Chart width int m_h; // Chart height color m_selected_color; // Color of selected series from top three uint m_line_width; // Width of line of selected series from top three bool m_completed; // Optimization completion flag CFrameData m_frame_tmp; // Frame object for searching by property CArrayObj m_list_frames; // List of frames CTabControl m_tab_control; // Tab Control //--- Declare tab objects on Tab Control //--- Tab 0 (Optimization) of Tab Control CTableDataControl m_table_inp_0; // Table of optimization parameters on tab 0 CTableDataControl m_table_stat_0; // Table of optimization results on tab 0 CTableDataControl m_table_stat_0; // Table of optimization results on tab 0 CColorProgressBar*m_progress_bar; // Progress bar on optimization chart on tab 0 //--- Tab 1 (Sharpe Ratio) of Tab Control CTableDataControl m_table_inp_1; // Table of optimization parameters on tab 1 CTableDataControl m_table_stat_1; // Table of optimization results on tab 1 CStatChart m_chart_stat_1; // Table of optimization results on tab 1 //--- Tab 2 (Net Profit) of Tab Control CTableDataControl m_table_inp_2; // Table of optimization parameters on tab 2 CTableDataControl m_table_stat_2; // Table of optimization results on tab 2 CStatChart m_chart_stat_2; // Chart of optimization results on tab 2 //--- Tab 3 (Profit Factor) of Tab Control CTableDataControl m_table_inp_3; // Table of optimization parameters on tab 3 CTableDataControl m_table_stat_3; // Table of optimization results on tab 3 CStatChart m_chart_stat_3; // Chart of optimization results on tab 3 //--- Tab 4 (Recovery Factor) of Tab Control CTableDataControl m_table_inp_4; // Table of optimization parameters on tab 4 CTableDataControl m_table_stat_4; // able of optimization results on tab 4 CStatChart m_chart_stat_4; // Chart of optimization results on tab 4 protected: //--- Returns pointer to table of optimization parameters by tab index CTableDataControl*GetTableInputs(const uint tab_id) { switch(tab_id) { case 0 : return this.m_table_inp_0.Get(); case 1 : return this.m_table_inp_1.Get(); case 2 : return this.m_table_inp_2.Get(); case 3 : return this.m_table_inp_3.Get(); case 4 : return this.m_table_inp_4.Get(); default: return NULL; } } //--- Returns pointer to table of optimization results by tab index CTableDataControl*GetTableStats(const uint tab_id) { switch(tab_id) { case 0 : return this.m_table_stat_0.Get(); case 1 : return this.m_table_stat_1.Get(); case 2 : return this.m_table_stat_2.Get(); case 3 : return this.m_table_stat_3.Get(); case 4 : return this.m_table_stat_4.Get(); default: return NULL; } } //--- Returns pointer to chart of optimization results by tab index CStatChart *GetChartStats(const uint tab_id) { switch(tab_id) { case 0 : return this.m_chart_stat_0.Get(); case 1 : return this.m_chart_stat_1.Get(); case 2 : return this.m_chart_stat_2.Get(); case 3 : return this.m_chart_stat_3.Get(); case 4 : return this.m_chart_stat_4.Get(); default: return NULL; } } //--- Adds frame object to list bool AddFrame(CFrameData *frame) { if(frame==NULL) { ::PrintFormat("%s: Error: Empty object passed",__FUNCTION__); return false; } this.m_frame_tmp.SetPass(frame.Pass()); this.m_list_frames.Sort(FRAME_PROP_PASS_NUM); int index=this.m_list_frames.Search(frame); if(index>WRONG_VALUE) return false; return this.m_list_frames.Add(frame); } //--- Draws table of optimization statistics on specified tab void TableStatDraw(const uint tab_id, const int x, const int y, const int w, const int h, const bool chart_redraw); //--- Draws table of input optimization parameters on specified tab void TableInpDraw(const uint tab_id, const int x, const int y, const int w, const int h, const uint rows, const bool chart_redraw); //--- Draws chart of optimization on specified tab void ChartOptDraw(const uint tab_id, const bool opt_completed, const bool chart_redraw); //--- Draws data tables and optimization chart void DrawDataChart(const uint tab_id); //--- Draws charts of top three passes by optimization criterion void DrawBestFrameData(const uint tab_id, const int res_index); //--- Controls view of control objects on optimization charts void ControlObjectsView(const uint tab_id); //--- Replaying frames after optimization completion void ReplayFrames(const int delay_ms); //--- Retrieving data of current frame and printing it on specified tab in table and on optimization results chart bool DrawFrameData(const uint tab_id, const string text, color clr, const uint line_width, ulong &pass, string ¶ms[], uint &par_count, double &data[]); //--- Prints data of specified frame to optimization chart bool DrawFrameDataByPass(const uint tab_id, const ulong pass_num, const string text, color clr, const uint line_width, double &data[]); //--- Fills array with frame indexes of top three passes for specified optimization criterion (by tab index) bool FillArrayBestFrames(const uint tab_id, ulong &array_passes[]); //--- Prints out three best passes on each tab on optimization results charts void DrawBestFrameDataAll(void); //--- Searches for and returns pointer to frame object with a property value less than sample CFrameData *FrameSearchLess(CFrameData *frame, const int mode); public: //--- Setting thickness of selected line void SetSelectedLineWidth(const uint width) { this.m_line_width=width; } //--- Setting color of profitable series void SetProfitColorLine(const color clr) { int total=this.m_tab_control.TabsTotal(); for(int i=1; i<total; i++) { CStatChart *chart=this.GetChartStats(i); if(chart!=NULL) chart.SetProfitColorLine(clr); } } //--- Setting color of loss series void SetLossColorLine(const color clr) { int total=this.m_tab_control.TabsTotal(); for(int i=1; i<total; i++) { CStatChart *chart=this.GetChartStats(i); if(chart!=NULL) chart.SetLossColorLine(clr); } } //--- Setting color of selected series void SetSelectedLineColor(const color clr) { int total=this.m_tab_control.TabsTotal(); for(int i=1; i<total; i++) { CStatChart *chart=this.GetChartStats(i); if(chart!=NULL) chart.SetSelectedLineColor(clr); } } //--- Event handlers of strategy tester void OnTester(const double OnTesterValue); int OnTesterInit(const int lines, const int selected_line_width, const color selected_line_color); void OnTesterPass(void); void OnTesterDeinit(void); //--- Chart event handlers void OnChartEvent(const int id,const long &lparam,const double &dparam,const string &sparam,const int delay_ms); protected: //--- Handler for (1) changing tab of Tab Control element, (2) selecting Button Switch void OnTabSwitchEvent(const int tab_id); void OnButtonSwitchEvent(const int tab_id, const uint butt_id); public: //--- Constructor/destructor CFrameViewer(void); ~CFrameViewer(void){ this.m_list_frames.Clear(); } };
我们确切地知道会有多少个标签页,以及每个标签页上会放置哪些元素。因此,这里没有创建新对象,只是声明了每个选项卡所需对象的实例、访问方法以及类工作的方法。
构造函数
//+------------------------------------------------------------------+
//| Constructor                                                      |
//+------------------------------------------------------------------+
CFrameViewer::CFrameViewer(void) : m_completed(false), m_progress_bar(NULL), m_selected_color(clrDodgerBlue), m_line_width(1)
  {
//--- Chart window size
   this.m_w=(int)::ChartGetInteger(0, CHART_WIDTH_IN_PIXELS);
   this.m_h=(int)::ChartGetInteger(0, CHART_HEIGHT_IN_PIXELS);
//--- Get pointer to progress bar from statistics chart object
   this.m_progress_bar=this.m_chart_stat_0.GetProgressBar();
   this.m_list_frames.Clear();
  }
在构造函数中,我们获取并存储运行 EA 交易的图表的宽度和高度,找到并写入一个指向进度条的指针,并清除帧列表。
启动优化之前,准备一个图表,该图表将在客户端终端中以帧模式启动 EA 交易的副本。图表将从终端上分离,标签控件将以全尺寸显示在图表上。其余元素将位于其标签页上,这些标签页将显示通过余额图和控制按钮。
所有这些操作都必须在 OnTesterInit() 处理函数中完成。为此,该类提供了同名的处理函数,这个处理函数通过 CFrameViewer 类的实例在 EA 交易中启动。
OnTesterInit 处理函数:
//+------------------------------------------------------------------+
//| It must be called in handler of OnTesterInit() Expert Advisor    |
//+------------------------------------------------------------------+
int CFrameViewer::OnTesterInit(const int lines, const int selected_line_width, const color selected_line_color)
  {
//--- Chart ID with expert running in Frame mode
   long chart_id=::ChartID();

//--- Preparing a floating chart for drawing statistics tables and balance lines
   ::ResetLastError();
   if(!::ChartSetInteger(chart_id, CHART_SHOW, false))
     {
      ::PrintFormat("%s: ChartSetInteger() failed. Error %d",__FUNCTION__, GetLastError());
      return INIT_FAILED;
     }
   if(!::ChartSetInteger(chart_id, CHART_IS_DOCKED, false))
     {
      ::PrintFormat("%s: ChartSetInteger() failed. Error %d",__FUNCTION__, GetLastError());
      return INIT_FAILED;
     }
//--- Clearing chart completely of all graphical objects
   ::ObjectsDeleteAll(chart_id);

//--- Based on chart size create Tab Control with five tabs
   int w=(int)::ChartGetInteger(chart_id, CHART_WIDTH_IN_PIXELS);
   int h=(int)::ChartGetInteger(chart_id, CHART_HEIGHT_IN_PIXELS);
   if(this.m_tab_control.Create("TabControl", "", 0, 0, w, h))
     {
      //--- If control is created successfully, add five tabs to it
      bool res=true;
      for(int i=0; i<5; i++)
        {
         string tab_text=(i==1 ? "Sharpe Ratio" : i==2 ? "Net Profit" : i==3 ? "Profit Factor" : i==4 ? "Recovery Factor" : "Optimization");
         res &=this.m_tab_control.AddTab(i, tab_text);
        }
      if(!res)
        {
         ::PrintFormat("%s: Errors occurred while adding tabs to the Tab Control",__FUNCTION__);
         return INIT_FAILED;
        }
     }
   else
     {
      Print("Tab Control creation failed");
      return INIT_FAILED;
     }

//--- CCanvas objects in workspace of tab 0 (Optimization) for drawing background images and text
   CCanvas *tab0_background=this.m_tab_control.GetTabBackground(0);
   CCanvas *tab0_foreground=this.m_tab_control.GetTabForeground(0);
//--- CCanvas objects in workspace of tab 1 (Sharpe Ratio) for drawing background images and text
   CCanvas *tab1_background=this.m_tab_control.GetTabBackground(1);
   CCanvas *tab1_foreground=this.m_tab_control.GetTabForeground(1);
//--- CCanvas objects in workspace of tab 2 (Net Profit) for drawing background images and text
   CCanvas *tab2_background=this.m_tab_control.GetTabBackground(2);
   CCanvas *tab2_foreground=this.m_tab_control.GetTabForeground(2);
//--- CCanvas objects in workspace of tab 3 (Profit Factor) for drawing background images and text
   CCanvas *tab3_background=this.m_tab_control.GetTabBackground(3);
   CCanvas *tab3_foreground=this.m_tab_control.GetTabForeground(3);
//--- CCanvas objects in workspace of tab 4 (Recovery Factor) for drawing background images and text
   CCanvas *tab4_background=this.m_tab_control.GetTabBackground(4);
   CCanvas *tab4_foreground=this.m_tab_control.GetTabForeground(4);

//--- Set tab identifiers for objects of optimization statistics charts
   this.m_chart_stat_0.SetTabID(0);
   this.m_chart_stat_1.SetTabID(1);
   this.m_chart_stat_2.SetTabID(2);
   this.m_chart_stat_3.SetTabID(3);
   this.m_chart_stat_4.SetTabID(4);

//--- Indicate for objects of statistics charts that we draw on tab with corresponding index
   this.m_chart_stat_0.SetCanvas(tab0_background, tab0_foreground);
   this.m_chart_stat_1.SetCanvas(tab1_background, tab1_foreground);
   this.m_chart_stat_2.SetCanvas(tab2_background, tab2_foreground);
   this.m_chart_stat_3.SetCanvas(tab3_background, tab3_foreground);
   this.m_chart_stat_4.SetCanvas(tab4_background, tab4_foreground);

//--- Set number of series on optimization statistics charts
   this.m_chart_stat_0.SetLines(lines);
   this.m_chart_stat_1.SetLines(lines);
   this.m_chart_stat_2.SetLines(lines);
   this.m_chart_stat_3.SetLines(lines);
   this.m_chart_stat_4.SetLines(lines);

//--- Setting background and foreground colors of optimization statistics charts
   this.m_chart_stat_0.SetBackColor(clrIvory);
   this.m_chart_stat_0.SetForeColor(C'200,200,200');
   this.m_chart_stat_1.SetBackColor(clrIvory);
   this.m_chart_stat_1.SetForeColor(C'200,200,200');
   this.m_chart_stat_2.SetBackColor(clrIvory);
   this.m_chart_stat_2.SetForeColor(C'200,200,200');
   this.m_chart_stat_3.SetBackColor(clrIvory);
   this.m_chart_stat_3.SetForeColor(C'200,200,200');
   this.m_chart_stat_4.SetBackColor(clrIvory);
   this.m_chart_stat_4.SetForeColor(C'200,200,200');

//--- Set thickness and color of selected line of best pass
   this.SetSelectedLineWidth(selected_line_width);
   this.SetSelectedLineColor(selected_line_color);

//--- Draw two tables with optimization results and input parameters on tab 0 (Optimization),
//--- and window with progress bar for printing charts and optimization process
   this.TableStatDraw(0, 4, 4, CELL_W*2, CELL_H, false);
   this.TableInpDraw(0, 4, this.m_table_stat_0.Y2()+4, CELL_W*2, CELL_H, 0, false);
   this.ChartOptDraw(0, this.m_completed, true);
//--- Create optimization replay button on tab 0
   if(!this.m_chart_stat_0.CreateButtonReplay())
     {
      Print("Button Replay creation failed");
      return INIT_FAILED;
     }

//--- Draw two tables with optimization results and input parameters on tab 1 (Sharpe Ratio),
//--- and window to print charts of optimization results
   this.TableStatDraw(1, 4, 4, CELL_W*2, CELL_H, false);
   this.TableInpDraw(1, 4, this.m_table_stat_1.Y2()+4, CELL_W*2, CELL_H, 0, false);
   this.ChartOptDraw(1, this.m_completed, true);
//--- Create result selection button on tab 1
   if(!this.m_chart_stat_1.CreateButtonResults())
     {
      Print("Tab1: There were errors when creating the result buttons");
      return INIT_FAILED;
     }

//--- Draw two tables with optimization results and input parameters on tab 2 (Net Profit),
//--- and window to print charts of optimization results
   this.TableStatDraw(2, 4, 4, CELL_W*2, CELL_H, false);
   this.TableInpDraw(2, 4, this.m_table_stat_1.Y2()+4, CELL_W*2, CELL_H, 0, false);
   this.ChartOptDraw(2, this.m_completed, true);
//--- Create result selection button on tab 2
   if(!this.m_chart_stat_2.CreateButtonResults())
     {
      Print("Tab2: There were errors when creating the result buttons");
      return INIT_FAILED;
     }

//--- Draw two tables with optimization results and input parameters on tab 3 (Profit Factor),
//--- and window to print charts of optimization results
   this.TableStatDraw(3, 4, 4, CELL_W*2, CELL_H, false);
   this.TableInpDraw(3, 4, this.m_table_stat_1.Y2()+4, CELL_W*2, CELL_H, 0, false);
   this.ChartOptDraw(3, this.m_completed, true);
//--- Create result selection button on tab 3
   if(!this.m_chart_stat_3.CreateButtonResults())
     {
      Print("Tab3: There were errors when creating the result buttons");
      return INIT_FAILED;
     }

//--- Draw two tables with optimization results and input parameters on tab 4 (Recovery Factor),
//--- and window to print charts of optimization results
   this.TableStatDraw(4, 4, 4, CELL_W*2, CELL_H, false);
   this.TableInpDraw(4, 4, this.m_table_stat_1.Y2()+4, CELL_W*2, CELL_H, 0, false);
   this.ChartOptDraw(4, this.m_completed, true);
//--- Create result selection button on tab 4
   if(!this.m_chart_stat_4.CreateButtonResults())
     {
      Print("Tab4: There were errors when creating the result buttons");
      return INIT_FAILED;
     }

   return INIT_SUCCEEDED;
  }
这里,所有元素都是逐块创建的。每个代码块负责创建程序界面的某个元素。
优化完成后,需要对创建的界面进行一些更改 —— 重新绘制图表标题,更改其上的文本,并在第一个标签页(标识符为 0)上打印回放开始按钮。所有这些都必须在 OnTesterDeinit() 处理函数中实现。
OnTesterDeinit 处理函数:
//+------------------------------------------------------------------+
//| It must be called in handler of OnTesterDeinit() Expert Advisor  |
//+------------------------------------------------------------------+
void CFrameViewer::OnTesterDeinit(void)
  {
//--- Get pointers to canvas to draw background and foreground
   CCanvas *background=this.m_tab_control.GetTabBackground(0);
   CCanvas *foreground=this.m_tab_control.GetTabForeground(0);

   if(background==NULL || foreground==NULL)
      return;

//--- Set optimization completion flag
   this.m_completed=true;

//--- Chart header coordinates
   int x1=this.m_chart_stat_0.HeaderX1();
   int y1=this.m_chart_stat_0.HeaderY1();
   int x2=this.m_chart_stat_0.HeaderX2();
   int y2=this.m_chart_stat_0.HeaderY2();

   int x=(x1+x2)/2;
   int y=(y1+y2)/2;

//--- Repaint background and erase header text
   background.FillRectangle(x1, y1, x2, y2, ::ColorToARGB(clrLightGreen));
   foreground.FillRectangle(x1, y1, x2, y2, 0x00FFFFFF);

//--- Change text and color of header
   string text="Optimization Complete: Click to Replay";
   foreground.FontSet("Calibri", -100, FW_BLACK);
   foreground.TextOut(x, y, text, ::ColorToARGB(clrMidnightBlue), TA_CENTER|TA_VCENTER);
   background.Update(false);
   foreground.Update(true);

//--- Get active tab index and call method for controlling print of control objects on optimization charts
   int tab_selected=this.m_tab_control.GetSelectedTabID();
   this.ControlObjectsView(tab_selected);

//--- On each tab (1-4), draw charts of three best optimization passes
   this.DrawBestFrameDataAll();
   ::ChartRedraw();
  }
每次优化器运行完成后,都会生成一个 Tester 事件,可以在 OnTester() 处理函数中处理该事件。它是在测试代理上运行的 EA 实例侧启动的。
在此处理函数中,需要收集有关已完成通过的所有数据,形成帧,并使用 FrameAdd() 函数将其发送到客户端终端。
OnTester 处理函数:
//+------------------------------------------------------------------+
//| Prepares array of balance values and sends it in frame           |
//| It must be called in Expert Advisor in OnTester() handler        |
//+------------------------------------------------------------------+
void CFrameViewer::OnTester(const double OnTesterValue)
  {
//--- Variables for working with pass results
   double balance[];
   int    data_count=0;
   double balance_current=::TesterStatistics(STAT_INITIAL_DEPOSIT);

//--- Temporary variables for working with trades
   ulong  ticket=0;
   double profit;
   string symbol;
   long   entry;

//--- Request entire trading history
   ::ResetLastError();
   if(!::HistorySelect(0, ::TimeCurrent()))
     {
      PrintFormat("%s: HistorySelect() failed. Error ",__FUNCTION__, ::GetLastError());
      return;
     }

//--- Collect data of trades
   uint deals_total=::HistoryDealsTotal();
   for(uint i=0; i<deals_total; i++)
     {
      ticket=::HistoryDealGetTicket(i);
      if(ticket==0)
         continue;
      symbol=::HistoryDealGetString(ticket, DEAL_SYMBOL);
      entry =::HistoryDealGetInteger(ticket, DEAL_ENTRY);
      profit=::HistoryDealGetDouble(ticket, DEAL_PROFIT);
      if(entry!=DEAL_ENTRY_OUT && entry!=DEAL_ENTRY_INOUT)
         continue;

      balance_current+=profit;
      data_count++;
      ::ArrayResize(balance, data_count);
      balance[data_count-1]=balance_current;
     }
//--- data[] array to send data to frame
   double data[];
   ::ArrayResize(data, ::ArraySize(balance)+DATA_COUNT);
   ::ArrayCopy(data, balance, DATA_COUNT, 0);

//--- Fill in first DATA_COUNT values of array with test results
   data[0]=::TesterStatistics(STAT_SHARPE_RATIO);           // Sharpe Ratio
   data[1]=::TesterStatistics(STAT_PROFIT);                 // net profit
   data[2]=::TesterStatistics(STAT_PROFIT_FACTOR);          // profit factor
   data[3]=::TesterStatistics(STAT_RECOVERY_FACTOR);        // recovery factor
   data[4]=::TesterStatistics(STAT_TRADES);                 // number of trades
   data[5]=::TesterStatistics(STAT_DEALS);                  // number of deals
   data[6]=::TesterStatistics(STAT_EQUITY_DDREL_PERCENT);   // maximum drawdown of funds as percentage
   data[7]=OnTesterValue;                                   // value of user optimization criterion
   if(data[2]==DBL_MAX)
      data[2]=0;
//--- Create data frame and send it to terminal
   if(!::FrameAdd(::MQLInfoString(MQL_PROGRAM_NAME), FRAME_ID, deals_total, data))
      ::PrintFormat("%s: Frame add error: ",__FUNCTION__, ::GetLastError());
  }
当 EA 交易收到客户端终端代理发送的帧时,会生成一个 TesterPass 事件,该事件在 OnTesterPass() 处理函数中处理。
在此处理函数中,从帧中获取信息,在图表上绘制此通过的余额图,并填写测试结果和参数表。将处理过的帧保存到新的帧对象中,并将其添加到帧列表中,以便在需要查找必要的通过并将其打印到图表上时使用它。
OnTesterPass 处理函数:
//+------------------------------------------------------------------+
//| Retrieves data frame during optimization and prints chart        |
//| It must be called in Expert Advisor in OnTesterPass() handler    |
//+------------------------------------------------------------------+
void CFrameViewer::OnTesterPass(void)
  {
//--- Variables to work with frames
   string name;
   ulong  pass;
   long   id;
   double value, data[];
   string params[];
   uint   par_count;

//--- Auxiliary variables
   static datetime start=::TimeLocal();
   static int      frame_counter=0;

//--- When receive new frame, we receive data from it
   while(!::IsStopped() && ::FrameNext(pass, name, id, value, data))
     {
      frame_counter++;
      string text=::StringFormat("Frames completed (tester passes): %d in %s", frame_counter,::TimeToString(::TimeLocal()-start, TIME_MINUTES|TIME_SECONDS));
      //--- Get input parameters of Expert Advisor, for which frame was formed, and send them to tables and on chart
      //--- Upon successful retrieval of frame write its data to frame object and locate it in list
      if(this.DrawFrameData(0, text, clrNONE, 0, pass, params, par_count, data))
        {
         //--- Results of tester's pass
         double sharpe_ratio=data[0];
         double net_profit=data[1];
         double profit_factor=data[2];
         double recovery_factor=data[3];

         //--- Create new frame object and save it in list
         CFrameData *frame=new CFrameData(pass, sharpe_ratio, net_profit, profit_factor, recovery_factor);
         if(frame!=NULL)
           {
            if(!this.AddFrame(frame))
               delete frame;
           }
         ::ChartRedraw();
        }
     }
  }
优化过程完成后,以帧模式运行的 EA 交易将继续在浮动图表的终端中运行。所有与此 EA 交易相关的操作都将在 OnChartEvent() 处理函数中进行,因为我们将使用图表上的按钮和鼠标光标来控制所需的流程。
OnChartEvent 处理函数:
//+------------------------------------------------------------------+
//|  Event handling on chart                                         |
//+------------------------------------------------------------------+
void CFrameViewer::OnChartEvent(const int id,const long &lparam,
                                   const double &dparam,const string &sparam,
                                   const int delay_ms)
  {
//--- Call event handlers for the tab control object and optimization result charts
   this.m_tab_control.OnChartEvent(id, lparam, dparam, sparam);
   this.m_chart_stat_0.OnChartEvent(id, lparam, dparam, sparam);
   this.m_chart_stat_1.OnChartEvent(id, lparam, dparam, sparam);
   this.m_chart_stat_2.OnChartEvent(id, lparam, dparam, sparam);
   this.m_chart_stat_3.OnChartEvent(id, lparam, dparam, sparam);
   this.m_chart_stat_4.OnChartEvent(id, lparam, dparam, sparam);

//--- If chart change event has arrived
   if(id==CHARTEVENT_CHART_CHANGE)
     {
      //--- get chart size
      int w=(int)::ChartGetInteger(0, CHART_WIDTH_IN_PIXELS);
      int h=(int)::ChartGetInteger(0, CHART_HEIGHT_IN_PIXELS);
      if(w!=this.m_w || h!=this.m_h)
        {
         if(w==0 || h==0)
            return;

         //--- Change size of Tab Control
         this.m_tab_control.Resize(w, h);

         //--- Get ID of selected tab and draw data tables and optimization chart on tab
         int tab_selected=this.m_tab_control.GetSelectedTabID();
         this.DrawDataChart(tab_selected);

         //--- Get pointer to toggle button and selected button for printing optimization results
         CButtonSwitch *button_switch=(tab_selected>0 ? this.GetChartStats(tab_selected).ButtonResult() : NULL);
         uint res_index=(button_switch!=NULL ? button_switch.SelectedButton() : -1);

         //--- Depending on selected tab
         switch(tab_selected)
           {
            //--- tab 0 (Optimization)
            case 0 :
               //--- Draw chart with line of last pass and two empty tables
               this.DrawDataChart(0);
               //--- It starts replay of performed optimization,
               //--- which stops working with the rest while replay goes on
               //if(this.m_completed)
               //   this.ReplayFrames(1);
              break;

            //--- tabs 1 - 4
            default:
               //--- Retrieve index of selected optimization pass button
               res_index=button_switch.SelectedButton();
               //--- Draw chart with results of three best passes of selected tab
               this.DrawDataChart(tab_selected);
               this.DrawBestFrameData(tab_selected, -1);
               this.DrawBestFrameData(tab_selected, res_index);

               //--- On tab 0 draw chart with line of last pass and two empty tables
               this.DrawDataChart(0);
               //--- It starts replay of performed optimization,
               //--- which stops working with the rest while replay goes on
               //--- To re-draw charts of all passes, you can click replay button
               //if(this.m_completed)
               //   this.ReplayFrames(1);
              break;
           }

         //--- Remember new dimensions for later verification
         this.m_w=w;
         this.m_h=h;
        }
     }

//--- If optimization process is not completed, exit
   if(!this.m_completed)
      return;

//--- If custom event has arrived
   if(id>CHARTEVENT_CUSTOM)
     {
      //--- If Replay button event has arrived and optimization is complete
      if(sparam==this.m_chart_stat_0.ButtonReplay().Name() && this.m_completed)
        {
         //--- hide Replay button,
         this.m_chart_stat_0.ButtonReplay().Hide();

         //--- Initialize chart of optimization results,
         this.ChartOptDraw(0, this.m_completed, true);

         //--- start replay,
         this.m_completed=false;       // block it so as not to run it several times in a row
         this.ReplayFrames(delay_ms);  // replay procedure
         this.m_completed=true;        // unlock

         //--- After replay is complete, show Replay button and redraw chart
         this.m_chart_stat_0.ButtonReplay().Show();
         ::ChartRedraw();
        }

      //--- Get pointers to tab buttons
      CTabButton *tab_btn0=this.m_tab_control.GetTabButton(0);
      CTabButton *tab_btn1=this.m_tab_control.GetTabButton(1);
      CTabButton *tab_btn2=this.m_tab_control.GetTabButton(2);
      CTabButton *tab_btn3=this.m_tab_control.GetTabButton(3);
      CTabButton *tab_btn4=this.m_tab_control.GetTabButton(4);
      if(tab_btn0==NULL || tab_btn1==NULL || tab_btn2==NULL || tab_btn3==NULL || tab_btn4==NULL)
         return;

      //--- Get ID of selected tab
      int tab_selected=this.m_tab_control.GetSelectedTabID();

      //--- If switch event has arrived to tab 0
      if(sparam==tab_btn0.Name())
        {
         //--- On tab 0, draw chart with last pass line and two tables with empty results
         this.DrawDataChart(0);
         //--- It starts replay of performed optimization
         //--- (it can take a long time - if desired, you can click Replay button to print charts)
         //if(this.m_completed)
         //   this.ReplayFrames(1);
         ::ChartRedraw();
         return;
        }

      //--- Get pointer to chart of selected tab
      CStatChart *chart_stat=this.GetChartStats(tab_selected);
      if(tab_selected==0 || chart_stat==NULL)
         return;
      //--- Get pointers to chart buttons of selected tab (tab index 1-4)
      CButtonTriggered *button_min=chart_stat.ButtonResultMin();
      CButtonTriggered *button_mid=chart_stat.ButtonResultMid();
      CButtonTriggered *button_max=chart_stat.ButtonResultMax();
      if(button_min==NULL || button_mid==NULL || button_max==NULL)
         return;

      //--- If switch event has arrived to tab 1
      if(sparam==tab_btn1.Name())
        {
         //--- call handler for switching to tab
         this.OnTabSwitchEvent(1);
        }
      //--- If switch event has arrived to tab 2
      if(sparam==tab_btn2.Name())
        {
         //--- call handler for switching to tab
         this.OnTabSwitchEvent(2);
        }
      //--- If switch event has arrived to tab 3
      if(sparam==tab_btn3.Name())
        {
         //--- call handler for switching to tab
         this.OnTabSwitchEvent(3);
        }
      //--- If switch event has arrived to tab 4
      if(sparam==tab_btn4.Name())
        {
         //--- call handler for switching to tab
         this.OnTabSwitchEvent(4);
        }

      //--- If event has arrived click on minimum result button of selected tab
      if(sparam==button_min.Name())
        {
         //--- call handler for toggle button switching
         this.OnButtonSwitchEvent(tab_selected, 0);
        }
      //--- If event has arrived click on mid result button of selected tab
      if(sparam==button_mid.Name())
        {
         //--- call handler for toggle button switching
         this.OnButtonSwitchEvent(tab_selected, 1);
        }
      //--- If event has arrived click on max result button of selected tab
      if(sparam==button_max.Name())
        {
         //--- call handler for toggle button switching
         this.OnButtonSwitchEvent(tab_selected, 2);
        }
     }
  }
标签控件的标签切换事件和切换按钮的点击事件均在相应的自定义处理函数中处理。它们之间执行的所有操作都是相同的。唯一的区别在于标签页 ID。因此,这些事件需要由各自的处理函数来处理。
标签页切换处理函数:
//+------------------------------------------------------------------+
//| ▸Tab switching handler                                           |
//+------------------------------------------------------------------+
void CFrameViewer::OnTabSwitchEvent(const int tab_id)
  {
   //--- Get pointer to chart of selected tab
   CStatChart *chart_stat=this.GetChartStats(tab_id);
   if(chart_stat==NULL)
      return;

   //--- Get pointer to chart toggle button of selected tab
   CButtonSwitch *button_switch=chart_stat.ButtonResult();
   if(button_switch==NULL)
      return;

   //--- Index of pressed button
   uint butt_index=button_switch.SelectedButton();
   //--- Initialize chart of results on tab_id and
   this.DrawDataChart(tab_id);
   //--- call method that controls display of control elements on all tabs
   this.ControlObjectsView(tab_id);

   //--- Draw all three best passes
   this.DrawBestFrameData(tab_id, -1);
   //--- Highlight pass selected by button
   this.DrawBestFrameData(tab_id, butt_index);
  }
切换按钮的处理函数:
//+------------------------------------------------------------------+
//| Handler for toggle button switching                              |
//+------------------------------------------------------------------+
void CFrameViewer::OnButtonSwitchEvent(const int tab_id, const uint butt_id)
  {
   //--- Initialize chart of results on tab_id
   this.DrawDataChart(tab_id);
   //--- Draw all three best passes
   this.DrawBestFrameData(tab_id, -1);
   //--- Highlight pass selected by butt_id button
   this.DrawBestFrameData(tab_id, butt_id);
  }
绘制数据表和优化图表的方法:
//+------------------------------------------------------------------+
//| Draws data tables and optimization chart                         |
//+------------------------------------------------------------------+
void CFrameViewer::DrawDataChart(const uint tab_id)
  {
//--- Draw table of statistics, table of input parameters, and optimization chart
   this.TableStatDraw(tab_id, 4, 4, CELL_W*2, CELL_H, false);
   this.TableInpDraw(tab_id, 4, this.GetTableStats(tab_id).Y2()+4, CELL_W*2, CELL_H, this.GetTableInputs(tab_id).RowsTotal(), false);
   this.ChartOptDraw(tab_id, this.m_completed, true);
   //--- call method that controls display of control elements on all tabs
   this.ControlObjectsView(tab_id);
  }
表格和图表绘制完毕后,需要正确设置控件。隐藏非活动标签页上的按钮,并在活动标签页上显示按钮。这是通过 ControlObjectsView 方法实现的。
控制优化图表上控件显示的方法:
//+-------------------------------------------------------------------+
//|Controls view of control objects on optimization charts            |
//+-------------------------------------------------------------------+
void CFrameViewer::ControlObjectsView(const uint tab_id)
  {
//--- Get index of active tab
   int tab_index=this.m_tab_control.GetSelectedTabID();

//--- Get pointer to active tab and optimization statistics table
   CTab              *tab=this.m_tab_control.GetTab(tab_index);
   CTableDataControl *table_stat=this.GetTableStats(tab_index);

   if(tab==NULL || table_stat==NULL)
      return;

//--- Coordinates of left and right boundaries of header of optimization results chart
   int w=0, cpx=0, x=0, y=0;
   int x1=table_stat.X2()+10;
   int x2=tab.GetField().Right()-10;

//--- Depending on selected tab index
   switch(tab_index)
     {
      //--- Optimization
      case 0 :
         //--- Shift Replay button to center of header
         w=this.m_chart_stat_0.ButtonReplay().Width();
         cpx=(x1+x2)/2;
         x=cpx-w/2;
         this.m_chart_stat_0.ButtonReplay().MoveX(x);

         //--- If optimization is completed, show button in foreground
         if(this.m_completed)
           {
            this.m_chart_stat_0.ButtonReplay().Show();
            this.m_chart_stat_0.ButtonReplay().BringToTop();
           }

         //--- Hide buttons of all other tabs
         this.m_chart_stat_1.ButtonsResultHide();
         this.m_chart_stat_2.ButtonsResultHide();
         this.m_chart_stat_3.ButtonsResultHide();
         this.m_chart_stat_4.ButtonsResultHide();
        break;

      //--- Sharpe Ratio
      case 1 :
         //--- Hide Replay button
         this.m_chart_stat_0.ButtonReplay().Hide();

         //--- Get Y coordinate and move toggle button to it
         y=this.m_chart_stat_1.ProgressBarY1()+CELL_H+2;
         this.m_chart_stat_1.ButtonResult().MoveY(y);

         //--- Move toggle button on tab 1 to foreground,
         //--- and hide all other buttons on other tabs
         this.m_chart_stat_1.ButtonsResultBringToTop();
         this.m_chart_stat_2.ButtonsResultHide();
         this.m_chart_stat_3.ButtonsResultHide();
         this.m_chart_stat_4.ButtonsResultHide();
        break;

      //--- Net Profit
      case 2 :
         this.m_chart_stat_0.ButtonReplay().Hide();

         //--- Get Y coordinate and move toggle button to it
         y=this.m_chart_stat_2.ProgressBarY1()+CELL_H+2;
         this.m_chart_stat_2.ButtonResult().MoveY(y);

         //--- Move toggle button on tab 2 to foreground,
         //--- and hide all other buttons on other tabs
         this.m_chart_stat_2.ButtonsResultBringToTop();
         this.m_chart_stat_1.ButtonsResultHide();
         this.m_chart_stat_3.ButtonsResultHide();
         this.m_chart_stat_4.ButtonsResultHide();
        break;

      //--- Profit Factor
      case 3 :
         this.m_chart_stat_0.ButtonReplay().Hide();

         //--- Get Y coordinate and move toggle button to it
         y=this.m_chart_stat_3.ProgressBarY1()+CELL_H+2;
         this.m_chart_stat_3.ButtonResult().MoveY(y);

         //--- Move toggle button on tab 3 to foreground,
         //--- and hide all other buttons on other tabs
         this.m_chart_stat_3.ButtonsResultBringToTop();
         this.m_chart_stat_1.ButtonsResultHide();
         this.m_chart_stat_2.ButtonsResultHide();
         this.m_chart_stat_4.ButtonsResultHide();
        break;

      //--- Recovery Factor
      case 4 :
         this.m_chart_stat_0.ButtonReplay().Hide();

         //--- Get Y coordinate and move toggle button to it
         y=this.m_chart_stat_4.ProgressBarY1()+CELL_H+2;
         this.m_chart_stat_4.ButtonResult().MoveY(y);

         //--- Move toggle button on tab 4 to foreground,
         //--- and hide all other buttons on other tabs
         this.m_chart_stat_4.ButtonsResultBringToTop();
         this.m_chart_stat_1.ButtonsResultHide();
         this.m_chart_stat_2.ButtonsResultHide();
         this.m_chart_stat_3.ButtonsResultHide();
        break;
      default:
        break;
     }
//--- Redraw chart
   ::ChartRedraw();
  }
在优化完成后重放帧的方法:
//+------------------------------------------------------------------+
//| Replaying frames after optimization completion                   |
//+------------------------------------------------------------------+
void CFrameViewer::ReplayFrames(const int delay_ms)
  {
//--- Variables to work with frames
   string name;
   ulong  pass;
   long   id;
   double value, data[];
   string params[];
   uint   par_count;

//--- Frame counter
   int frame_counter=0;

//--- Reset progress bar counters
   this.m_progress_bar.Reset();
   this.m_progress_bar.Update(false);

//--- Move frame pointer to the beginning and start iterating through frames
   ::FrameFirst();
   while(!::IsStopped() && ::FrameNext(pass, name, id, value, data))
     {
      //--- Increase frame counter and prepare header text of optimization chart
      frame_counter++;
      string text=::StringFormat("Playing with pause %d ms: frame %d", delay_ms, frame_counter);
      //--- Get input parameters of Expert Advisor, for which frame is formed, frame data, and print them on chart
      if(this.DrawFrameData(0, text, clrNONE, 0, pass, params, par_count, data))
         ::ChartRedraw();

      //--- Wait for delay_ms milliseconds
      ::Sleep(delay_ms);
     }
  }
优化后,所有接收到的帧均可查看。在这里,在一个简单的循环中,从第一帧开始,我们遍历所有可用的帧,并将它们的数据打印到表格和图表中。
将指定帧的数据打印到优化图表上的方法:
//+------------------------------------------------------------------+
//| Prints data of specified frame on optimization chart             |
//+------------------------------------------------------------------+
bool CFrameViewer::DrawFrameDataByPass(const uint tab_id, const ulong pass_num, const string text, color clr, const uint line_width, double &data[])
  {
//--- Variables to work with frames
   string name;
   ulong  pass;
   long   id;
   uint   par_count;
   double value;
   string params[];

//--- Move frame pointer to the beginning and start search of pass_num frame
   ::FrameFirst();
   while(::FrameNext(pass, name, id, value, data))
     {
      //--- If passe number matches the desired one -
      //--- get frame data and print it in table
      //--- and on chart on tab tab_id
      if(pass==pass_num)
        {
         if(DrawFrameData(tab_id, text, clr, line_width, pass, params, par_count, data))
            return true;
        }
     }
//--- Pass not found
   return false;
  }
由于优化后可用的帧只能通过循环遍历 FrameFirst() --> FrameNext() 并使用标准方法检索,因此我们遍历所有可用的帧,以查找我们想要的通过编号的帧。一旦找到所需的帧,其数据就会打印在图表上。
基本上,经过优化后,我们得到了一个现成的帧对象列表,我们可以快速地从列表中获取所需的对象。您可以使用这种方式访问所需的帧,但在这种情况下,您必须实现更多方法来从帧对象和序列数组中检索数据,将其转换为所需的格式并将其打印在图表上。但就目前而言,访问完全按照上述方法进行,以减少类中的代码量并简化其理解。
根据优化标准绘制三个最佳通过结果图表的方法:
//+------------------------------------------------------------------+
//| Draws charts of top three passes by optimization criterion       |
//+------------------------------------------------------------------+
void CFrameViewer::DrawBestFrameData(const uint tab_id, const int res_index)
  {
//--- If incorrect identifiers of table and pressed button are passed, exit
   if(tab_id<1 || tab_id>4 || res_index>2)
     {
      ::PrintFormat("%s: Error. Incorrect table (%u) or selected button (%d) identifiers passed",__FUNCTION__, tab_id, res_index);
      return;
     }

//--- Arrays for getting results of passes
   ulong array_passes[3];
   double data[];

//--- Create header text of pass chart
   string res=
     (
      tab_id==1 ? "Results by Sharpe Ratio"     :
      tab_id==2 ? "Results by Net Profit"       :
      tab_id==3 ? "Results by Profit Factor"    :
      tab_id==4 ? "Results by Recovery Factor"  :
      ""
     );
   string text="Optimization Completed: "+res;

//--- Fill in array_passes array by indexes of three best passes
   this.FillArrayBestFrames(tab_id, array_passes);
//--- If index of pass button is set to negative number -
   if(res_index<0)
     {
      //--- print all three passes on chart
      //--- (line color is specified as clrNONE for automatic line color selection of profitable or loss series)
      for(int i=0; i<(int)array_passes.Size(); i++)
         this.DrawFrameDataByPass(tab_id, array_passes[i], text, clrNONE, 0, data);
     }
   //--- Otherwise, print series indicated by index of pressed button on chart (res_index),
   //--- by color set in m_selected_color, and width specified in m_line_width
   else
      this.DrawFrameDataByPass(tab_id, array_passes[res_index], text, this.m_selected_color, this.m_line_width, data);
  }
首先,使用 FillArrayBestFrames() 方法将数组填充为三个最佳通过的帧索引,然后将所需的通过(或所有三个)打印到图表上。
该方法将指定优化标准下三个最佳通过的帧索引填充到一个数组中:
//+------------------------------------------------------------------+
//| Fills array with frame indexes of top three passes               |
//| for specified optimization criterion (by tab index)              |
//+------------------------------------------------------------------+
bool CFrameViewer::FillArrayBestFrames(const uint tab_id, ulong &array_passes[])
  {
//--- Clear array of optimization pass indexes passed to method
   ::ZeroMemory(array_passes);

   //FRAME_PROP_PASS_NUM,           // Pass number
   //FRAME_PROP_SHARPE_RATIO,       // Sharpe Ratio result
   //FRAME_PROP_NET_PROFIT,         // Net Profit result
   //FRAME_PROP_PROFIT_FACTOR,      // Profit Factor result
   //FRAME_PROP_RECOVERY_FACTOR,    // Recovery Factor result

//--- By using tab ID, determine property by which best optimization passes will be searched
//--- Check tab ID to be within 1 to 4
   if(tab_id<FRAME_PROP_SHARPE_RATIO || tab_id>FRAME_PROP_RECOVERY_FACTOR)
     {
      ::PrintFormat("%s: Error: Invalid tab ID passed (%u)",__FUNCTION__, tab_id);
      return false;
     }

//--- Convert table ID to frame property
   ENUM_FRAME_PROP prop=(ENUM_FRAME_PROP)tab_id;

//--- Sort frame list in ascending order by property,
//--- which corresponds to tab_id value as ENUM_FRAME_PROP
   this.m_list_frames.Sort(prop);

//--- After sorting, frame with best result will be at list end
//--- Using index, get frame from list with maximum result value and
   int index=this.m_list_frames.Total()-1;
   CFrameData *frame_next=this.m_list_frames.At(index);
   if(frame_next==NULL)
      return false;

//--- register pass number to last cell of array_passes
   array_passes[2]=frame_next.Pass();

//--- Now find objects for which optimization result in descending order is less than maximum found
//--- In loop from 1 to 0 (remaining cells of array_passes)
   for(int i=1; i>=0; i--)
     {
      //--- look for previous object with property value less than that of frame_next object
      frame_next=this.FrameSearchLess(frame_next, prop);
      //--- In next cell of array_passes, enter pass number of found object
      //--- If object is not found, it means that there are no objects with value less than that of frame_next object,
      //--- and in this case, enter its previous value to next cell of array_passes
      array_passes[i]=(frame_next!=NULL ? frame_next.Pass() : array_passes[i+1]);
     }
//--- Success
   return true;
  }
整个方法的逻辑在代码的注释中得到了充分的解释。在数组中方法运行结束时,将根据与标签编号对应的优化标准记录三个最佳通过的数量(大小为 3),这些通过的数据必须打印在该图表上。FrameSearchLess() 方法用于搜索属性值低于当前帧的帧。
用于查找并返回指向具有小于样本值的帧对象的指针的方法:
//+------------------------------------------------------------------+
//| Searches for and returns pointer to frame object,                |
//| with property value less than sample                             |
//+------------------------------------------------------------------+
CFrameData *CFrameViewer::FrameSearchLess(CFrameData *frame, const int mode)
  {
//--- Depending on type of frame property
   switch(mode)
     {
      //--- to temporary object record corresponding property of object passed to method
      case FRAME_PROP_SHARPE_RATIO     :  this.m_frame_tmp.SetSharpeRatio(frame.SharpeRatio());       break;
      case FRAME_PROP_NET_PROFIT       :  this.m_frame_tmp.SetNetProfit(frame.NetProfit());           break;
      case FRAME_PROP_PROFIT_FACTOR    :  this.m_frame_tmp.SetProfitFactor(frame.ProfitFactor());     break;
      case FRAME_PROP_RECOVERY_FACTOR  :  this.m_frame_tmp.SetRecoveryFactor(frame.RecoveryFactor()); break;
      default                          :  this.m_frame_tmp.SetPass(frame.Pass());                     break;
     }
//--- Sort array of frames by specified property and
   this.m_list_frames.Sort(mode);
//--- get index of nearest object with lower property value, or -1
   int index=this.m_list_frames.SearchLess(&this.m_frame_tmp);
//--- Get object by index from list and return pointer to it, or NULL
   CFrameData *obj=this.m_list_frames.At(index);
   return obj;
  }
将帧传递给该方法,在已排序的帧列表中,使用标准库的 CArrayObj 类的 SearchLess() 方法搜索属性值小于传递给该方法的帧的最近的对象。
在每个标签页的优化结果图表中打印出三个最佳优化结果的方法
//+------------------------------------------------------------------+
//| Prints on optimization results charts                            |
//| on each tab three best passes                                    |
//+------------------------------------------------------------------+
void CFrameViewer::DrawBestFrameDataAll(void)
  {
//--- In a loop through all tabs from tab 1, draw charts of top three passes for each tab
   for(int i=1; i<this.m_tab_control.TabsTotal(); i++)
      this.DrawBestFrameData(i,-1);
  }
用于检索当前帧数据并将其打印到表格指定标签页和优化结果图表中的方法:
//+-------------------------------------------------------------------+ //| Retrieving data of current frame and printing it on specified tab | //| in table and on optimization results chart | //+-------------------------------------------------------------------+ bool CFrameViewer::DrawFrameData(const uint tab_id, const string text, color clr, const uint line_width, ulong &pass, string ¶ms[], uint &par_count, double &data[]) { //--- Check passed tab ID if(tab_id>4) { ::PrintFormat("%s: Error: Invalid tab ID passed (%u)",__FUNCTION__, tab_id); return false; } //--- Get pointers to objects used on specified tab CCanvas *foreground=this.m_tab_control.GetTabForeground(tab_id); CTableDataControl *table_stat=this.GetTableStats(tab_id); CTableDataControl *table_inp=this.GetTableInputs(tab_id); CStatChart *chart_stat=this.GetChartStats(tab_id); if(foreground==NULL || table_stat==NULL || table_inp==NULL || chart_stat==NULL) return false; //--- Get input parameters of Expert Advisor, for which frame is formed, frame data, and print them on chart ::ResetLastError(); if(::FrameInputs(pass, params, par_count)) { //--- Draw table of input parameters on chart this.TableInpDraw(tab_id, 4, table_stat.Y2()+4, CELL_W*2, CELL_H, par_count, false); //--- Iterate through parameters, params[i], string looks as "parameter=value" for(uint i=0; i<par_count; i++) { //--- Fill in table with names and values of input parameters string array[]; //--- Split string in params[i] into two substrings and update cells in string of test parameters table if(::StringSplit(params[i],'=',array)==2) { //--- Fill in strings of optimized parameters with pale yellow color, //--- parameters that are not available for optimization - to pale pink, the rest - to default colors bool enable=false; double value=0, start=0, step=0, stop=0; color clr=clrMistyRose; if(::ParameterGetRange(array[0], enable, value, start, step, stop)) clr=(enable ? clrLightYellow : clrNONE); //--- Get two cells of table by parameter index and print text of parameter name and its value to them CTableCell *cell_0=table_inp.GetCell(i, 0); CTableCell *cell_1=table_inp.GetCell(i, 1); if(cell_0!=NULL && cell_1!=NULL) { //--- Update captions in cells cell_0.SetText(array[0]); cell_1.SetText(array[1]); cell_0.TextOut(foreground, 4, CELL_H/2, clr, 0, TA_VCENTER); cell_1.TextOut(foreground, 4, CELL_H/2, clr, 0, TA_VCENTER); } } } //--- Update optimization statistics table //--- Table header string foreground.FillRectangle(table_stat.X1()+1, 4+1, table_stat.X1()+CELL_W*2-1, 4+CELL_H-1, 0x00FFFFFF); foreground.FontSet("Calibri", -100, FW_BLACK); foreground.TextOut(4+(CELL_W*2)/2, 4+CELL_H/2, ::StringFormat("Optimization results (pass %I64u)", pass), ::ColorToARGB(clrMidnightBlue), TA_CENTER|TA_VCENTER); //--- In loop by number of strings in table int total=table_stat.RowsTotal(); for(int i=0; i<total; i++) { //--- get two cells of current string and CTableCell *cell_0=table_stat.GetCell(i, 0); CTableCell *cell_1=table_stat.GetCell(i, 1); if(cell_0!=NULL && cell_1!=NULL) { //--- update values of pass results in second cell string text="---"; switch(i) { case 0 : text=::StringFormat("%.2f", data[0]); break; // Sharpe Ratio case 1 : text=::StringFormat("%.2f", data[1]); break; // Net Profit case 2 : text=::StringFormat("%.2f", data[2]); break; // Profit Factor case 3 : text=::StringFormat("%.2f", data[3]); break; // Recovery Factor case 4 : text=::StringFormat("%.0f", data[4]); break; // Trades case 5 : text=::StringFormat("%.0f", data[5]); break; // Deals case 6 : text=::StringFormat("%.2f%%", data[6]);break; // Equity DD case 7 : text=::StringFormat("%G", data[7]); break; // OnTester() default: break; } //--- Highlight background of table string corresponding to selected tab with color. //--- Remaining strings will have default color color clr=(tab_id>0 ? (i==tab_id-1 ? C'223,242,231' : clrNONE) : clrNONE); //--- Update captions in cells cell_0.TextOut(foreground, 4, CELL_H/2, clr, 0, TA_VCENTER); cell_1.SetText(text); cell_1.TextOut(foreground, 4, CELL_H/2, clr, 0, TA_VCENTER); } } //--- Array for accepting values of balance of current frame double seria[]; ::ArrayCopy(seria, data, 0, DATA_COUNT, ::ArraySize(data)-DATA_COUNT); //--- Send array for printing on special balance chart chart_stat.AddSeria(seria, data[1]>0); //--- Update balance lines on chart chart_stat.Update(clr, line_width, false); //--- Update progress bar (only for tab with ID 0) if(tab_id==0) this.m_progress_bar.AddResult(data[1]>0, false); //--- Update caption on chart header int x1=chart_stat.HeaderX1(); int y1=chart_stat.HeaderY1(); int x2=chart_stat.HeaderX2(); int y2=chart_stat.HeaderY2(); int x=(x1+x2)/2; int y=(y1+y2)/2; foreground.FillRectangle(x1, y1, x2, y2, 0x00FFFFFF); foreground.FontSet("Calibri", -100, FW_BLACK); foreground.TextOut(x, y, text, ::ColorToARGB(clrMidnightBlue), TA_CENTER|TA_VCENTER); foreground.Update(false); //--- Success return true; } //--- Failed... else PrintFormat("%s: FrameInputs() failed. Error %d",__FUNCTION__, ::GetLastError()); return false; }
在该方法中,从帧中检索数据,用这些数据填充所有表格,并绘制此优化过程的余额图。
在指定标签页上绘制优化统计信息表的方法:
//+------------------------------------------------------------------+
//| Draws table of optimization statistics on specified tab          |
//+------------------------------------------------------------------+
void CFrameViewer::TableStatDraw(const uint tab_id, const int x, const int y, const int w, const int h, const bool chart_redraw)
  {
//--- Check passed tab ID
   if(tab_id>4)
     {
      ::PrintFormat("%s: Error: Invalid tab ID passed (%u)",__FUNCTION__, tab_id);
      return;
     }
//--- Get pointers to objects used on specified tab
   CCanvas           *background=this.m_tab_control.GetTabBackground(tab_id);
   CCanvas           *foreground=this.m_tab_control.GetTabForeground(tab_id);
   CTableDataControl *table_stat=this.GetTableStats(tab_id);

   if(background==NULL || foreground==NULL || table_stat==NULL)
      return;

//--- Draw header of optimization results table
   background.FillRectangle(x, y, x+CELL_W*2, y+CELL_H, ::ColorToARGB(C'195,209,223'));   // C'180,190,230'
   foreground.FillRectangle(x+1, y+1, x+CELL_W*2-1, y+CELL_H-1, 0x00FFFFFF);
   foreground.FontSet("Calibri", -100, FW_BLACK);
   foreground.TextOut(x+(CELL_W*2)/2, y+CELL_H/2, "Optimization results", ::ColorToARGB(clrMidnightBlue), TA_CENTER|TA_VCENTER);

//--- Set table's identifier and draw table grid
   table_stat.SetID(TABLE_OPT_STAT_ID+10*tab_id);
   table_stat.DrawGrid(background, x, y+CELL_H, 0, DATA_COUNT, 2, CELL_H, CELL_W, C'200,200,200', false);

//--- Draw empty table of optimization results - only headers, without values
//--- In a loop by table rows
   int total=table_stat.RowsTotal();
   for(int row=0; row<total; row++)
     {
      //--- iterate through columns of rows
      for(int col=0; col<2; col++)
        {
         //--- Get table cell in current row and column
         CTableCell *cell=table_stat.GetCell(row, col);
         //--- Define text in cell
         //--- For left cell, these will be headers of results of parameters optimized
         if(col%2==0)
           {
            string text="OnTester()";
            switch(row)
              {
               case 0 : text="Sharpe Ratio";    break;
               case 1 : text="Net Profit";      break;
               case 2 : text="Profit Factor";   break;
               case 3 : text="Recovery Factor"; break;
               case 4 : text="Trades";          break;
               case 5 : text="Deals";           break;
               case 6 : text="Equity DD";       break;
               default: break;
              }
            cell.SetText(text);
           }
         //--- For right cell, text will be strikeout for table initialized
         else
            cell.SetText(tab_id==0 ? " --- " : "");

         //--- Print corresponding text in cell
         cell.TextOut(foreground, 4, CELL_H/2, clrNONE, 0, TA_VCENTER);
        }
     }

//--- Update background and foreground canvas
   background.Update(false);
   foreground.Update(chart_redraw);
  }
该方法绘制优化结果表,仅填充表的行标题。使用上述方法将数据单元格输入表中。
在指定标签页上绘制输入优化参数表格的方法:
//+------------------------------------------------------------------+
//|Draws table of input optimization parameters on the specified tab |
//+------------------------------------------------------------------+
void CFrameViewer::TableInpDraw(const uint tab_id, const int x, const int y, const int w, const int h, const uint rows, const bool chart_redraw)
  {
//--- Check passed tab ID
   if(tab_id>4)
     {
      ::PrintFormat("%s: Error: Invalid tab ID passed (%u)",__FUNCTION__, tab_id);
      return;
     }
//--- Get pointers to objects used on specified tab
   CCanvas           *background=this.m_tab_control.GetTabBackground(tab_id);
   CCanvas           *foreground=this.m_tab_control.GetTabForeground(tab_id);
   CTableDataControl *table_inp=this.GetTableInputs(tab_id);

   if(background==NULL || foreground==NULL || table_inp==NULL)
      return;

//--- Draw header of optimization parameters table
   background.FillRectangle(x, y, x+CELL_W*2, y+CELL_H, ::ColorToARGB(C'195,209,223'));
   foreground.FillRectangle(x+1, y+1, x+CELL_W*2-1, y+CELL_H-1, 0x00FFFFFF);
   foreground.FontSet("Calibri", -100, FW_BLACK);
   foreground.TextOut(x+(CELL_W*2)/2, y+CELL_H/2, "Input parameters", ::ColorToARGB(clrMidnightBlue), TA_CENTER|TA_VCENTER);

//--- Set table's identifier and draw table grid
   table_inp.SetID(TABLE_OPT_INP_ID+10*tab_id);
   table_inp.DrawGrid(background, x, y+CELL_H, 0, rows, 2, CELL_H, CELL_W, C'200,200,200', false);

//--- Update background and foreground canvas
   background.Update(false);
   foreground.Update(chart_redraw);
  }
与前面的方法一样,该方法绘制一个空的优化参数表,并在 DrawFrameData() 方法中填充数据,其中测试程序执行一次测试所用的参数已经已知。
在指定标签页上绘制优化图表的方法:
//+------------------------------------------------------------------+
//| Draws chart of optimization on specified tab                     |
//+------------------------------------------------------------------+
void CFrameViewer::ChartOptDraw(const uint tab_id, const bool opt_completed, const bool chart_redraw)
  {
//--- Check passed tab ID
   if(tab_id>4)
     {
      ::PrintFormat("%s: Error: Invalid tab ID passed (%u)",__FUNCTION__, tab_id);
      return;
     }
//--- Get pointers to objects used on specified tab
   CCanvas           *background=this.m_tab_control.GetTabBackground(tab_id);
   CCanvas           *foreground=this.m_tab_control.GetTabForeground(tab_id);
   CTab              *tab=this.m_tab_control.GetTab(tab_id);
   CTableDataControl *table_stat=this.GetTableStats(tab_id);
   CStatChart        *chart_stat=this.GetChartStats(tab_id);

   if(background==NULL || foreground==NULL || tab==NULL || table_stat==NULL || chart_stat==NULL)
      return;

//--- Calculate coordinates of four corners of optimization results chart
   int x1=table_stat.X2()+10;
   int y1=table_stat.Y1();
   int x2=tab.GetField().Right()-10;
   int y2=tab.GetField().Bottom()-tab.GetButton().Height()-12;

//--- Check size limits by minimum width and height (480 x 180)
   int w_min=480;
   if(x2-x1<w_min)
      x2=x1+w_min;
   if(y2-y1<180)
      y2=y1+180;

//--- Set dimensions of bounding rectangle of optimization results chart
   chart_stat.SetChartBounds(x1, y1, x2, y2);

//--- Color and text of chart header
   color clr=clrLightGreen;   // header color at optimization completion
   string suff=
     (
      tab_id==1 ? "Results by Sharpe Ratio"     :
      tab_id==2 ? "Results by Net Profit"       :
      tab_id==3 ? "Results by Profit Factor"    :
      tab_id==4 ? "Results by Recovery Factor"  :
                     "Click to Replay"
     );
   string text="Optimization Completed: "+suff;

//--- If optimization is not completed, specify color and text of header
   if(!opt_completed)
     {
      clr=C'195,209,223';
      text=::StringFormat("Optimization%sprogress%s", (tab_id==0 ? " " : " in "), (tab_id==0 ? "" : ": Waiting ... "));
     }

//--- Draw header and text
   background.FillRectangle(x1, 4, x2, y1, ::ColorToARGB(clr));
   foreground.FillRectangle(x1, 4, x2, y2, 0x00FFFFFF);
   foreground.FontSet("Calibri", -100, FW_BLACK);
   foreground.TextOut((x1+x2)/2, 4+CELL_H/2, text, ::ColorToARGB(clrMidnightBlue), TA_CENTER|TA_VCENTER);

//--- Erase whole chart of optimization results
   background.FillRectangle(x1, y1, x2, y2, 0x00FFFFFF);
   foreground.FillRectangle(x1, y1, x2, y2, 0x00FFFFFF);

//--- Update optimization chart
   chart_stat.Update(clrNONE, 0, chart_redraw);
  }
该方法生成一张带有标题的干净图表,图表上会打印出通过绘图方法完成的优化过程的余额线。
我们已完全实现了可视化优化所需的所有类。现在,可以将 CFrameViewer 类文件附加到任何 EA 交易,以便在终端的单独图表中查看其优化进度。
将功能连接到 EA 交易
让我们看看我们有什么。
从标准交付位置:\MQL5\Experts\Advisors\ExpertMAMA.mq5 获取 EA,并将其保存到新创建的文件夹 \MQL5\Experts\FrameViewer\中,命名为 ExpertMAMA_Frames.mq5 。
只需在列表末尾连接 CFrameViewer 类文件,声明一个与该类类型相同的对象,并添加处理函数,在该处理函数中必须调用与所创建类同名的处理函数。
通过从变量名中删除下划线(“_”),可以稍微缩短 EA 输入变量的长度。这样可以给它们更多空间来适应表格单元格的宽度。
//+------------------------------------------------------------------+
//|                                                   ExpertMAMA.mq5 |
//|                             Copyright 2000-2025, MetaQuotes Ltd. |
//|                                             https://www.mql5.com |
//+------------------------------------------------------------------+
#property copyright "Copyright 2000-2025, MetaQuotes Ltd."
#property link      "https://www.mql5.com"
#property version   "1.00"
//+------------------------------------------------------------------+
//| Include                                                          |
//+------------------------------------------------------------------+
#include <Expert\Expert.mqh>
#include <Expert\Signal\SignalMA.mqh>
#include <Expert\Trailing\TrailingMA.mqh>
#include <Expert\Money\MoneyNone.mqh>
//+------------------------------------------------------------------+
//| Inputs                                                           |
//+------------------------------------------------------------------+
//--- inputs for expert
input string             InpExpertTitle      =  "ExpertMAMA";
int                      Expert_MagicNumber  =  12003;
bool                     Expert_EveryTick    =  false;
//--- inputs for signal
input int                InpSignalMAPeriod   =  12;
input int                InpSignalMAShift    =  6;
input ENUM_MA_METHOD     InpSignalMAMethod   =  MODE_SMA;
input ENUM_APPLIED_PRICE InpSignalMAApplied  =  PRICE_CLOSE;
//--- inputs for trailing
input int                InpTrailingMAPeriod =  12;
input int                InpTrailingMAShift  =  0;
input ENUM_MA_METHOD     InpTrailingMAMethod =  MODE_SMA;
input ENUM_APPLIED_PRICE InpTrailingMAApplied=  PRICE_CLOSE;
//+------------------------------------------------------------------+
//| Global expert object                                             |
//+------------------------------------------------------------------+
CExpert ExtExpert;
//+------------------------------------------------------------------+
//| Initialization function of the expert                            |
//+------------------------------------------------------------------+
int OnInit(void)
  {
//--- Initializing expert
   if(!ExtExpert.Init(Symbol(),Period(),Expert_EveryTick,Expert_MagicNumber))
     {
      //--- failed
      printf(__FUNCTION__+": error initializing expert");
      ExtExpert.Deinit();
      return(-1);
     }
//--- Creation of signal object
   CSignalMA *signal=new CSignalMA;
   if(signal==NULL)
     {
      //--- failed
      printf(__FUNCTION__+": error creating signal");
      ExtExpert.Deinit();
      return(-2);
     }
//--- Add signal to expert (will be deleted automatically))
   if(!ExtExpert.InitSignal(signal))
     {
      //--- failed
      printf(__FUNCTION__+": error initializing signal");
      ExtExpert.Deinit();
      return(-3);
     }
//--- Set signal parameters
   signal.PeriodMA(InpSignalMAPeriod);
   signal.Shift(InpSignalMAShift);
   signal.Method(InpSignalMAMethod);
   signal.Applied(InpSignalMAApplied);
//--- Check signal parameters
   if(!signal.ValidationSettings())
     {
      //--- failed
      printf(__FUNCTION__+": error signal parameters");
      ExtExpert.Deinit();
      return(-4);
     }
//--- Creation of trailing object
   CTrailingMA *trailing=new CTrailingMA;
   if(trailing==NULL)
     {
      //--- failed
      printf(__FUNCTION__+": error creating trailing");
      ExtExpert.Deinit();
      return(-5);
     }
//--- Add trailing to expert (will be deleted automatically))
   if(!ExtExpert.InitTrailing(trailing))
     {
      //--- failed
      printf(__FUNCTION__+": error initializing trailing");
      ExtExpert.Deinit();
      return(-6);
     }
//--- Set trailing parameters
   trailing.Period(InpTrailingMAPeriod);
   trailing.Shift(InpTrailingMAShift);
   trailing.Method(InpTrailingMAMethod);
   trailing.Applied(InpTrailingMAApplied);
//--- Check trailing parameters
   if(!trailing.ValidationSettings())
     {
      //--- failed
      printf(__FUNCTION__+": error trailing parameters");
      ExtExpert.Deinit();
      return(-7);
     }
//--- Creation of money object
   CMoneyNone *money=new CMoneyNone;
   if(money==NULL)
     {
      //--- failed
      printf(__FUNCTION__+": error creating money");
      ExtExpert.Deinit();
      return(-8);
     }
//--- Add money to expert (will be deleted automatically))
   if(!ExtExpert.InitMoney(money))
     {
      //--- failed
      printf(__FUNCTION__+": error initializing money");
      ExtExpert.Deinit();
      return(-9);
     }
//--- Set money parameters
//--- Check money parameters
   if(!money.ValidationSettings())
     {
      //--- failed
      printf(__FUNCTION__+": error money parameters");
      ExtExpert.Deinit();
      return(-10);
     }
//--- Tuning of all necessary indicators
   if(!ExtExpert.InitIndicators())
     {
      //--- failed
      printf(__FUNCTION__+": error initializing indicators");
      ExtExpert.Deinit();
      return(-11);
     }
//--- succeed
   return(INIT_SUCCEEDED);
  }
//+------------------------------------------------------------------+
//| Deinitialization function of the expert                          |
//+------------------------------------------------------------------+
void OnDeinit(const int reason)
  {
   ExtExpert.Deinit();
  }
//+------------------------------------------------------------------+
//| Function-event handler "tick"                                    |
//+------------------------------------------------------------------+
void OnTick(void)
  {
   ExtExpert.OnTick();
  }
//+------------------------------------------------------------------+
//| Function-event handler "trade"                                   |
//+------------------------------------------------------------------+
void OnTrade(void)
  {
   ExtExpert.OnTrade();
  }
//+------------------------------------------------------------------+
//| Function-event handler "timer"                                   |
//+------------------------------------------------------------------+
void OnTimer(void)
  {
   ExtExpert.OnTimer();
  }
//+------------------------------------------------------------------+
//| Code required to visualize optimization                          |
//+------------------------------------------------------------------+
//--- When debugging, if press "Stop" during optimization, next run of optimization will continue incomplete passes from stop point
//--- In order for each new optimization run to start anew, define preprocessor directive
#property tester_no_cache

//--- Define macro substitutions
#define   REPLAY_DELAY_MS      100           // Optimization replay delay in milliseconds
#define   STAT_LINES           1             // Number of optimization statistics lines displayed
#define   SELECTED_LINE_WD     3             // Thickness of line of selected optimization passage
#define   SELECTED_LINE_CLR    clrDodgerBlue // Color of line of selected optimization passage

//--- Connect code to work with the optimization results by frame viewer
#include  "FrameViewer.mqh"

//--- Declare frame viewer object
CFrameViewer fw;

//+------------------------------------------------------------------+
//| Tester function                                                  |
//+------------------------------------------------------------------+
double OnTester()
  {
//--- here insert your own function to calculate optimization criterion
   double TesterCritetia=MathAbs(TesterStatistics(STAT_SHARPE_RATIO)*TesterStatistics(STAT_PROFIT));
   TesterCritetia=TesterStatistics(STAT_PROFIT)>0?TesterCritetia:(-TesterCritetia);
//--- call at each end of testing and pass optimization criterion as parameter
   fw.OnTester(TesterCritetia);
//---
   return(TesterCritetia);
  }
//+------------------------------------------------------------------+
//| TesterInit function                                              |
//+------------------------------------------------------------------+
void OnTesterInit()
  {
//--- prepare chart for displaying balance lines
//--- STAT_LINES sets number of balance lines on chart,
//--- SELECTED_LINE_WD - sets width, SELECTED_LINE_CLR - sets color of line of selected passage
   fw.OnTesterInit(STAT_LINES, SELECTED_LINE_WD, SELECTED_LINE_CLR);
  }
//+------------------------------------------------------------------+
//| TesterDeinit function                                            |
//+------------------------------------------------------------------+
void OnTesterDeinit()
  {
//--- completing optimization
   fw.OnTesterDeinit();
  }
//+------------------------------------------------------------------+
//| TesterPass function                                              |
//+------------------------------------------------------------------+
void OnTesterPass()
  {
//--- handle test results and display graphics
   fw.OnTesterPass();
  }
//+------------------------------------------------------------------+
//|  Event handling on chart                                         |
//+------------------------------------------------------------------+
void OnChartEvent(const int id,const long &lparam,const double &dparam,const string &sparam)
  {
//--- starts playback of frames upon completion of optimization when clicking on header
   fw.OnChartEvent(id,lparam,dparam,sparam,REPLAY_DELAY_MS); // REPLAY_DELAY_MS - pause in ms between replay frames
  }
为了使可视化优化生效,必须对 EA 交易进行以下所有更改和添加(缩短变量名称除外)。
让我们编译 EA 交易并运行它进行优化。
程序本身的测试优化设置并不特别重要,可以这样设置:
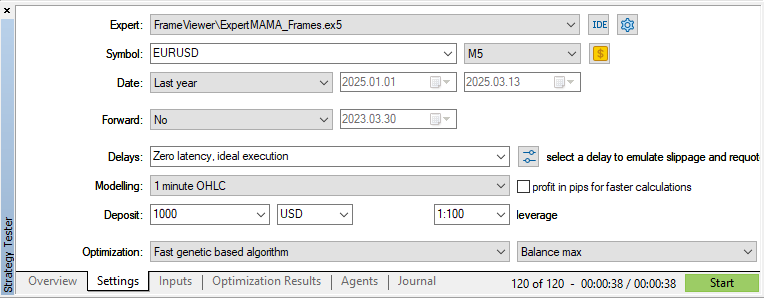
并运行优化:
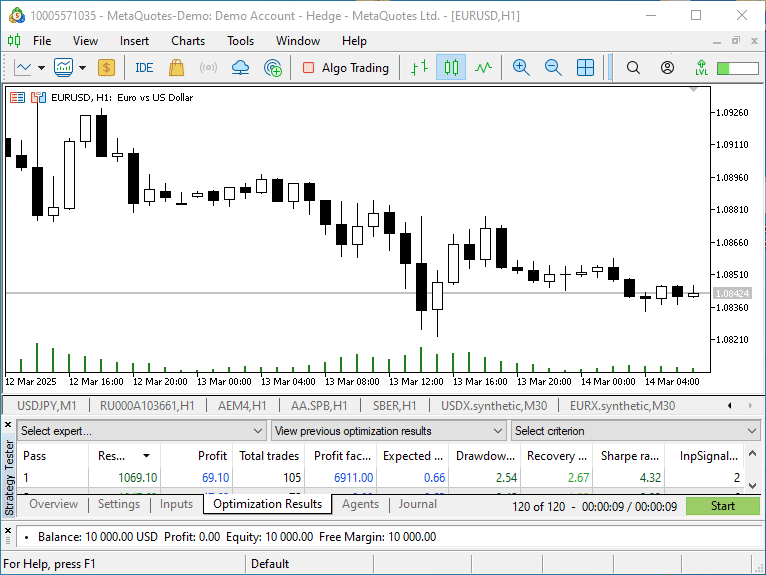
在开始优化过程之前,会打开一个新的图表窗口。所有控件都位于它的上面。这很方便,因此您不必在附带的优化结果图表和视觉优化聊天之间切换。您可以将此单独的窗口移动到终端外,或移动到第二个监视器上,同时可以访问所有优化图表。
结论
最后,我想说,我们只探讨了一个小例子,说明如何实现额外的功能来控制优化过程。在可视化优化图表上,您可以打印从测试器报告中获得的任何数据,或在每次优化通过后独立计算的数据。功能和视觉显示的内容取决于每个开发人员的品味和需求,他们使用视觉优化来实现所需的结果,并方便使用所获得的数据。在这里,在这种情况下,我们在具体的例子中讨论了如何实现和使用自己需要的一切,这一点很重要。
文章中讨论的所有文件都附在文章后面供自学。Old_article_files.zip 包含文章中的文件,今天的一切都是基于这些信息实现的。
MQL5.zip 压缩包也已附上。解压后,即可立即在终端的相应文件夹中获取已安装的测试文件。
文章中用到的程序:
| # | 名称 | 类型 | 描述 |
|---|---|---|---|
| 1 | Table.mqh | 类库 | 用于创建表格的类库 |
| 2 | Controls.mqh | 类库 | 用于创建 UI 控件的类库 |
| 3 | FrameViewer.mqh | 类库 | 用于在 EA 交易中实现可视化优化功能的类库 |
| 4 | ExpertMAMA_Frames.mq5 | EA 交易 | 测试视觉优化的 EA 交易 |
| 5 | MQL5.zip | 存档 | 上述文件打包后,需要解压到客户端终端的 MQL5 目录中。 |
| 6 | Old_article_files.zip | 存档 | 本文所有文件均基于原始文章的文件存档创建。 |
本文由MetaQuotes Ltd译自俄文
原文地址: https://www.mql5.com/ru/articles/17457
注意: MetaQuotes Ltd.将保留所有关于这些材料的权利。全部或部分复制或者转载这些材料将被禁止。
本文由网站的一位用户撰写,反映了他们的个人观点。MetaQuotes Ltd 不对所提供信息的准确性负责,也不对因使用所述解决方案、策略或建议而产生的任何后果负责。

在opt 格式公布 之后,只有在传输不在 opt 文件中的数据时才适合使用框架。
在本文的例子中,建议的图形用户界面可用于可视化 opt 文件。
opt 格式公开后,只有在传输 opt 文件以外的数据时,才适合使用帧。
在本文的例子中,建议的图形用户界面可用于可视化 opt 文件。