Transaction Speed MT5

5

O indicador destaca as zonas onde há declaração de interesse no mercado e, em seguida, mostra a zona de acumulação de ordens. Ele funciona como um livro de ofertas em escala ampliada.
Este é o indicador para o dinheiro grande. Seu desempenho é excepcional. Qualquer interesse que existir no mercado, você verá com clareza.

(Esta é uma versão totalmente reescrita e automatizada — não é mais necessário fazer análise manual.)
A Velocidade de Transação é um indicador de conceito novo que mostra onde e quando grandes ordens estão se acumulando no mercado e quais os benefícios disso.
Ele detecta mudanças de tendência em estágio muito precoce.
No Forex, o volume é erroneamente chamado de "volume", quando na verdade trata-se da variação de preço por unidade de tempo. Portanto, o nome correto é velocidade de transação.
Tudo está relacionado à forma como pensamos, agimos e analisamos. A mudança de paradigma é de importância máxima.
Este indicador redefine completamente o conceito de volume no Forex, aplicando uma lógica precisa que o transforma em uma ferramenta única e exata.

Como usar:

Por padrão, o indicador está no modo automático, permitindo que ele funcione de forma independente em qualquer período de tempo.
Se desejar trocar para o modo manual, basta clicar no botão Auto / Manual Mode.

No modo manual, todos os cálculos começam a partir de 1º de janeiro de 2025. Você pode alterar essa data como quiser para visualizar resultados diferentes.
O período ideal de dados para análise é de quatro a seis meses — dessa forma você captura múltiplos ciclos do mercado e garante uma base sólida.
Quanto maior o período, menos zonas aparecerão.

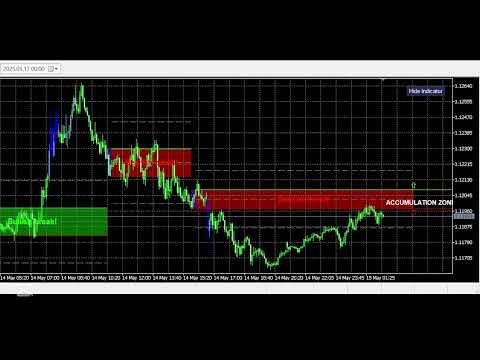
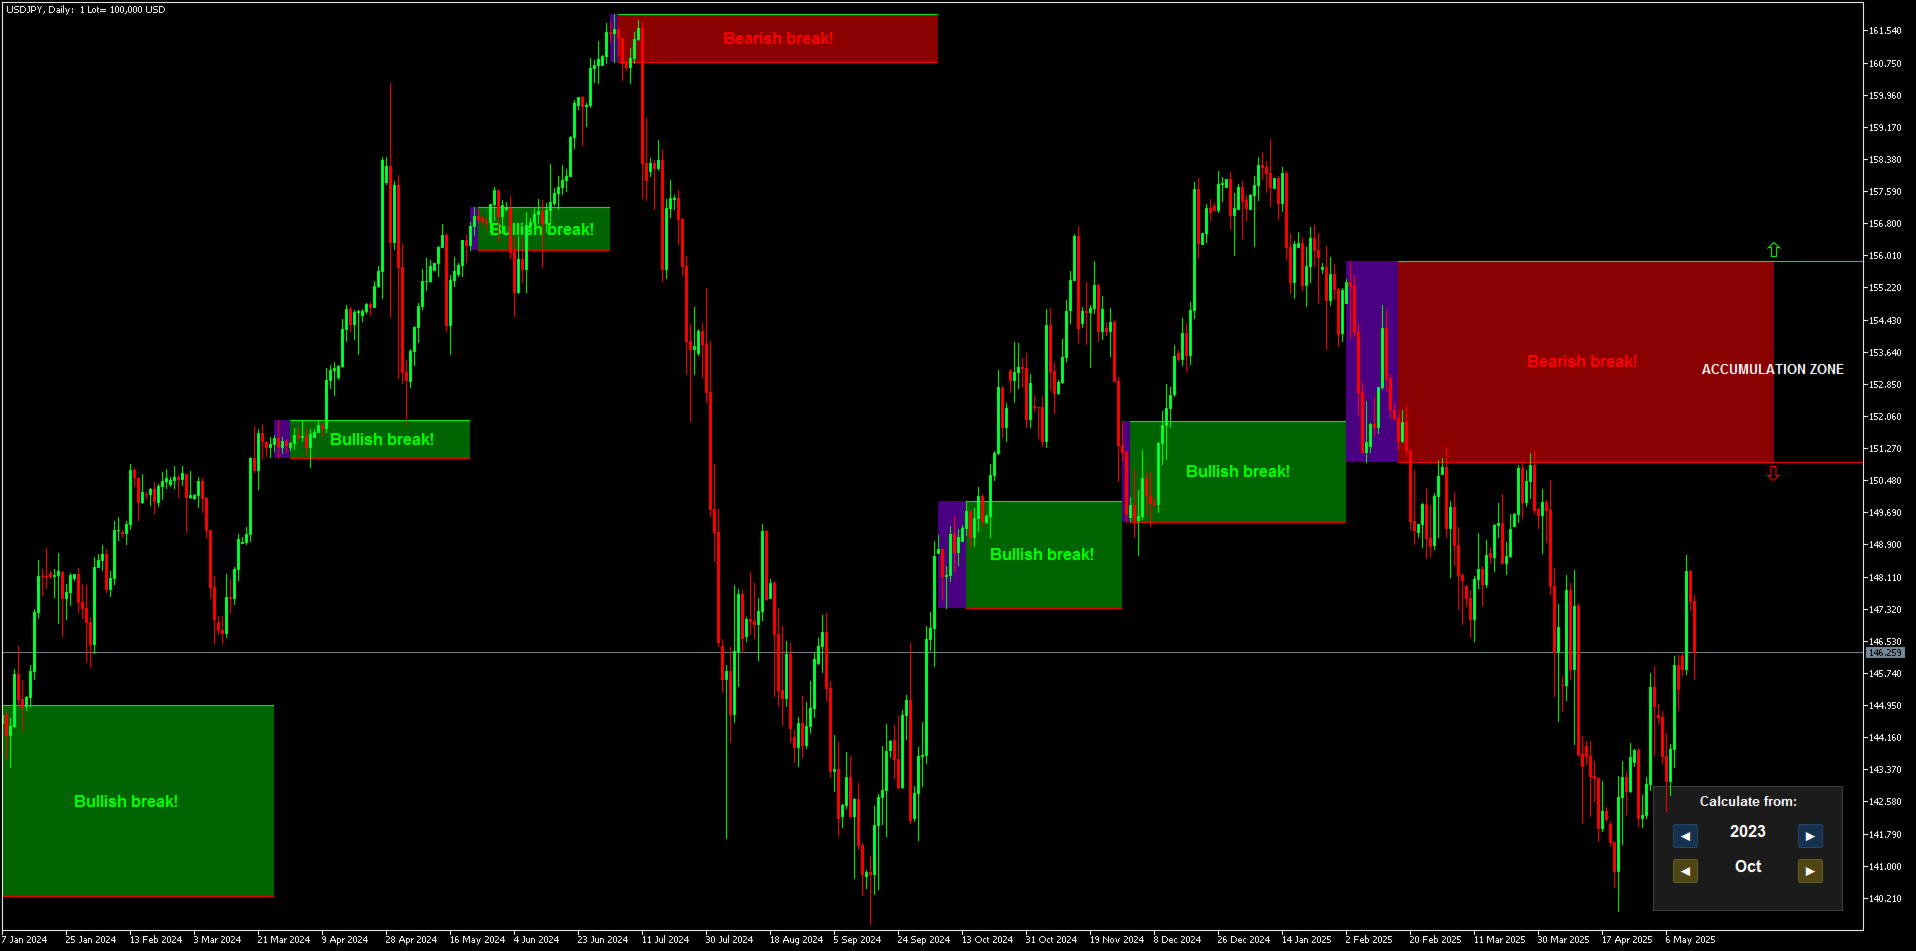
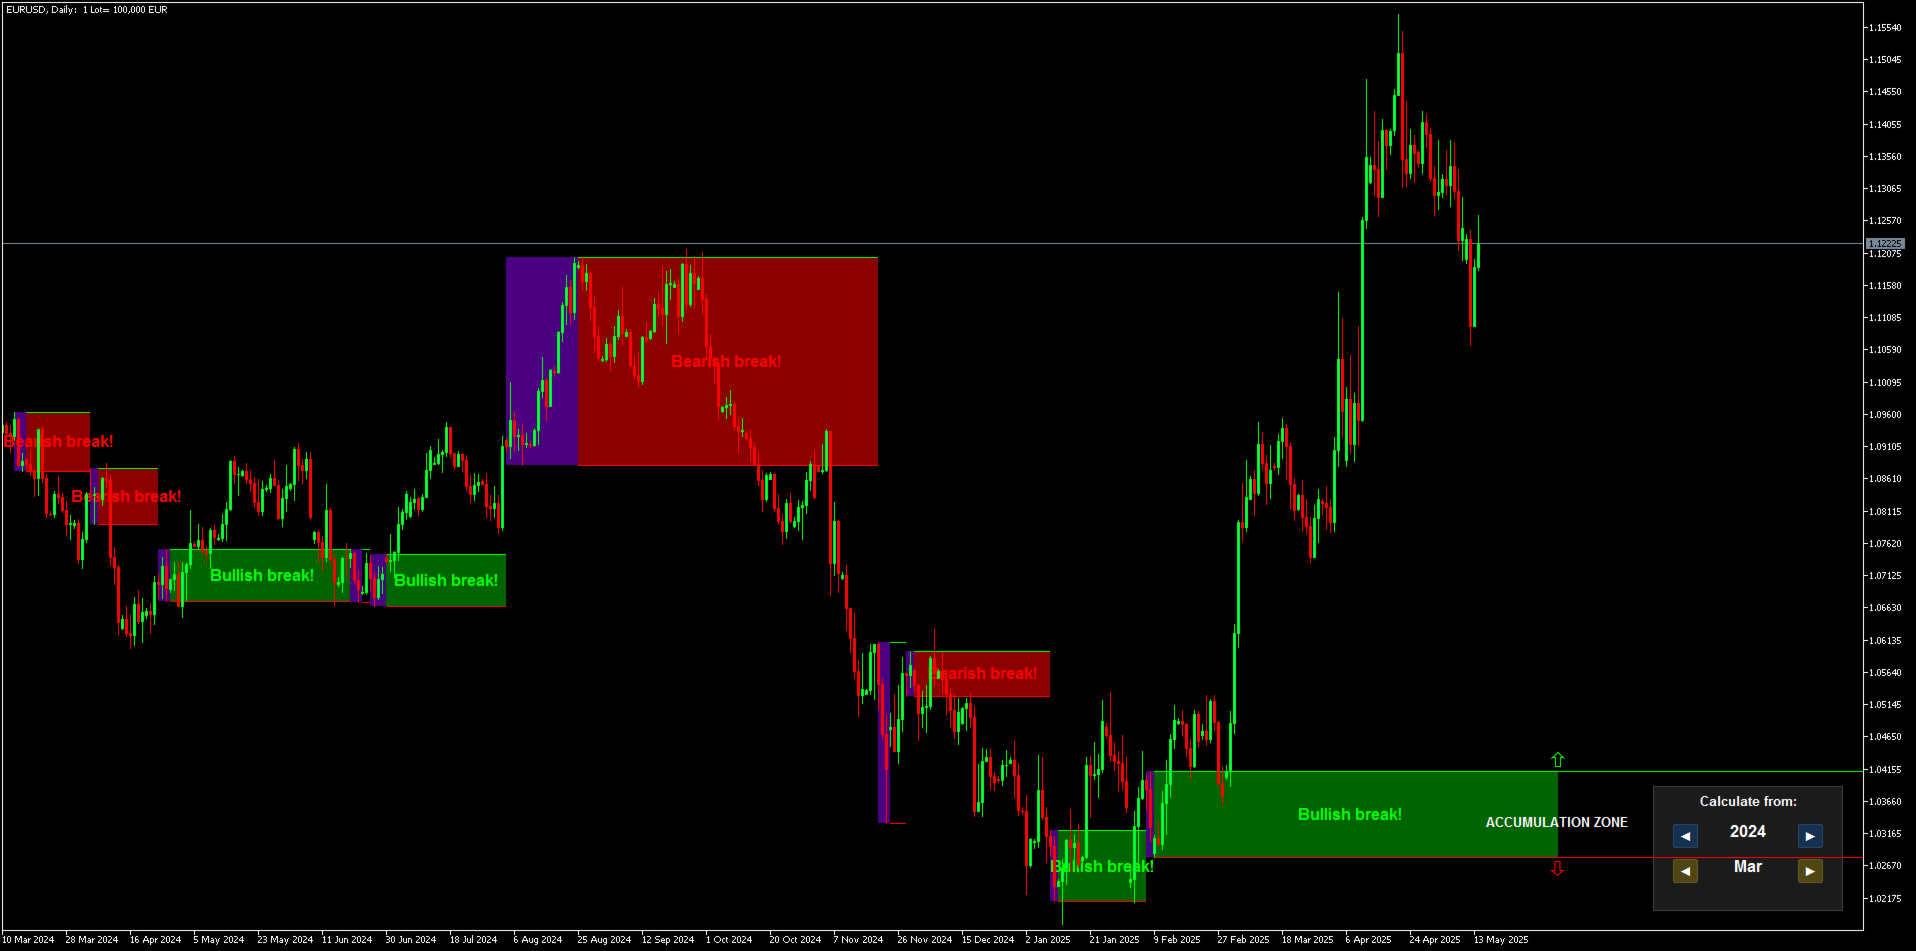
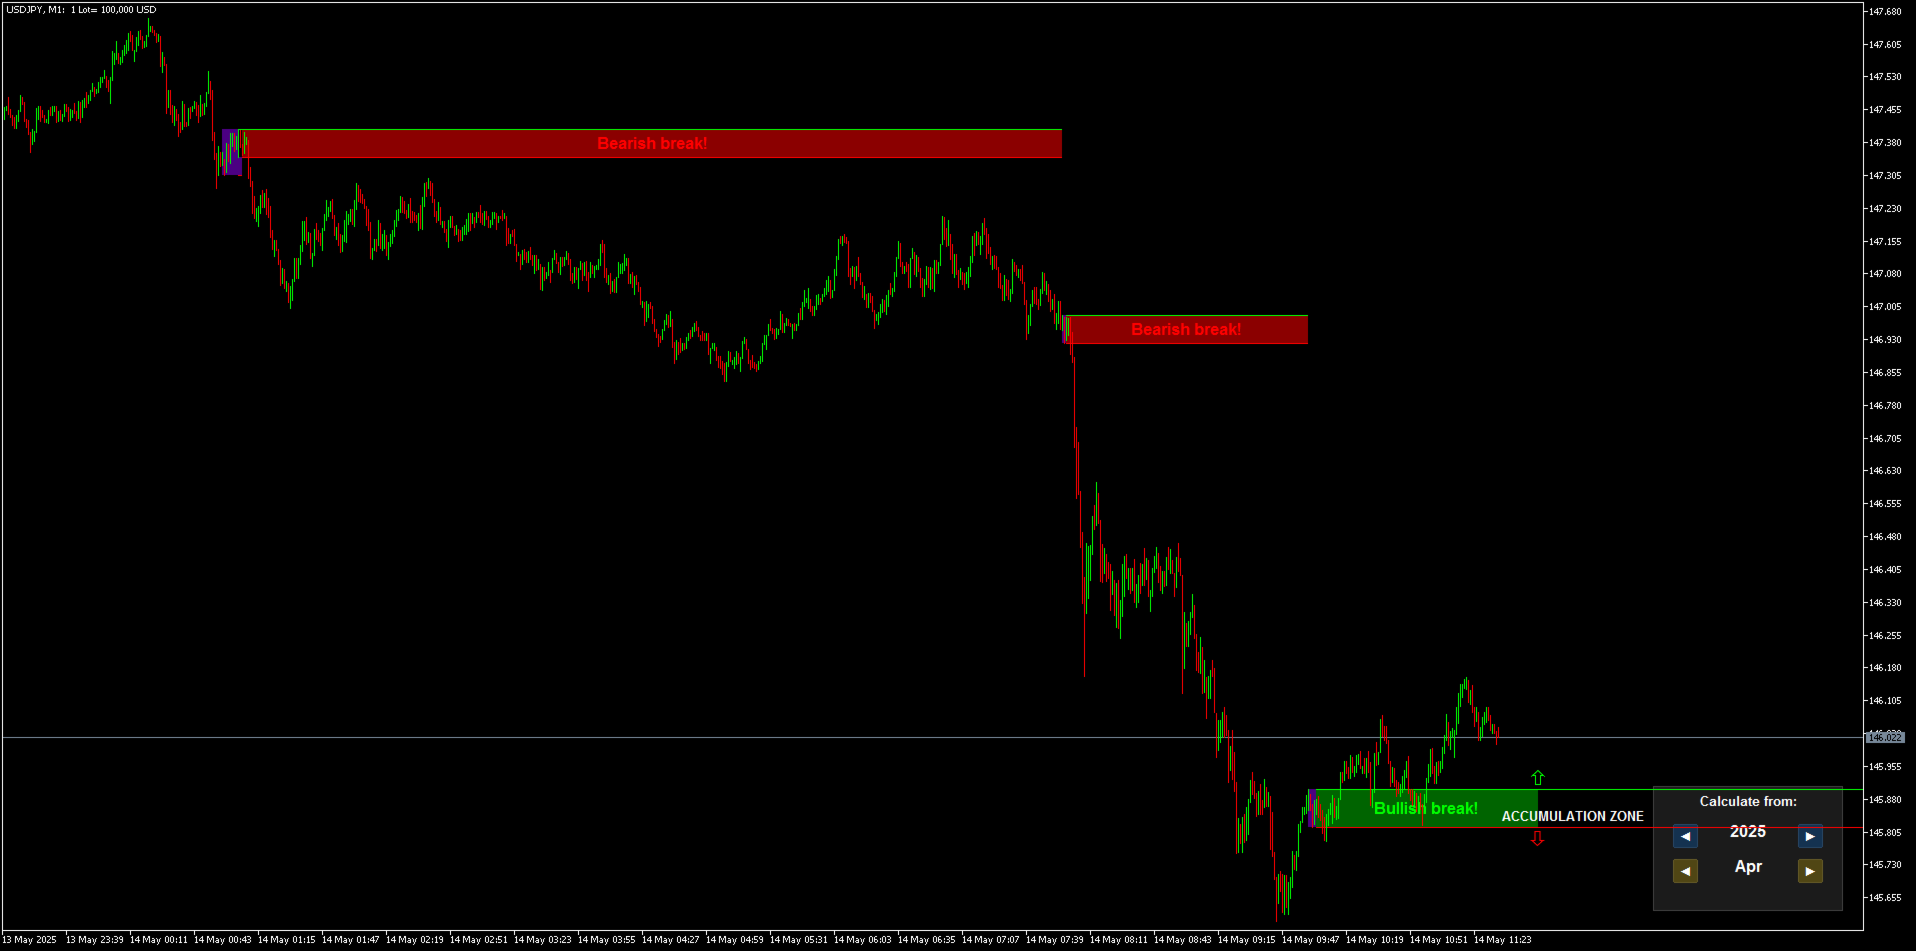
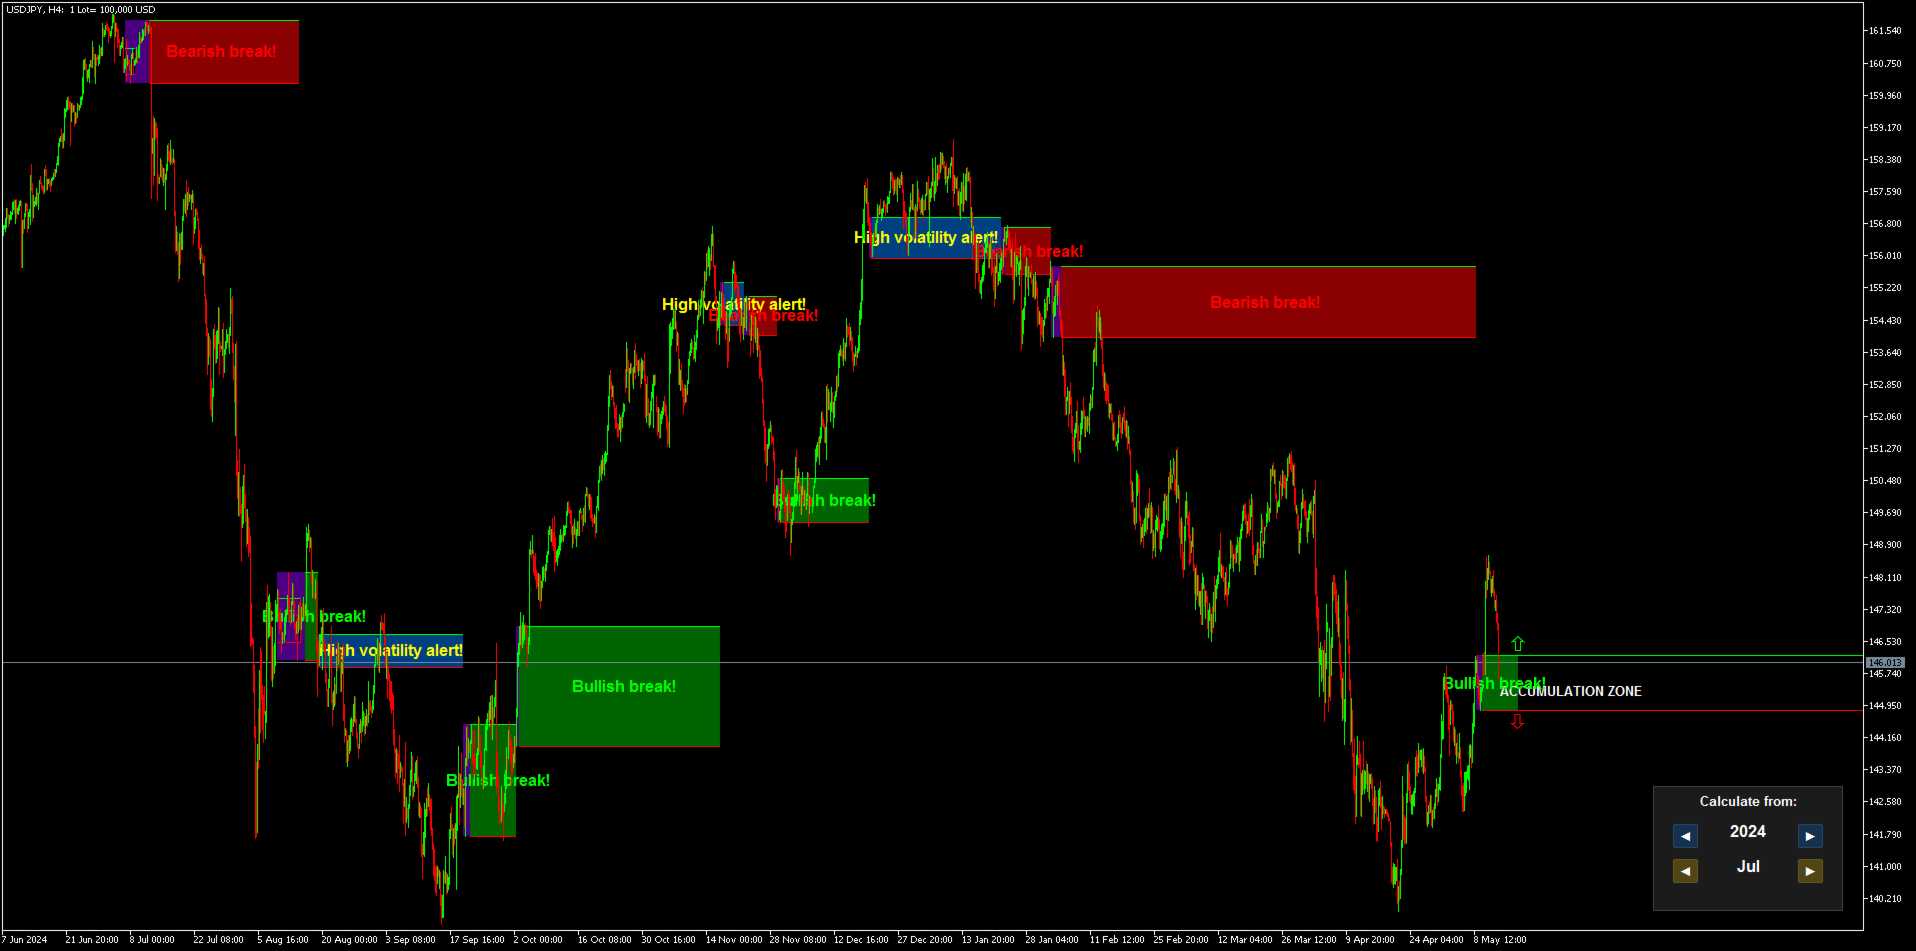
A área onde o mercado mostra interesse declarado é destacada por um retângulo roxo.
Depois disso, você verá a Zona de Acumulação de Ordens.

  • Se o mercado romper acima dessa zona, a tendência será altista, e a zona ficará verde;

  • Se romper abaixo, a tendência será baixista, e a zona ficará vermelha.

Uma vela que se fecha totalmente fora da zona, sem tocar suas bordas, é considerada um rompimento verdadeiro.

Quando um candle se forma completamente fora da zona de acumulação, isso sinaliza um rompimento e indica a direção do mercado.
A tendência permanece válida até que ocorra um rompimento na direção oposta ou uma nova zona de interesse surja no mercado.

Você pode operar de zona a zona:

Exemplo 1:
Quando há rompimento da zona de acumulação, abra ordens na direção do movimento.

Exemplo 2:
No gráfico de 4 horas, ocorre um rompimento de alta e o mercado sobe. Algum tempo depois, surge uma zona no gráfico de 1 hora. Você pode fechar a posição e esperar que a zona de 1h indique o próximo passo.

Exemplo 3:
Se você estiver dentro de uma zona, pode vender na parte superior ou comprar na inferior até que ocorra um rompimento.
Essa é uma estratégia de lateralidade, mas com risco maior.
Nunca opere contra o indicador! Nunca!

Se uma zona for rompida dos dois lados, você receberá um alerta de alta volatilidade.

Essas são as pegadas do dinheiro.
E tudo isso não pode ser visto a olho nu, pois o Forex utiliza volume por tick, que é uma das maiores ilusões do mercado.
É para isso que serve este indicador de velocidade de transação, que transforma o volume por tick em atividade real do mercado.

É uma ferramenta muito séria, feita para necessidades de análise avançada.

Recomendações:

  • Par de moedas: Somente instrumentos com alto volume por tick — EUR/USD, USD/JPY, GBP/USD etc.

  • Período de tempo: Todos

  • Depósito mínimo: Nenhum

  • Tipo de conta: Sem restrições

  • Corretoras: Sem restrições, mas corretoras maiores são recomendadas devido ao maior volume

Ciência pura.


Comentários 3
zeke21t2
336
zeke21t2 2026.02.15 13:00 
 

This is an amazing indicator that gives you a quick glimpse into the big picture, the most important aspect of trading: whether you should wait for a buying opportunity, a selling opportunity, or wait for the market to settle down. Simply avoiding false breakouts will dramatically improve your trading performance. For specific buying and selling opportunities, I highly recommend using it in conjunction with Meravith, another of the author's outstanding works. Pullback reversals and reversals from the top or bottom, which are entered based on chart highs and lows or volume changes, will become more effective. Honestly, I recommend this so much that I don't want anyone else to know about it :)

Max2233
564
Max2233 2025.07.08 10:33 
 

I would like to compliment this work of art composed by IVAN, a very precise indicator and in combination with his other jewels created by him, trading has simply become simpler and more intuitive. A round of applause to IVAN.

Mase
1739
Mase 2025.05.29 14:17 
 

Simply perfect! In combination with Ivan's other technical indicators, it is a powerful tool. Warning: highly addictive, as the indicators bring so much joy and success. Highly recommended.

Produtos recomendados
RBreaker
Zhong Long Wu
RBreaker Gold Indicators é uma estratégia de negociação intradiária de curto prazo para futuros de ouro que combina duas abordagens: o seguimento de tendência e as reversões intradiárias. Ela permite capturar lucros durante mercados em tendência e também realizar lucros oportunamente e operar na direção oposta quando o mercado se reverte. Esta estratégia foi classificada por 15 anos consecutivos entre as dez estratégias de negociação mais lucrativas pela revista americana Futures Truth. Ela pos
Este é sem dúvida o indicador de reconhecimento automático de formação de preço harmônico mais completo que você pode encontrar para a MetaTrader Platform. Ele detecta 19 padrões diferentes, leva as projeções de Fibonacci tão a sério quanto você, exibe a Zona de Reversão Potencial (PRZ) e encontra níveis adequados de stop loss e take-profit. [ Guia de instalação | Guia de atualização | Solução de problemas | FAQ | Todos os produtos ] Detecta 19 formações harmônicas de preços diferentes Traça
Owl Smart Levels MT5
Sergey Ermolov
4.03 (32)
Versão MT4  |  FAQ O Indicador Owl Smart Levels é um sistema de negociação completo dentro de um indicador que inclui ferramentas populares de análise de mercado, como fractais avançados de Bill Williams , Valable ZigZag que constrói a estrutura de onda correta do mercado e níveis de Fibonacci que marcam os níveis exatos de entrada no mercado e lugares para obter lucros. Descrição detalhada da estratégia Instruções para trabalhar com o indicador Consultor de negociação Owl Helper Chat privado d
Gartley Projections D
Oleksandr Medviediev
3 (2)
The indicator identifies the harmonic patterns (XABCD) according to developments of H.M.Gartley ( "Profits in the Stock Market" , 1935г). It projects D-point as a point in the perspective projection (specify ProjectionD_Mode = true in the settings). Does not redraw. When a bar of the working timeframe closes, if the identified pattern point has not moved during Patterns_Fractal_Bars bars, an arrow appears on the chart (in the direction of the expected price movement). From this moment on, the ar
Overview Harmonic Patterns MT5 is a technical analysis indicator designed for the MetaTrader 5 platform. It identifies and displays harmonic price patterns, such as Butterfly, Cypher, Crab, Bat, Shark, and Gartley, in both bullish and bearish directions. The indicator calculates key price levels, including entry, stop loss, and three take-profit levels, to assist traders in analyzing market movements. Visual elements and customizable alerts enhance usability on the chart. Features Detects six ha
Matreshka
Dimitr Trifonov
5 (2)
Matreshka self-testing and self-optimizing indicator: 1. Is an interpretation of the Elliott Wave Analysis Theory. 2. Based on the principle of the indicator type ZigZag, and the waves are based on the principle of interpretation of the theory of DeMark. 3. Filters waves in length and height. 4. Draws up to six levels of ZigZag at the same time, tracking waves of different orders. 5. Marks Pulsed and Recoil Waves. 6. Draws arrows to open positions 7. Draws three channels. 8. Notes support and re
MercariaPattern1-2-3 відстежує рух ціни, знаходить трьоххвильові структури 1-2-3 та підсвічує момент, коли сценарій підтверджується пробоєм ключового рівня. MercariaPattern1-2-3 tracks price movement, detects three-leg 1-2-3 structures and highlights the moment when the scenario is confirmed by a key level breakout. Індикатор збирає локальні свінги в компактну фігуру 0–1–2–3 , чекає підтвердженого пробою та будує стрілку входу з готовими рівнями SL/TP. The indicator combines local swings into a
The RSI Divergence + FVG Signal indicator combines Relative Strength Index (RSI) Divergence with Fair Value Gap (FVG) detection to generate high-probability buy and sell signals based on both momentum shifts and institutional imbalance zones. Core Features: RSI Divergence Detection : Identifies both regular and hidden bullish/bearish divergences between price and RSI. Divergences indicate potential trend reversals or continuation. FVG Zone Recognition : Detects Fair Value Gaps (imbalances caused
Noize Absorption Index - is the manual trading system that measures the difference of pressure between bears forces and bulls forces. Green line - is a noize free index that showing curent situation. Zero value of index shows totally choppy/flat market.Values above zero level shows how powerfull bullish wave is and values below zero measures bearish forces.Up arrow appears on bearish market when it's ready to reverse, dn arrow appears on weak bullish market, as a result of reverse expectation.
O nível Premium é um indicador único com mais de 80% de precisão nas previsões corretas! Este indicador foi testado pelos melhores Especialistas em Negociação por mais de dois meses! O indicador do autor você não encontrará em nenhum outro lugar! A partir das imagens você pode ver por si mesmo a precisão desta ferramenta! 1 é ótimo para negociar opções binárias com um tempo de expiração de 1 vela. 2 funciona em todos os pares de moedas, ações, commodities, criptomoedas Instruções: Assim
ATrend
Zaha Feiz
4.82 (17)
ATREND: Como Funciona e Como Usá-lo #### Como Funciona O indicador "ATREND" para a plataforma MT5 é projetado para fornecer aos traders sinais robustos de compra e venda, utilizando uma combinação de metodologias de análise técnica. Este indicador aproveita principalmente o Intervalo Verdadeiro Médio (ATR) para medir a volatilidade, juntamente com algoritmos de detecção de tendências para identificar possíveis movimentos de mercado. Deixe uma mensagem após a compra e receba um brinde especial.
"Impulses and Corrections 5" is created to help traders navigate the market situation. The indicator shows multi-time frame upward and downward "Impulses" of price movements. These impulses are the basis for determining the "Base" , which is composed of zones of corrections of price movements, as well as "Potential" zones for possible scenarios of price movement. Up and down impulses are determined based on a modified formula of Bill Williams' "Fractals" indicator. The last impulse is always "U
The indicator detects and displays М. Gartley's Butterfly pattern. The pattern is plotted by the extreme values of the ZigZag indicator (included in the resources, no need to install). After detecting the pattern, the indicator notifies of that by the pop-up window, a mobile notification and an email. The pattern and wave parameters are displayed on the screenshots. The default parameters are used for demonstration purposes only in order to increase the amount of detected patterns. Parameters z
Manyal trading system, CovEchoTrend Robot, focuses on reliability and flexibility. By employing statistical analysis methods to study the relationships between the base indicator and market patterns, the system enables a deeper understanding of market processes. Intelligent pattern analysis: The application of statistical data processing helps identify key trend reversal points more accurately, signaling significant market shifts. Informed decision-making is based on the intersection of indicato
O indicador SMC Venom Model BPR é uma ferramenta profissional para os traders que trabalham com o conceito Smart Money (SMC). Identifica automaticamente dois padrões principais no gráfico de preços: FVG   (Fair Value Gap) é uma combinação de três velas, em que existe um gap entre a primeira e a terceira velas. Forma uma zona entre níveis onde não há suporte de volume, o que geralmente leva a uma correção de preço. BPR   (Balanced Price Range) é uma combinação de dois padrões FVG que formam uma
STRICTLY FOR BOOM INDEX ONLY!!!!! Here I bring the Maximum Trend Arrows OT1.0 MT5 indicator. This indicator is made up of a combination of different trend indicators for entries and exits, for entries an orange arrow will paint on the chart below the current market and a red flag for closing of trades and it produces buy arrows only. When the orange arrow appears, it will appear along with it's sound to notify you. The 1H timeframe is recommended, don't use it anywhere else than on the 1H timefr
CosmiCLab SMC FIBO CosmiCLab SMC FIBO is a professional trading indicator designed for traders who use Smart Money Concepts (SMC), market structure analysis and Fibonacci retracement levels. The indicator automatically detects market swings and builds Fibonacci levels based on the latest impulse movement. It also identifies market structure changes such as BOS (Break of Structure) and CHOCH (Change of Character), helping traders understand the current market direction. CosmiCLab SMC FIBO also pr
Price Magnet — Price Density and Attraction Levels Indicator Price Magnet is a professional analytical tool designed to identify key support and resistance levels based on statistical Price Density. The indicator analyzes a specified historical period and detects price levels where the market spent the most time. These zones act as “magnets,” attracting price action or forming a structural base for potential reversals. Unlike traditional Volume Profile tools, Price Magnet focuses on price-time d
PREngulfing
Slobodan Manovski
PR EA - Engulfing Pattern Trading System Automated Engulfing Pattern Detection with MA Confirmation The PR EA is a Meta Trader 5 expert advisor that identifies and trades bullish/bearish engulfing candlestick patterns when confirmed by a moving average filter. Designed for swing trading on 30-minute charts with compatibility for M15 and H1 time frames. Key Features: Pattern Recognition - Detects valid bullish/bearish engulfing candle formations Trend Confirmation - 238-period SMA filter
Chỉ báo này sẽ thông báo cho bạn nếu cấu hình xu hướng thành công. Tín hiệu theo xu hướng không nên được tăng theo, nhưng tín hiệu mua ở mức giá thấp theo mô hình giao dịch thông thường của bạn, hoặc tín hiệu bán ở mức giá tốt, là một lựa chọn rất tốt. Hãy thiết lập nó trên khung thời gian lớn hơn và theo dõi các khung thời gian nhỏ hơn, bám sát các xu hướng chính. Tôi thường thiết lập ba khung thời gian gần nhau nhất và không bao giờ đi ngược tín hiệu của INdicator này. INdicator   này không có
# DRAWDOWN INDICATOR V4.0 - The Essential Tool to Master Your Trading ## Transform Your Trading with a Complete Real-Time Performance Overview In the demanding world of Forex and CFD trading, **knowing your real-time performance** isn't a luxury—it's an **absolute necessity**. The **Drawdown Indicator V4.0** is much more than a simple indicator: it's your **professional dashboard** that gives you a clear, precise, and instant view of your trading account status. --- ## Why This Indicator
The   Fibonacci Confluence Toolkit   is a technical analysis tool designed to help traders identify potential price reversal zones by combining key market signals and patterns. It highlights areas of interest where significant price action or reactions are anticipated, automatically applies Fibonacci retracement levels to outline potential pullback zones, and detects engulfing candle patterns. Its unique strength lies in its reliance solely on price patterns, eliminating the need for user-define
##   ONLY GOLD ##   Тiльки Золото ## **Mercaria Professional Trading Zones - Complete Guide** ## **Mercaria Professional Trading Zones - Повний посібник** ### **How Mercaria Zones Work / Як працюють зони Mercaria** **English:** Mercaria Zones is an advanced trading indicator that identifies high-probability support and resistance areas using ZigZag extremes combined with mathematical zone calculations. The indicator works on multiple timeframes simultaneously, providing a comprehensive view
Time And Sales Delta
Evgeny Shevtsov
5 (2)
The indicator displays the delta and the cumulative delta based on the "Time & Sales" deals list data. In addition to the standard timeframes, the indicator displays data regarding the seconds timeframes (S5, S10, S15, S20, S30) to choose from. Using the rectangle, user can select an arbitrary area in the indicator subwindow to view the ratio of the volumes of deals of buyers and sellers within this area. Indicator features: The indicator works correctly only on those trading symbols for which
Trend Forecaster
Alexey Minkov
5 (7)
The Trend Forecaster indicator utilizes a unique proprietary algorithm to determine entry points for a breakout trading strategy. The indicator identifies price clusters, analyzes price movement near levels, and provides a signal when the price breaks through a level. The Trend Forecaster indicator is suitable for all financial assets, including currencies (Forex), metals, stocks, indices, and cryptocurrencies. You can also adjust the indicator to work on any time frames, although it is recommen
Antes de tudo, vale ressaltar que esta Ferramenta de Negociação é um Indicador Não Repintante, Não Redesenhante e Não Atrasado, o que a torna ideal para negociação profissional. Curso online, manual do utilizador e demonstração. O Indicador de Conceitos de Ação de Preço Inteligente é uma ferramenta muito poderosa tanto para traders novos quanto experientes. Ele combina mais de 20 indicadores úteis em um único, combinando ideias avançadas de negociação como Análise do Trader do Círculo Interno
ENGLISH DESCRIPTION (MQL5 Standard Optimized) Product Name: Obsidian Forest Automaton AI (MT5) [Subtitle: Forest Structure | Obsidian Blade TEMA | Shield Safety] Introduction Obsidian Forest Automaton AI is a structural trend-following construct designed to navigate the market with the cold precision of an automaton. It builds a "Forest Structure" using Ichimoku Cloud , cuts through noise with the Obsidian Blade (TEMA) , and validates density with Standard Deviation . This creates a system that
Terra Infinity is a flat indicator. This improved version of the CalcFlat indicator has three additional lines that significantly increase its effectiveness. Unlike its predecessor with two static levels, Terra Infinity adds three dynamic lines above the main histogram, which are interpreted as follows: base signal line, minimum signal line, maximum signal line. These lines are formed using the additional parameter Avg, which is the average value of the histogram. Averaging produces a line cl
Divergent Stochastic Filter II Catch Reversals Early, Filter Noise, Trade with Confidence The Edge: Why This Stochastic is Different  Every trader knows the Stochastic oscillator. But knowing when to trust its signals, that's the real challenge. The Divergent Stochastic Filter II transforms this classic indicator into a precision reversal detection system by adding critical elements: divergence intelligence, signal filtering and exhaustion detection.  While standard Stochastic oscillators fire s
The  SuperTrend Advance Trading  is a widely-used technical indicator based on  SuperTrend Strategy + Price Action + EMA . How it works: -  Buy/Sell Signals  can be generated when the trend reverses, the conditions of Price action, TrendLine and EMA are met. - After the  Signal  appears, be patient and wait until the candle closes, at that time place the order as soon as possible. You may have time to review your entry, consider whether it is a good entry or not. - Carefully review the entry, up
Os compradores deste produto também adquirem
AriX
Temirlan Kdyrkhan
1 (4)
AriX Indicator for MT5 A powerful trend-following and signal-evaluation tool AriX is a custom MT5 indicator that combines Moving Averages and ATR-based risk/reward logic to generate clear buy/sell signals. It visualizes dynamic SL/TP levels, evaluates past trade outcomes, and displays win/loss statistics in a clean on-chart panel. Key features include: Buy/Sell signals based on MA crossovers ATR-based SL/TP1/TP2/TP3 levels with visual lines and labels Signal outcome tracking with real-time stat
OmniSync Projection
Antonio-alin Teculescu
5 (1)
Chronos Fractal Engine is an innovative price projection indicator for MetaTrader 5, designed to transform your technical analysis by intelligently identifying and projecting historical price patterns. Built upon an advanced correlation algorithm and the fractal principles of the market, this powerful tool visualizes potential future price movements, giving you a unique edge in your trading decisions. What is Chronos Fractal Engine? At its core, the Chronos Fractal Engine employs a sophisticat
ARIPoint
Temirlan Kdyrkhan
ARIPoint is a powerful trading companion designed to generate high-probability entry signals with dynamic TP/SL/DP levels based on volatility. Built-in performance tracking shows win/loss stats, PP1/PP2 hits, and success rates all updated live. Key Features: Buy/Sell signals with adaptive volatility bands Real-time TP/SL/DP levels based on ATR Built-in MA Filter with optional ATR/StdDev volatility Performance stats panel (Success, Profit/Loss, PP1/PP2) Alerts via popup, sound, push, or email Cu
CGE Trading Suite
Carl Gustav Johan Ekstrom
5 (1)
CGE Trading Suite delivers the analytical edge typically reserved for professional trading desks. The platform integrates a full suite of analytical tools into one seamless workflow: dynamic grid mapping, liquidity behavior analysis, ECM, trend lines, MIDAS, trade cycles, and directional channel projections. Together, these provide a unified view of market structure and momentum. Directional clarity is further enhanced by the capital flow index, which measures currency basket strength to identif
ARIScalping
Temirlan Kdyrkhan
ARIScalp is a powerful trading companion designed to generate high-probability entry signals with dynamic TP/SL/DP levels based on volatility. Built-in performance tracking shows win/loss stats, PP1/PP2 hits, and success rates all updated live. Key Features: Buy/Sell signals with adaptive volatility bands Real-time TP/SL/DP levels based on ATR Built-in MA Filter with optional ATR/StdDev volatility Performance stats panel (Success, Profit/Loss, PP1/PP2) Alerts via popup, sound, push, or email Cus
The Institutional Secret Method  represents a paradigm shift in market analysis, moving away from lagging indicators and into the realm of Topological Finance . It is engineered to decode the hidden geometry of price movement by calculating the most efficient path—the Geodesic —between current price action and institutional liquidity targets. The system views the market as a physical landscape where price is naturally drawn toward massive pools of liquidity (Stops). It uses two primary calculati
TrendMaestro5
Stefano Frisetti
note: this indicator is for METATRADER4, if you want the version for METATRADER5 this is the link:  https://www.mql5.com/it/market/product/108106 TRENDMAESTRO ver 2.5 TRENDMAESTRO recognizes a new TREND from the start, he never makes mistakes. The certainty of identifying a new TREND is priceless. DESCRIPTION TRENDMAESTRO identifies a new TREND in the bud, this indicator examines the volatility, volumes and momentum to identify the moment in which there is an explosion of one or more of these da
Rtc ML Ai Predictor
Muhammad Faisal Sagala
Rtc ML Ai | Predictor CORE MACHINE LEARNING ENGINE Adaptive ML Market Predictor – Multi-Bar Trend & Candle Forecast What This Indicator Does This indicator is a  real-time market prediction engine  designed to analyze price behavior and estimate  future market tendencies . Unlike conventional indicators, this system  does not rely on static parameters or historical curve-fitting , but adapts its internal state dynamically during live market operation. Instead of using static rules, the indic
Jita Indicator Pro MT5 | All Timeframes Professional Trend Agreement System – Premium Edition ($500) What Is Jita Indicator Pro? Jita Indicator Pro is a structured trend-confirmation system designed for serious traders who value precision, alignment, and controlled signal behavior. It combines: Advanced band-based trend direction logic ATR-driven structural trigger engine Dual-confirmation agreement system Locked history update design This indicator prints signals only when multiple conditions
Recommended TimeFrame >= H1. 100% Non Repainted at any moment.  Use it carefully, only with Trend Direction. Trading Usage: 2 Variants: as Range System or as BreakOut System (Both Only With Trend Direction)::: (Always use StopLoss for minimise Risk); [1] as Range System: (Recommended) in UP TREND:  - BUY in Blue Line , then if price goes down by 50 points (on H1) open Second BUY.   Close in any Profit you wish: TrailingStop(45 points) or Close when Price touches upper Gold Line. in DOWN TREND
Max Ribbon Mt5
Stefano Frisetti
WARNING: This indicator is distributed EXCLUSIVELY on MQL5.com MT4 version:   https://www.mql5.com/it/market/product/160363 MT5 version:   https://www.mql5.com/it/market/product/160410 ============================================================================================= MAX RIBBON ver 1.00 The indicator that shows you the TREND clearly and unambiguously! ============================================================================================= DESCRIPTION MAX RIBBON is an advanced tre
IVISTscalp5
Vadym Zhukovskyi
5 (6)
Apresentamos a você o indicador iVISTscalp5, que não é apenas único, mas também eficaz em operações de negociação. Este indicador é baseado em dados de tempo e é o resultado de muitos anos de experiência e análise aprofundada dos mercados financeiros. O indicador iVISTscalp5 é uma excelente ferramenta para negociação manual. Conveniência, simplicidade e visualização - toda a complexidade está escondida dentro dele. Simplificamos as configurações e o uso do indicador iVISTscalp5 ao máximo. O indi
+++++++++++++++++++++++++++++++++++++++++++++++++++++++++++++++++++++++++++++++++++++++++++++++++ +++ Link to EURUSD Only Free Version -->  https://www.mql5.com/en/market/product/156904?source=Unknown +++++++++++++++++++++++++++++++++++++++++++++++++++++++++++++++++++++++++++++++++++++++++++++++++ Hallo Trader, This is a traditional GANN & FIBONACCI strategy based on detection of an impulsive move in the opposite direction. This is called a Breakout. At the moment of Breakout, the indicator draw
Big Player Range
Thalles Nascimento De Carvalho
5 (3)
BigPlayerRange — Melhor Indicador para Mini Índice e Mini Dólar | MT5 Descubra o poder do BigPlayerRange , considerado o melhor indicador para mini índice e mini dólar no MetaTrader 5. Esta ferramenta essencial destaca zonas estratégicas de atuação dos grandes players, proporcionando análise técnica institucional com altíssima precisão. Como Funciona na Prática: O BigPlayerRange desenha duas faixas horizontais baseadas em volume institucional: Faixa Verde — Região onde compradores instit
Frontier Pivots
Nestor Jose Mendez Boza
FRONTIER PIVOTS - Geometric Levels Indicator This indicator plots support and resistance levels/ranges on the chart using mathematical calculations. It helps traders identify potential price reaction zones based on geometric patterns. Main Features: Automatically calculates and displays key price levels Plots both support and resistance lines Uses daily price data for level calculation Clean visual presentation with different colors for different level types No repainting - levels remain static
Pantera Indicator
Temirlan Kdyrkhan
5 (1)
A tool for on-chart strategy backtesting and performance analysis. A utility for developing, debugging, and testing custom trading ideas and indicator functions. An indicator designed to quickly test trading concepts and visualize the effectiveness of different input parameters. An all-in-one sandbox for testing everything from simple crossovers to complex, multi-condition trading systems.
VTrende Pro
Andrii Diachenko
5 (1)
VTrende Pro - MTF indicator for trend trading with a display panel for MT5 *** Videos can be translated into any language using subtitles (video language - Russian) Although the signals of the VTrende Pro indicator can be used as signals of a full-fledged trading system, it is recommended to use them in conjunction with the Bill Williams TS. VTrende Pro is an extended version of the VTrende indicator. Difference between Pro version and VTrende: - Time zones - Signal V - signal 1-2 waves -    S
FXLAND Smart Reversal Indicator (MT5) FXLAND Smart Reversal Indicator is a professional technical analysis tool designed to help traders identify potential price reversal zones and key market turning points with clarity and precision. The best reversal indicator and price return by choosing only one ceiling or floor in each time frame A masterpiece of combining mathematics and Gann, fractal matrix, Fibonacci, movement angle and time. Completely intelligent Key Features Detects potenti
WanaScalper
Isaac Wanasolo
1 (1)
A scalping indicator based on mathematical patterns, which on average gives signals with relatively small SL, and also occasionally helps to catch big moves in the markets (more information in the video) This indicator has three main types of notifications: The first type warns of a possible/upcoming signal on the next bar The second type indicates the presence of a ready signal to enter the market/open a position The third type is for SL and TP levels - you will be notified every time price re
The Expert Advisor and the video are attached in the Discussion tab . The robot applies only one order and strictly follows the signals to evaluate the indicator efficiency. Pan PrizMA CD Phase is an option based on the Pan PrizMA indicator. Details (in Russian). Averaging by a quadric-quartic polynomial increases the smoothness of lines, adds momentum and rhythm. Extrapolation by the sinusoid function near a constant allows adjusting the delay or lead of signals. The value of the phase - wave s
Классификатор силы тренда. Показания на истории не меняет. Изменяется классификация только незакрытого бара. По идее подобен полной системе ASCTrend, сигнальный модуль которой, точнее его аппроксимация в несколько "урезанном" виде, есть в свободном доступе, а также в терминале как сигнальный индикатор SilverTrend . Точной копией системы ASCTrend не является. Работает на всех инструментах и всех временных диапазонах. Индикатор использует несколько некоррелируемых между собой алгоритмов для класси
FFx Universal Strength Meter PRO is more than a basic strength meter. Instead of limiting the calculation to price, it can be based on any of the 19 integrated strength modes + 9 timeframes. With the FFx USM, you are able to define any period for any combination of timeframes. For example, you can set the dashboard for the last 10 candles for M15-H1-H4… Full flexibility! Very easy to interpret... It gives a great idea about which currency is weak and which is strong, so you can find the best pai
The FFx Universal MTF alerter shows on a single chart all the timeframes (M1 to Monthly) with their own status for the chosen indicator. 9 indicators mode (MACD-RSI-Stochastic-MA-ADX-Ichimoku-Candles-CCI-PSAR). Each can be applied multiple times on the same chart with different settings. Very easy to interpret. Confirm your BUY entries when most of the timeframes are showing green color. And confirm your SELL entries when most of the timeframes are showing red color. 2 Alert Options : input to s
The FFx Watcher PRO is a dashboard displaying on a single chart the current direction of up to 15 standard indicators and up to 21 timeframes. It has 2 different modes: Watcher mode: Multi Indicators User is able to select up to 15 indicators to be displayed User is able to select up to 21 timeframes to be displayed Watcher mode: Multi Pairs User is able to select any number of pairs/symbols User is able to select up to 21 timeframes to be displayed This mode uses one of the standard indicators
FFx Patterns Alerter gives trade suggestions with Entry, Target 1, Target 2 and StopLoss .... for any of the selected patterns (PinBar, Engulfing, InsideBar, OutsideBar) Below are the different options available: Multiple instances can be applied on the same chart to monitor different patterns Entry suggestion - pips to be added over the break for the entry 3 different options to calculate the SL - by pips, by ATR multiplier or at the pattern High/Low 3 different options to calculate the 2 TPs -
MetaTrader 4 version available here : https://www.mql5.com/en/market/product/24881 FFx Basket Scanner is a global tool scanning all pairs and all timeframes over up to five indicators among the 16 available. You will clearly see which currencies to avoid trading and which ones to focus on. Once a currency goes into an extreme zone (e.g. 20/80%), you can trade the whole basket with great confidence. Another way to use it is to look at two currencies (weak vs strong) to find the best single pairs
MetaTrader 4 version available here: https://www.mql5.com/en/market/product/25793 FFx Pivot SR Suite PRO is a complete suite for support and resistance levels. Support and Resistance are the most used levels in all kinds of trading. Can be used to find reversal trend, to set targets and stop, etc. The indicator is fully flexible directly from the chart 4 periods to choose for the calculation: 4Hours, Daily, Weekly and Monthly 4 formulas to choose for the calculation: Classic, Camarilla, Fibonac
ClassicSBA
Umri Azkia Zulkarnaen
this indicator very simple and easy if you understand and agree with setup and rule basic teknical sba you can cek in link : please cek my youtube channel for detail chanel : an for detail info  contact me  basicly setup buy (long) for this indicator is Magenta- blue and green candle or magenta - green  and green candlestik and for setup sell (short) is Black - yellow - and red candle or black - red  and red candlestik
Pendiente de Precio
Cesar Juan Flores Navarro
Indicador en base a la pendiente de la linea de precio, dibuja una línea de color cuando sube a base de los precios que previamente has sido procesados o linealizados, y cuando baja la pendiente la linea linealizada toma otro color. En este caso se a considerado 6 lineas de diferentes procesos desde pendientes largas hacia las cortas, observándose que cuando coincidan las pendientes se produce un máximo o mínimo, lo que a simple vista nos permitirá hacer una COMPRA O VENTA.
Индикатор Coefficient Of Determination (COD) представляет собой значение коэффициента детерминации или квадрат коэффициента корреляции между зависимой переменной — ценой и объясняющей переменной — тиковым объемом. Что это дает нам на практике? COD отлично распознает кульминацию трендовых движений, что позволяет подбирать оптимальные точки и ловить развороты рынка. Как использовать индикатор: Наиболее популярная торговая стратегия строится совместно с трендовым индикатором Moving Average (MA), пе
Mais do autor
RSI Divergence Pulse é um indicador abrangente de RSI que combina detecção de divergências, análise multi-timeframe e ferramentas visuais em um único aplicativo leve. Ele identifica automaticamente divergências Regulares e Ocultas, exibe um painel RSI Multi-Timeframe ao vivo, preenche zonas OB/OS para reconhecimento visual, desenha linhas de divergência tanto no gráfico de preços quanto na sub-janela RSI, coloca setas Buy/Sell e fornece alertas em tempo real. Features Color-Coded RSI Line A lin
Meravith
Ivan Stefanov
5 (3)
Ferramenta dos market makers. O Meravith irá: Analisar todos os timeframes e exibir a tendência atual em vigor. Destacar zonas de liquidez (equilíbrio de volume) onde o volume comprador e vendedor é igual. Mostrar todos os níveis de liquidez de diferentes timeframes diretamente no seu gráfico. Gerar e apresentar análise de mercado em formato de texto para sua referência. Calcular alvos, níveis de suporte e pontos de stop-loss com base na tendência atual. Calcular a relação risco/retorno das sua
MACD divergency
Ivan Stefanov
4.5 (6)
Este indicador identifica com precisão as divergências altistas e baixistas entre os movimentos de preço e o histograma MACD, usando períodos de Médias Móveis Exponenciais (EMA) de 5 (rápido), 34 (lento) e um período de linha de sinal de 5. O indicador destaca os pontos onde o momentum enfraquece, sinalizando possíveis reversões de tendência. Regras para identificação correta de divergências: A divergência altista é válida quando o preço forma mínimas mais baixas e o histograma MACD simultaneame
FREE
O MERAVITH SCANNER é um indicador profissional de mercados financeiros para MetaTrader 5 que consolida várias ferramentas analíticas em um único sistema integrado. Ele realiza todos os cálculos automaticamente usando uma metodologia proprietária de preço médio ponderado por volume (VWAP), eliminando completamente a interpretação subjetiva. O indicador funciona em todas as classes de ativos (Forex, Ações, Índices, Commodities, Criptomoedas) e em todos os prazos, de M1 a Mensal. O princípio fundam
Horizont
Ivan Stefanov
Horizont é um sistema de trading que fornece uma configuração completa de negociação: ponto de entrada, alvo 1, alvo 2 e stop loss, tudo calculado automaticamente. O sistema identifica automaticamente os topos e fundos do mercado e os conecta para definir a tendência atual. Você seleciona qual tendência negociar e o Horizont gera os níveis correspondentes de entrada, alvos e stop. O sistema inclui gestão automática de risco. Ele verifica o saldo da sua conta, calcula o risco e sugere o tamanho d
Este indicador é uma ferramenta interativa de marcação das Ondas de Elliott para MetaTrader 4 e 5. Ele permite que o usuário coloque manualmente rótulos de ondas diretamente no gráfico, selecionando o tamanho do rótulo, a cor e o tipo de onda (correções ABC, impulsos de cinco ondas ou estruturas WXY) a partir de um menu no próprio gráfico. Com um único clique no gráfico, o indicador posiciona sequencialmente os rótulos de ondas apropriados no preço e no tempo escolhidos, ajudando os traders a vi
FREE
Meravith AUTO
Ivan Stefanov
5 (1)
Meravith Auto é uma versão automatizada do sistema de trading Meravith. O indicador consiste em uma linha de tendência que muda de cor. Quando é altista, é verde, e quando é baixista, é vermelha. Esta é a linha de suporte da tendência. Uma linha de liquidez, onde o volume altista é igual ao volume baixista. Uma linha de desvio altista triplo. Uma linha de desvio baixista triplo. Pontos roxos e azuis que indicam alto volume. O ponto roxo indica um volume superior à média em duas desvios, e o azul
Oscilador de momentum avançado que ajusta automaticamente o seu período com base na volatilidade do mercado para sinais de sobrecompra e sobrevenda mais precisos. Como funciona O indicador utiliza um cálculo de período adaptativo que encurta durante alta volatilidade e alonga durante baixa volatilidade. Esse ajuste dinâmico fornece sinais mais rápidos quando o mercado está em tendência e reduz sinais falsos em condições laterais. O valor do RSI é calculado com base nesse período variável, torna
FREE
Meravith Auto é uma versão automatizada do sistema de trading Meravith. O indicador consiste em uma linha de tendência que muda de cor. Quando é altista, é verde, e quando é baixista, é vermelha. Esta é a linha de suporte da tendência. Uma linha de liquidez, onde o volume altista é igual ao volume baixista. Uma linha de desvio altista triplo. Uma linha de desvio baixista triplo. Pontos roxos e azuis que indicam alto volume. O ponto roxo indica um volume superior à média em duas desvios, e o azul
Este indicador é uma ferramenta interativa de marcação das Ondas de Elliott para MetaTrader 4 e 5. Ele permite que o usuário coloque manualmente rótulos de ondas diretamente no gráfico, selecionando o tamanho do rótulo, a cor e o tipo de onda (correções ABC, impulsos de cinco ondas ou estruturas WXY) a partir de um menu no próprio gráfico. Com um único clique no gráfico, o indicador posiciona sequencialmente os rótulos de ondas apropriados no preço e no tempo escolhidos, ajudando os traders a vi
FREE
Imbalance Pro
Ivan Stefanov
5 (4)
O indicador mede o desequilíbrio entre os touros e os ursos durante um período escolhido e mostra uma linha reta entre os dois pontos. Se os touros tiverem mais volume do que os ursos, a linha fica verde.  Se os ursos tiverem mais volume, a linha fica vermelha. A linha também mostra a diferença percentual no volume. O indicador mostra os mesmos dados numa janela separada. Também é possível ver o volume dividido. O indicador tem dois modos. Para este efeito, existe um botão no canto superio
Ferramenta dos market makers. O Meravith irá: Analisar todos os timeframes e exibir a tendência atual em vigor. Destacar zonas de liquidez (equilíbrio de volume) onde o volume comprador e vendedor é igual. Mostrar todos os níveis de liquidez de diferentes timeframes diretamente no seu gráfico. Gerar e apresentar análise de mercado em formato de texto para sua referência. Calcular alvos, níveis de suporte e pontos de stop-loss com base na tendência atual. Calcular a relação risco/retorno das suas
Um dos poucos indicadores que calcula níveis exclusivamente com base no preço. O indicador não é afetado por timeframes, tendências ou ciclos de mercado. Um dos indicadores mais lógicos já criados. O indicador FIFTY agora está disponível em uma versão automatizada, eliminando a necessidade de desenhar níveis manualmente. Esta versão traça automaticamente os níveis diários, semanais, mensais e anuais no gráfico, garantindo precisão e economia de tempo. Além disso, botões estão disponíveis para al
Naturu
Ivan Stefanov
5 (1)
“Naturu” é um indicador manual que usa a simetria da natureza como seu algoritmo. Domine o mercado com uma estratégia simples e sabedoria oculta! Ao carregar o indicador, você verá duas linhas: Superior (Top) e Inferior (Bottom). Clique uma vez em uma linha para ativá-la. Para movê-la, basta clicar na vela onde deseja posicioná-la. Você define um ponto alto e um ponto baixo, e o indicador calcula automaticamente: Uma zona magenta que mostra onde os interesses de touros e ursos estão mais próximo
Sense
Ivan Stefanov
5 (2)
O SENSE é um sistema automatizado que combina métodos GANN selecionados com cálculos fractais. O sistema diz-nos onde abrir e fechar as transacções. Já não precisa de perder tempo com cálculos complexos - o SENSE faz tudo por si. Basta instalar o indicador. Princípios básicos: O mercado está em alta quando o preço está acima das linhas brancas Comprar acima das linhas brancas, parar abaixo As linhas verdes são objectivos de subida O mercado está em baixa quando o preço está abaixo das linhas
Separated Volume
Ivan Stefanov
5 (1)
Este indicador separa efetivamente o volume de ticks no mercado forex em categorias de alta e de baixa. Além disso, ele fornece a funcionalidade para calcular e exibir a soma dos volumes de ticks de alta e de baixa para qualquer período selecionado de sua escolha. Pode ajustar facilmente o período movendo as duas linhas azuis no gráfico, permitindo uma análise de volume personalizável e precisa, adaptada às suas necessidades de negociação. Se achar útil, as suas opiniões serão apreciadas! B
FREE
Two Snakes
Ivan Stefanov
5 (1)
2 SNAKES é um sistema de escalpelamento de primeira classe. Como as entradas são bastante precisas, é provável que você se torne viciado nesse sistema muito rapidamente.  Você tem 2 cobras. Quando você vê uma vela acima ou abaixo delas que não as toca, esse é o seu sinal de escalpelamento. Se você usar um período de tempo maior, o scalping pode se tornar um acompanhamento de tendência. As snakes são calculadas precisamente em relação ao estado atual do mercado. Elas NÃO SÃO médias móveis.
Enigmera
Ivan Stefanov
5 (8)
ENIGMERA: O núcleo do mercado Importante: A demonstração do MQL5.com funciona no Strategy Tester e pode não refletir completamente a funcionalidade do Enigmera. Verifique a descrição, as capturas de tela e o vídeo para mais detalhes. Fique à vontade para me enviar uma mensagem com qualquer dúvida! O código do indicador foi completamente reescrito. A versão 3.0 adiciona novas funcionalidades e corrige erros acumulados desde o início do indicador. Introdução Este indicador e sistema de negociação
Levelss
Ivan Stefanov
5 (1)
O indicador LEVELSS mostra: - Zona diária de alta e de baixa. É visível todos os dias das 00:00 às 23:59.  - A zona semanal de alta e baixa. É visível de segunda-feira 0:00 a sexta-feira 23:59 todas as semanas. - Canal especialmente calculado a partir de um período de tempo específico que é exibido em todos os outros períodos de tempo. Por defeito, este é o período de 4 horas que pode ser alterado para qualquer outro período de tempo que deseje negociar. É calculado sem parar. No canto superi
GANN Master
Ivan Stefanov
5 (1)
Os alvos precisos de GANN são calculados com base em seus métodos testados pelo tempo e apresentados bem à sua frente. Esta ferramenta foi projetada para tornar a negociação mais fácil e intuitiva. Ao mover a linha branca para cima ou a linha verde para baixo, você verá imediatamente por que as técnicas de GANN continuam a ser influentes no mundo do trading. As estratégias de GANN se concentram em prever movimentos de mercado com alta precisão, e esta ferramenta traz esse poder para suas mãos
Stefanov
Ivan Stefanov
The indicator displays support and resistance zones defined logically using the MACD. The entire concept is explained in the video, with specific examples shown. The indicator works on any instruments and timeframes. It does not repaint. After placing it on the chart, please go through all the timeframes sequentially, from monthly to 1-minute, so that all lines load correctly. After that, you can start using it. The concept is unique and has not been seen in other systems or indicators.
Fifty Pro
Ivan Stefanov
5 (1)
O indicador FIFTY agora está disponível em uma versão automatizada, eliminando a necessidade de desenhar os níveis manualmente. Esta versão traça automaticamente os níveis diários, semanais, mensais e anuais no gráfico, garantindo precisão e economizando tempo. Além disso, há botões para alternar a visibilidade desses níveis, permitindo total personalização. Para aqueles que preferem, a versão gratuita do indicador continua disponível e totalmente funcional, permitindo que os traders escolham en
“Naturu” é um indicador manual que usa a simetria da natureza como seu algoritmo. Domine o mercado com uma estratégia simples e sabedoria oculta! Ao carregar o indicador, você verá duas linhas: Superior (Top) e Inferior (Bottom). Clique uma vez em uma linha para ativá-la. Para movê-la, basta clicar na vela onde deseja posicioná-la. Você define um ponto alto e um ponto baixo, e o indicador calcula automaticamente: Uma zona magenta que mostra onde os interesses de touros e ursos estão mais próximo
MACD Divergence Pulse — Escâner inteligente de divergências com histograma de 4 cores, alertas e painel de controle. DESCRIÇÃO CURTA  Indicador profissional de MACD com detecção automática de divergências regulares e ocultas, histograma dinâmico de 4 cores, setas Buy/Sell, rótulos de sinais, painel em tempo real e alertas multicanal. Funciona em qualquer símbolo e timeframe. DESCRIÇÃO COMPLETA
RSI Divergence Pulse — Smart Divergence Scanner with MTF Panel, Zone Fill, Alerts & Dashboard SHORT DESCRIPTION Professional RSI indicator with automatic Regular & Hidden divergence detection, color-coded RSI line, Multi-Timeframe panel, OB/OS zone fills, Buy/Sell arrows, signal labels, real-time dashboard, and multi-channel alerts. Works on any symbol and timeframe. FULL DESCRIPTION
Enigmera MT5
Ivan Stefanov
3.67 (3)
ENIGMERA: O núcleo do mercado (Este é um indicador manual e contém funções que podem não ser compatíveis com o ambiente atual de testes do MetaTrader) Introdução Este indicador e sistema de trading representam uma abordagem única aos mercados financeiros. ENIGMERA utiliza ciclos fractais para calcular com precisão os níveis de suporte e resistência. Mostra a fase autêntica de acumulação e fornece direção e objetivos. É um sistema que funciona tanto em tendência quanto em correção. Como funciona
Níveis lendários de William Gann em um indicador MT5 totalmente automatizado. O GANN Master identifica zonas-chave onde o preço tem maior probabilidade de reverter ou continuar sua tendência, com base em dados diários, semanais e mensais. Recursos principais: Botões de período com um clique: clique em Daily, Weekly ou Monthly para traçar instantaneamente as zonas do dia, da semana ou do mês atuais Modos Automático e Manual • Automático: o GANN Master calcula todos os níveis para você, sem neces
SPEKULATOR é um sistema de trading manual e um indicador que ajuda você a identificar zonas-chave de suporte e a direção do mercado. Domine o mercado com uma estratégia simples e sabedoria oculta. Você escolhe qualquer topo (TOP) e fundo (BOTTOM) no gráfico, e o indicador desenha: Uma zona de suporte para a sua tendência. Para uma tendência de alta, aparece uma zona verde; para uma tendência de baixa, uma zona vermelha. A sensibilidade da zona de suporte pode ser ajustada nas configurações do in
MACD Divergence Pulse — Escáner inteligente de divergencias con histograma de 4 colores, alertas y panel de control. DESCRIPCIÓN CORTA  Indicador profesional de MACD con detección automática de divergencias regulares y ocultas, histograma dinámico de 4 colores, flechas Buy/Sell, etiquetas de señales, panel en tiempo real y alertas multicanal. Funciona en cualquier símbolo y temporalidad. DESCRIPCIÓN COMPLETA
Filtro:
zeke21t2
336
zeke21t2 2026.02.15 13:00 
 

This is an amazing indicator that gives you a quick glimpse into the big picture, the most important aspect of trading: whether you should wait for a buying opportunity, a selling opportunity, or wait for the market to settle down. Simply avoiding false breakouts will dramatically improve your trading performance. For specific buying and selling opportunities, I highly recommend using it in conjunction with Meravith, another of the author's outstanding works. Pullback reversals and reversals from the top or bottom, which are entered based on chart highs and lows or volume changes, will become more effective. Honestly, I recommend this so much that I don't want anyone else to know about it :)

Max2233
564
Max2233 2025.07.08 10:33 
 

I would like to compliment this work of art composed by IVAN, a very precise indicator and in combination with his other jewels created by him, trading has simply become simpler and more intuitive. A round of applause to IVAN.

Mase
1739
Mase 2025.05.29 14:17 
 

Simply perfect! In combination with Ivan's other technical indicators, it is a powerful tool. Warning: highly addictive, as the indicators bring so much joy and success. Highly recommended.

Responder ao comentário