Transaction Speed MT5

5

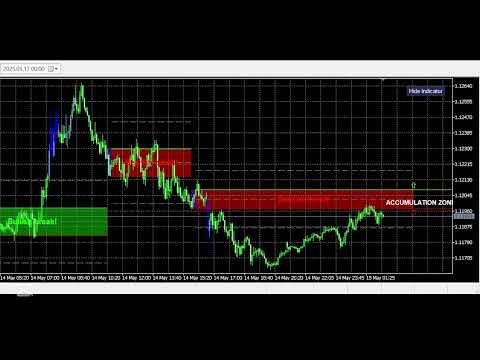
このインジケーターは、市場で関心が示されたゾーンをハイライトし、その後に注文の蓄積ゾーンを表示します。
これは、大規模な**板情報(オーダーブック)**のように機能します。
これは、巨大な資金のためのインジケーターです。その性能は卓越しています。
市場にどんな関心が存在していても、必ず目に見えるようになります

(これは完全に再設計され、自動化されたバージョンです。もはや手動分析は必要ありません。)
トランザクションスピード(取引速度)は新しい概念のインジケーターで、市場で大口注文がどこに・いつ集中しているかを示し、それに基づいたチャンスを提供します。
トレンドの変化を非常に早い段階で察知することができます。
FXでは「出来高」と呼ばれているものは誤解されています。実際には、これは時間あたりの価格変動量です。したがって、正しい名称はトランザクションスピードです。
考え方・行動・分析の仕方すべてが問われます。分析パラダイムの転換は非常に重要です。
このインジケーターは、FXにおける出来高の考え方を根本から再定義し、論理的な形で正確に活用する、ユニークで精密なツールです。

使い方:

初期設定ではインジケーターは自動モードになっており、どの時間足でも単独で機能します。
手動モードに切り替えたい場合は、Auto / Manual Mode ボタンをクリックしてください。

手動モードでは、すべての計算が 2025年1月1日 から始まります。
この日付は自由に変更可能で、異なる分析結果を確認できます。
最適な分析期間は4〜6ヶ月で、複数の市場サイクルをカバーできるため、より信頼性の高い結果が得られます。
期間が長ければ長いほど、検出されるゾーンは少なくなります。

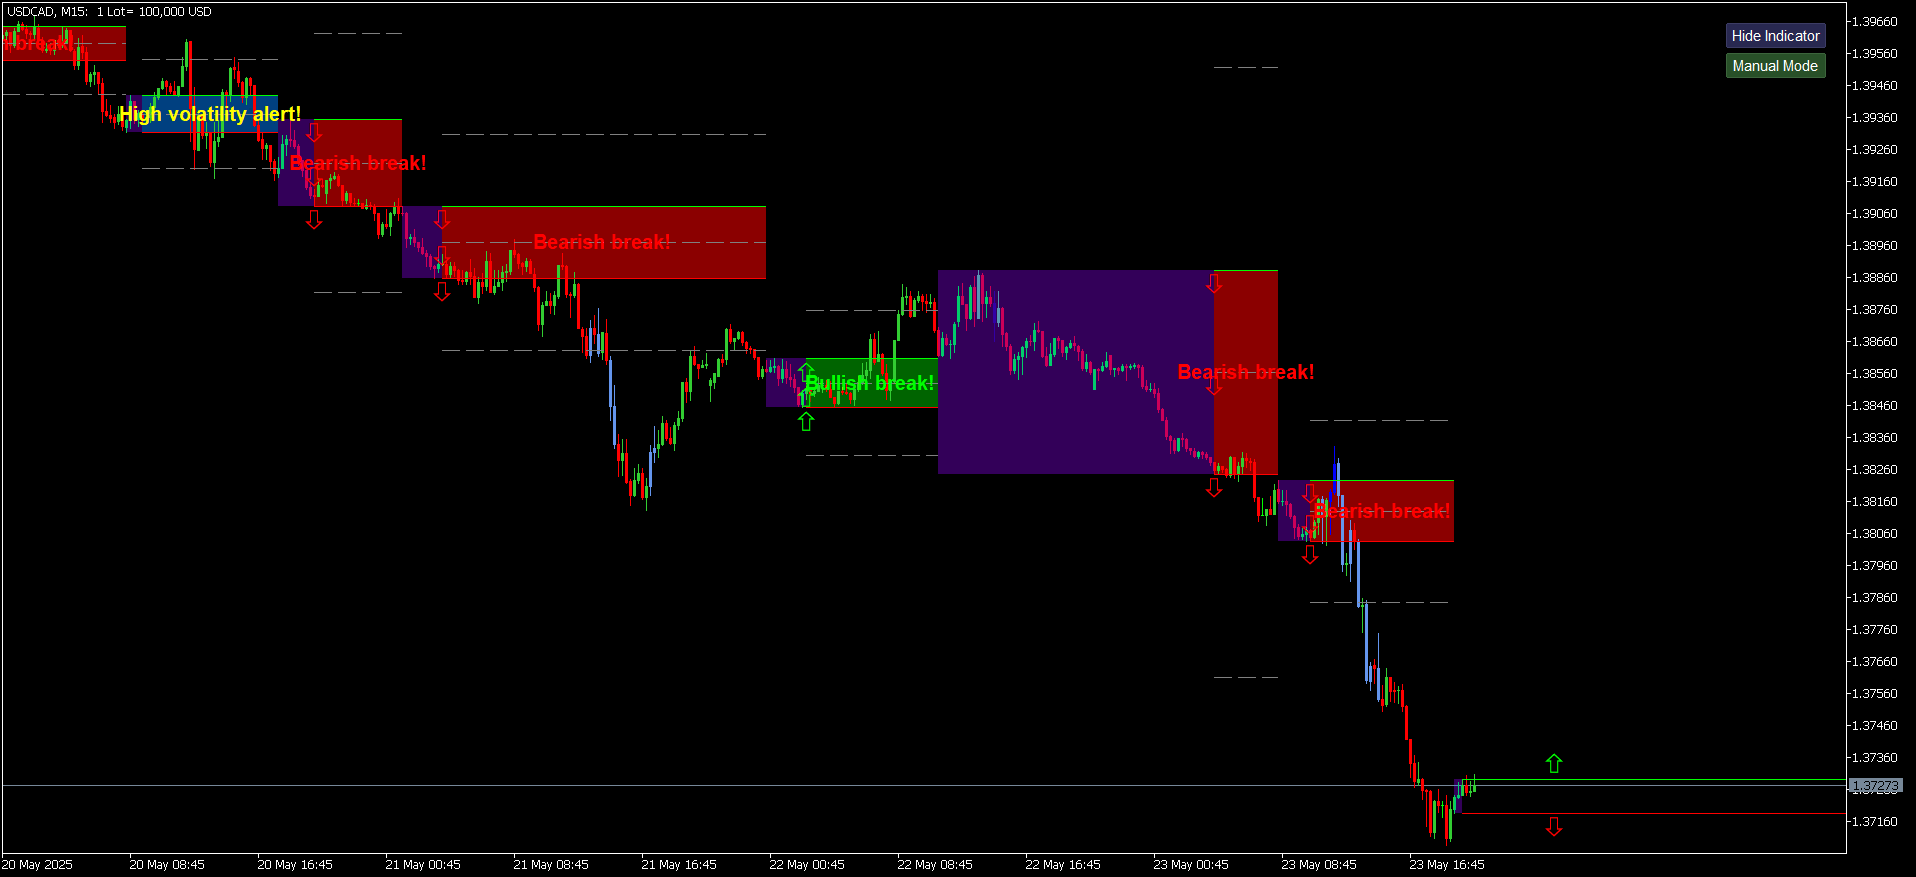
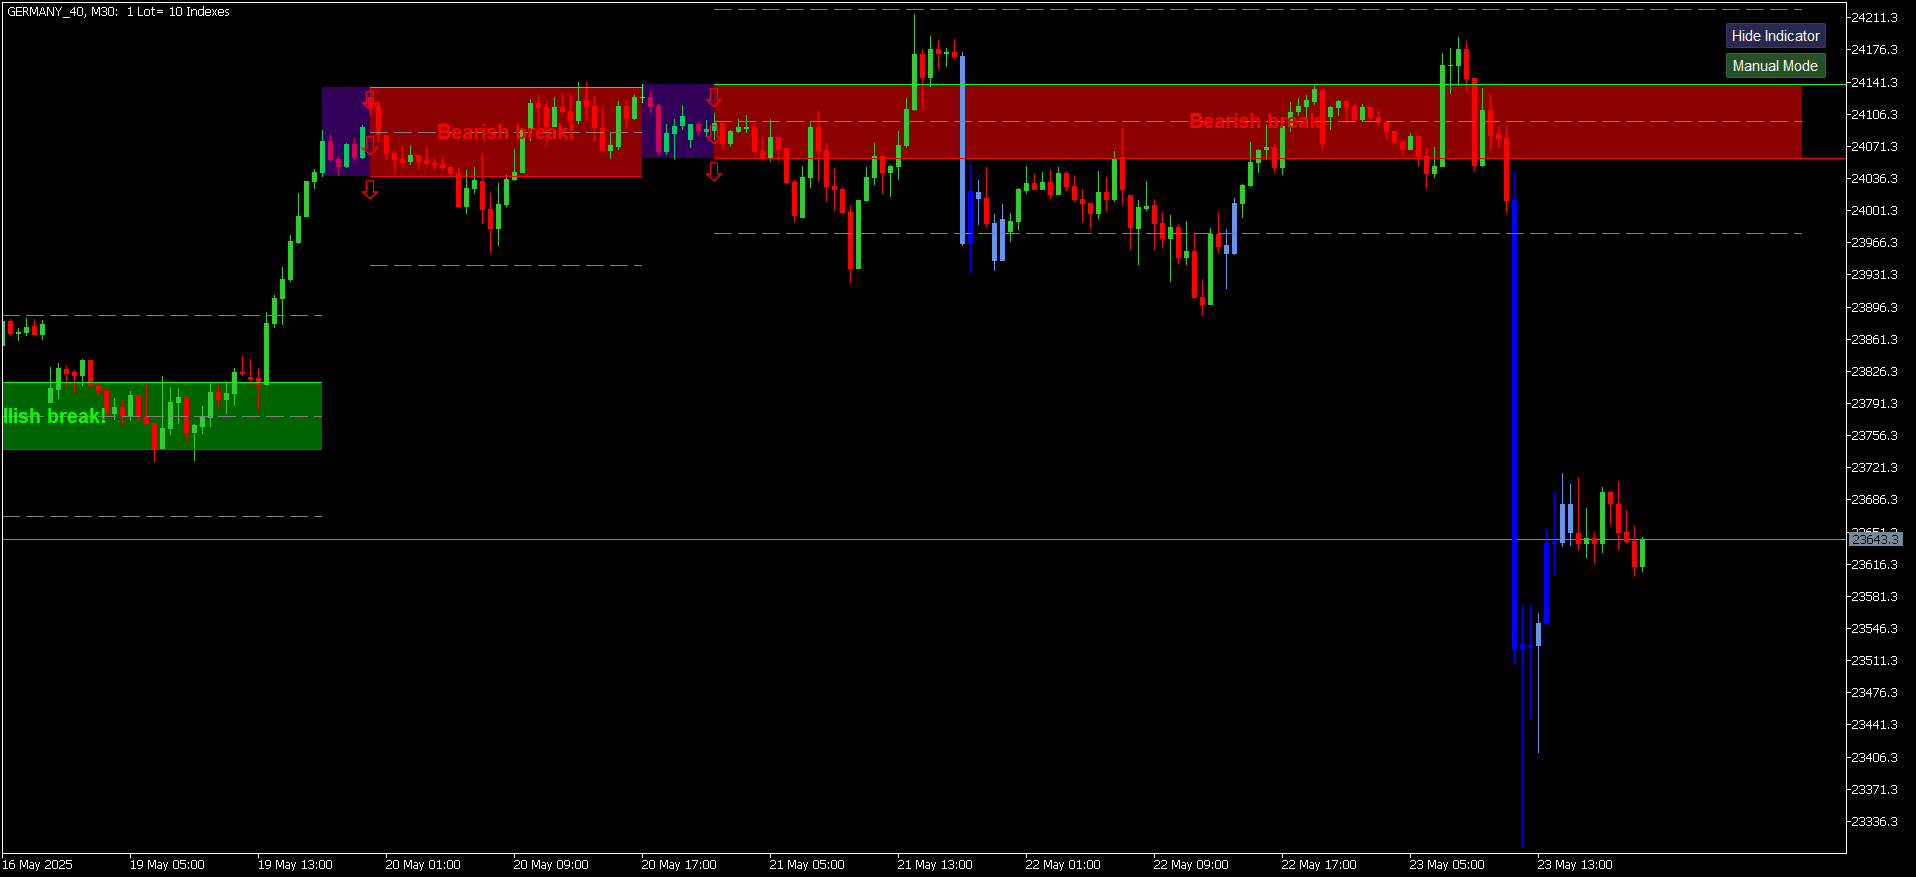
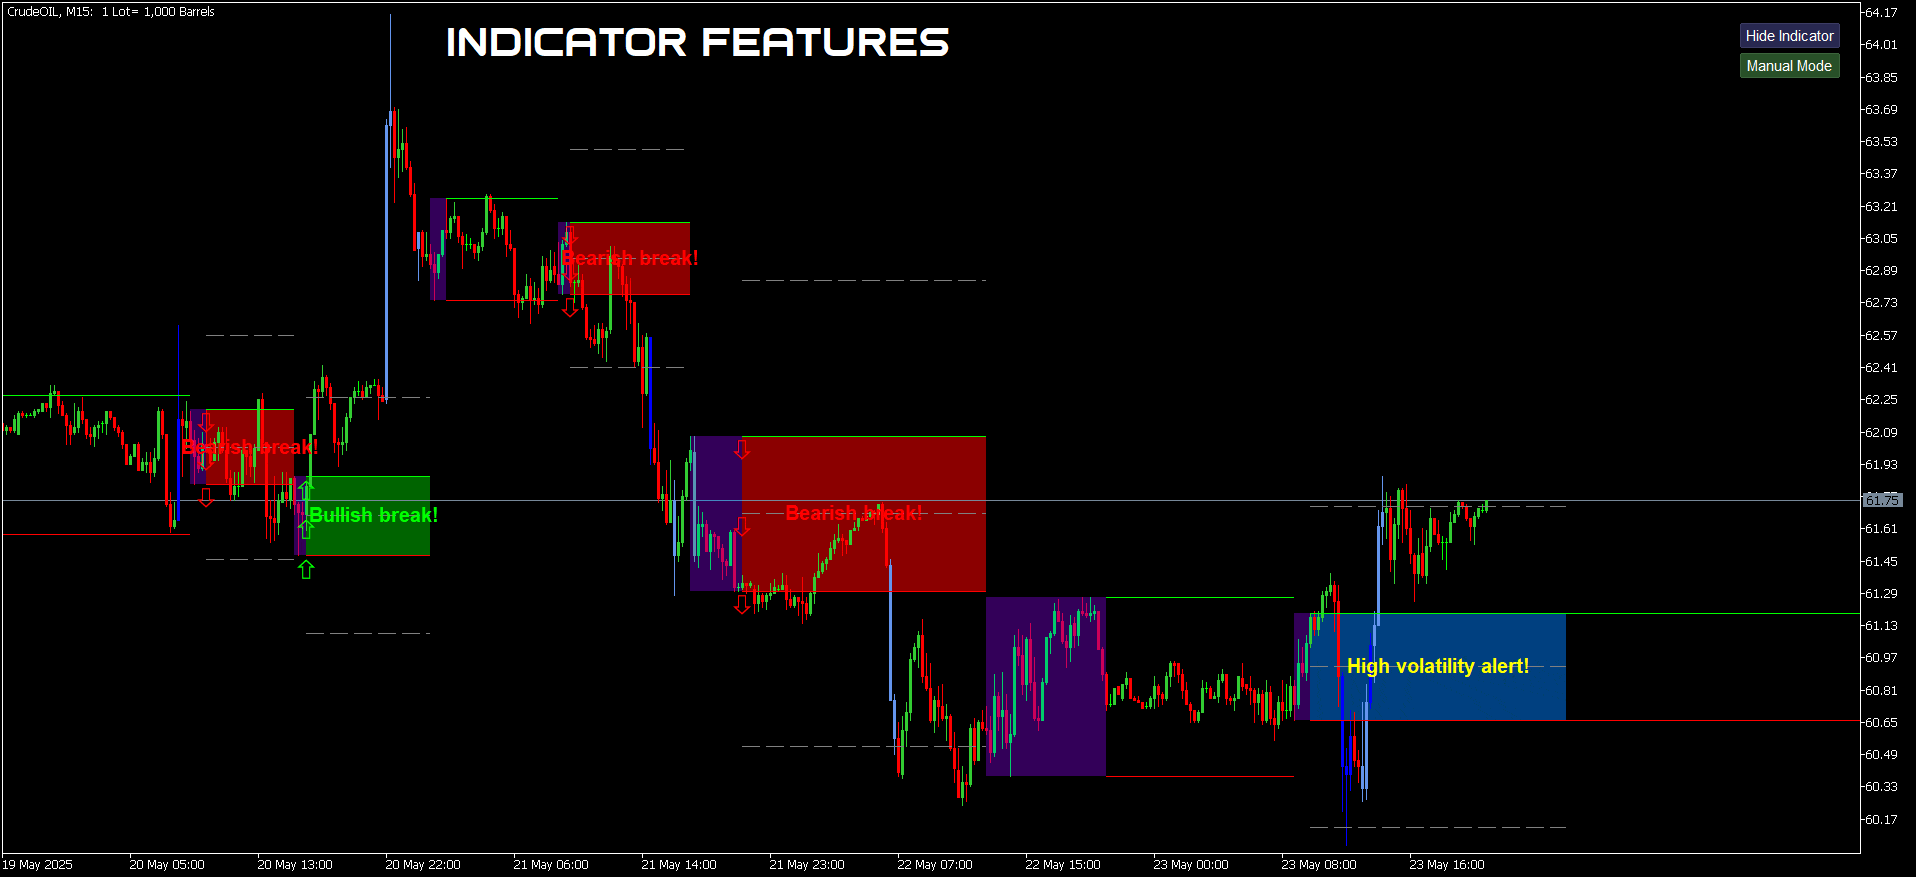
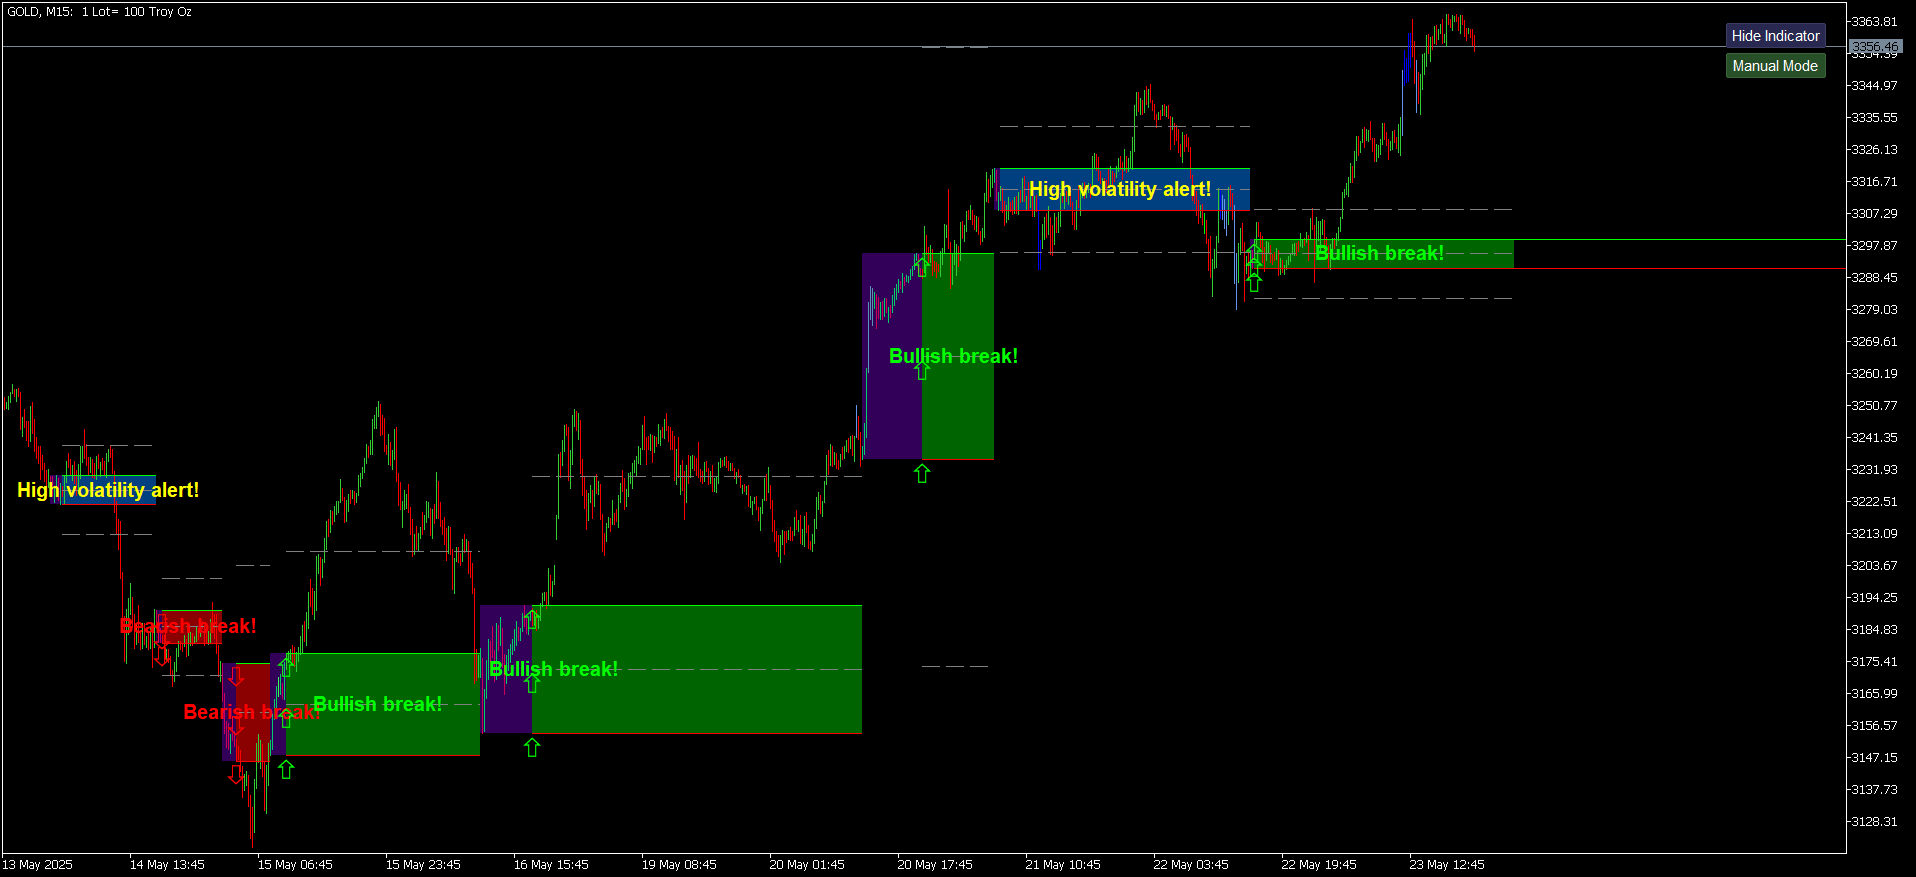
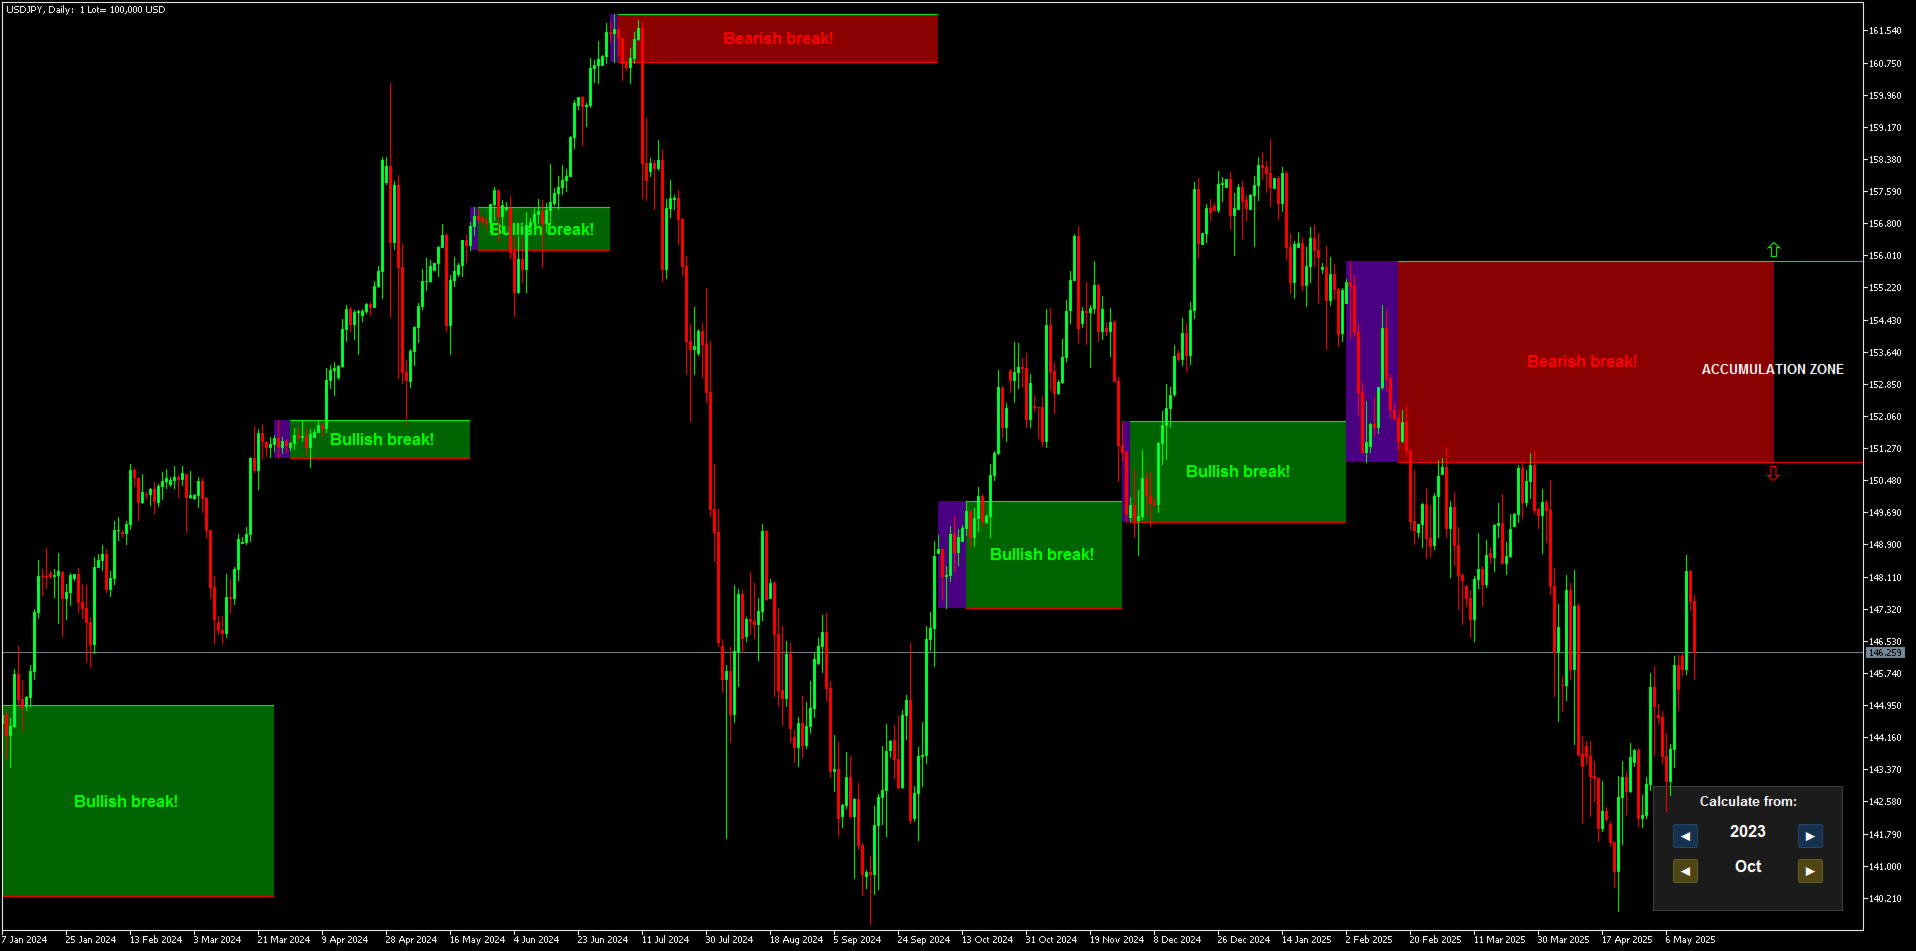
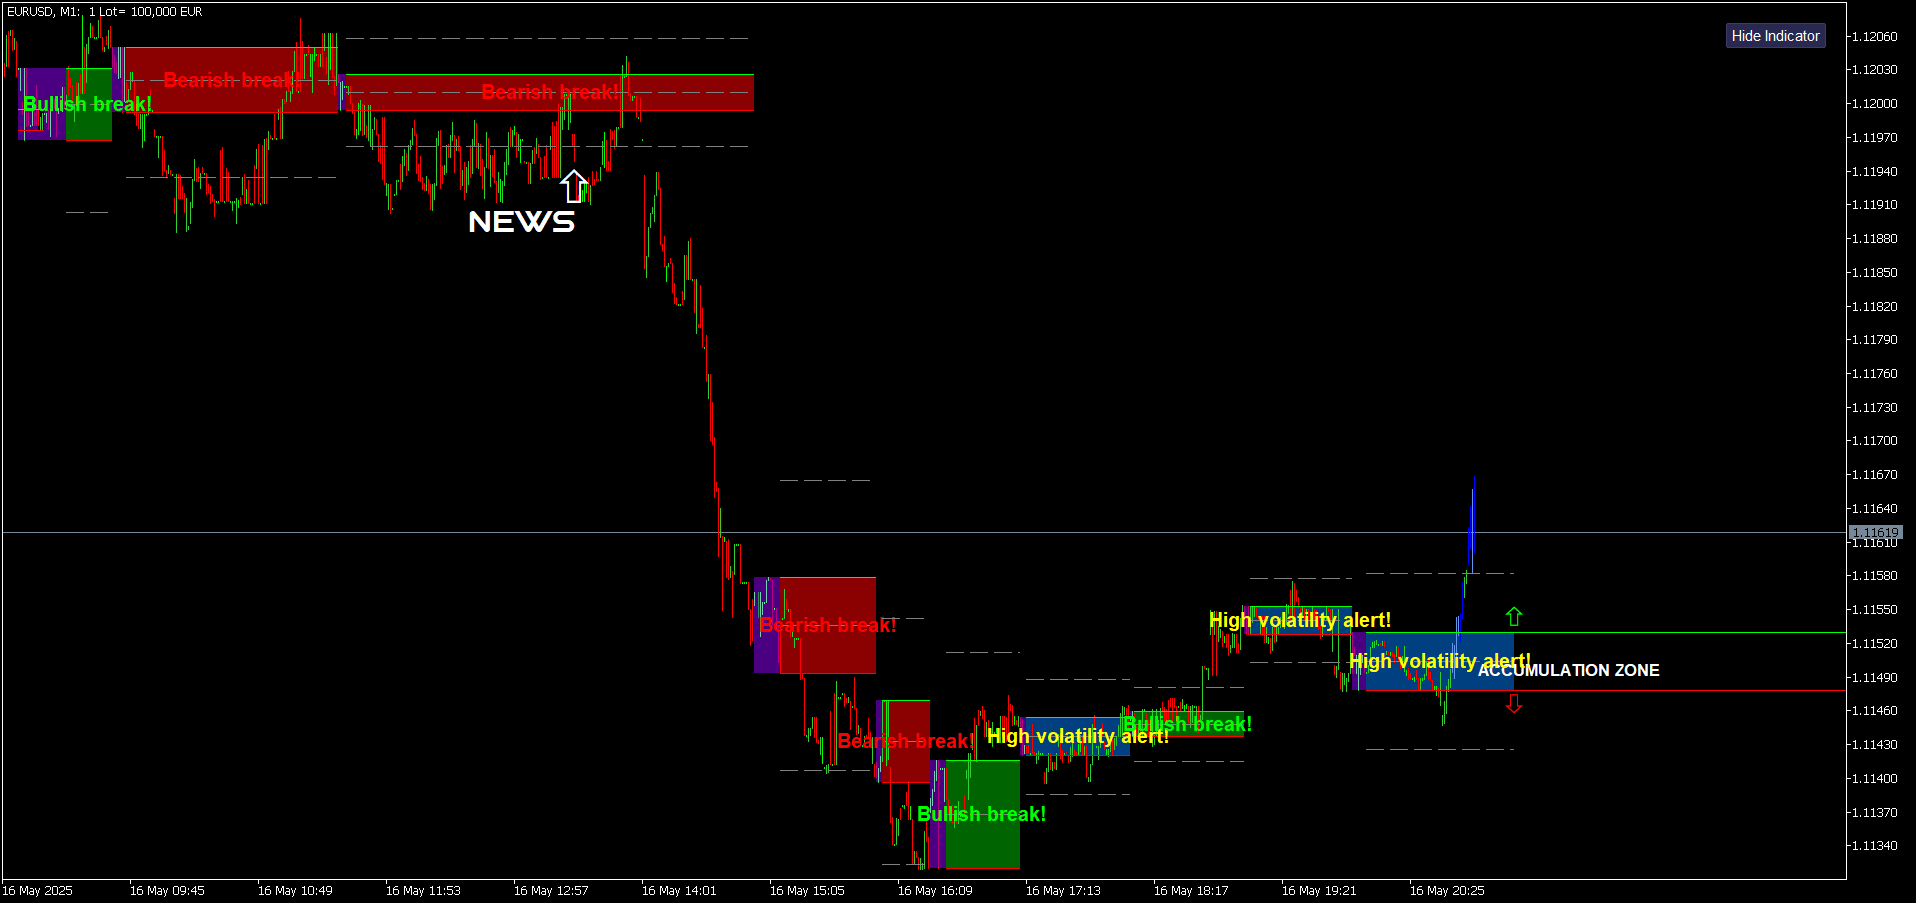
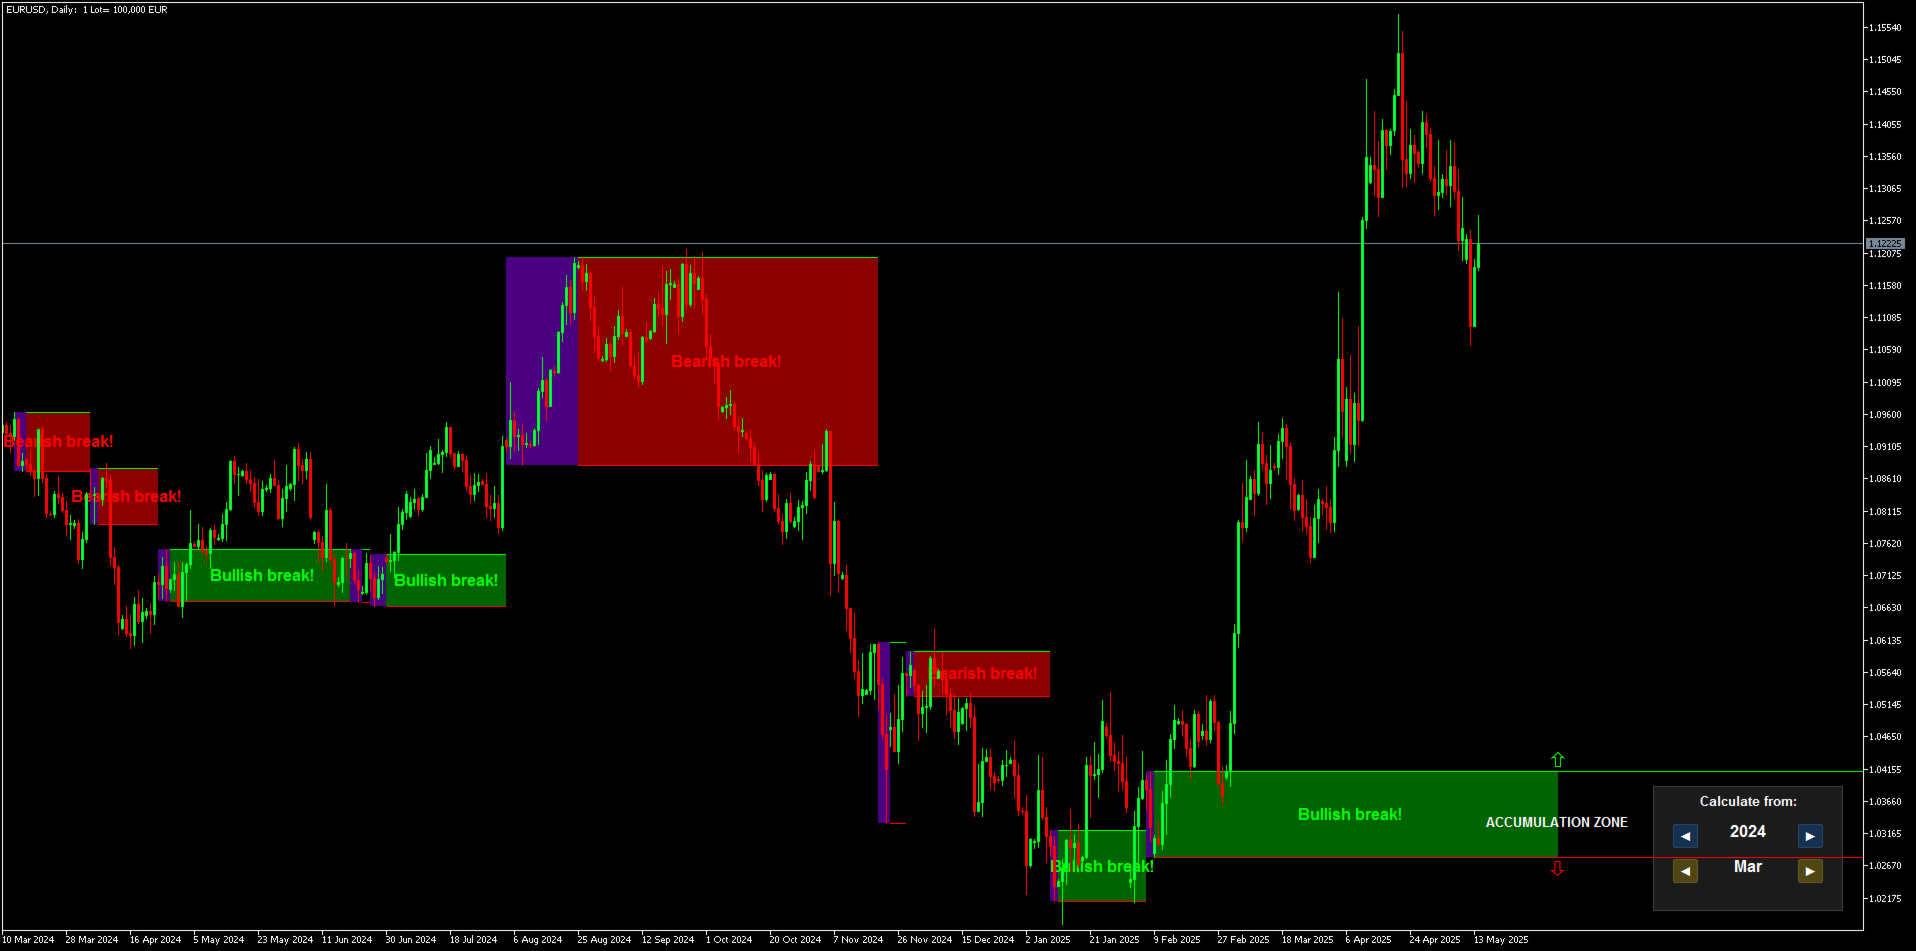
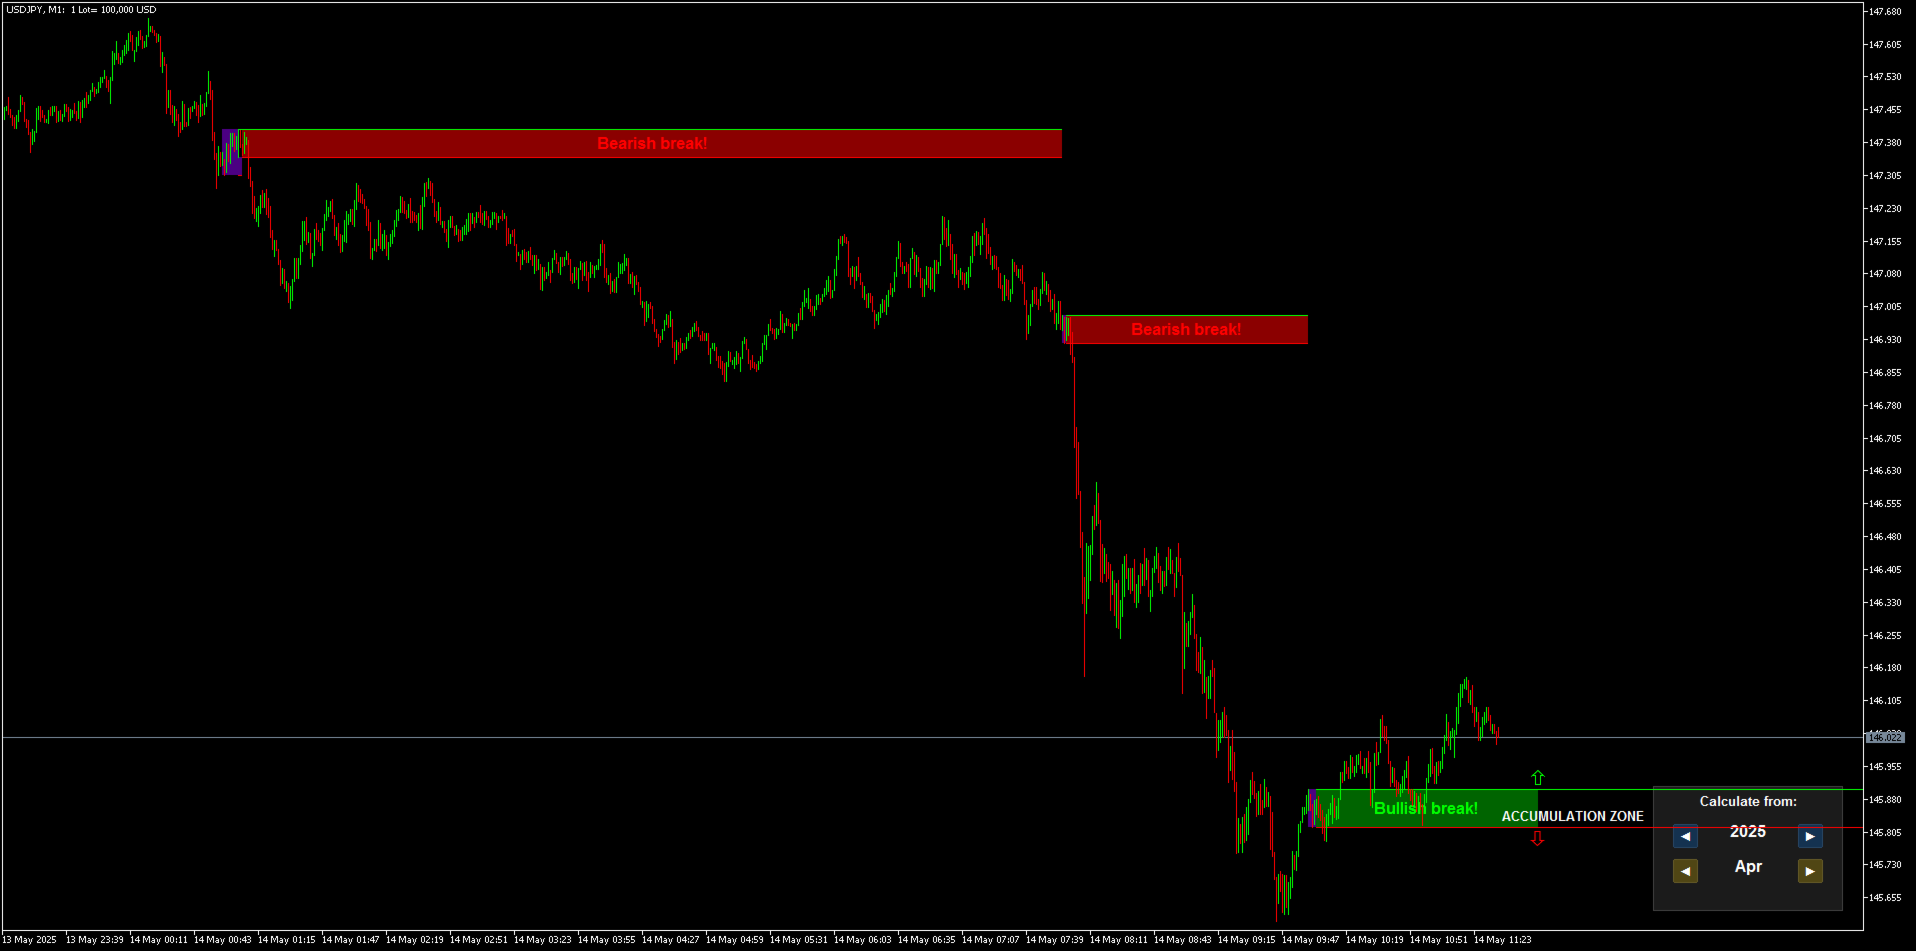
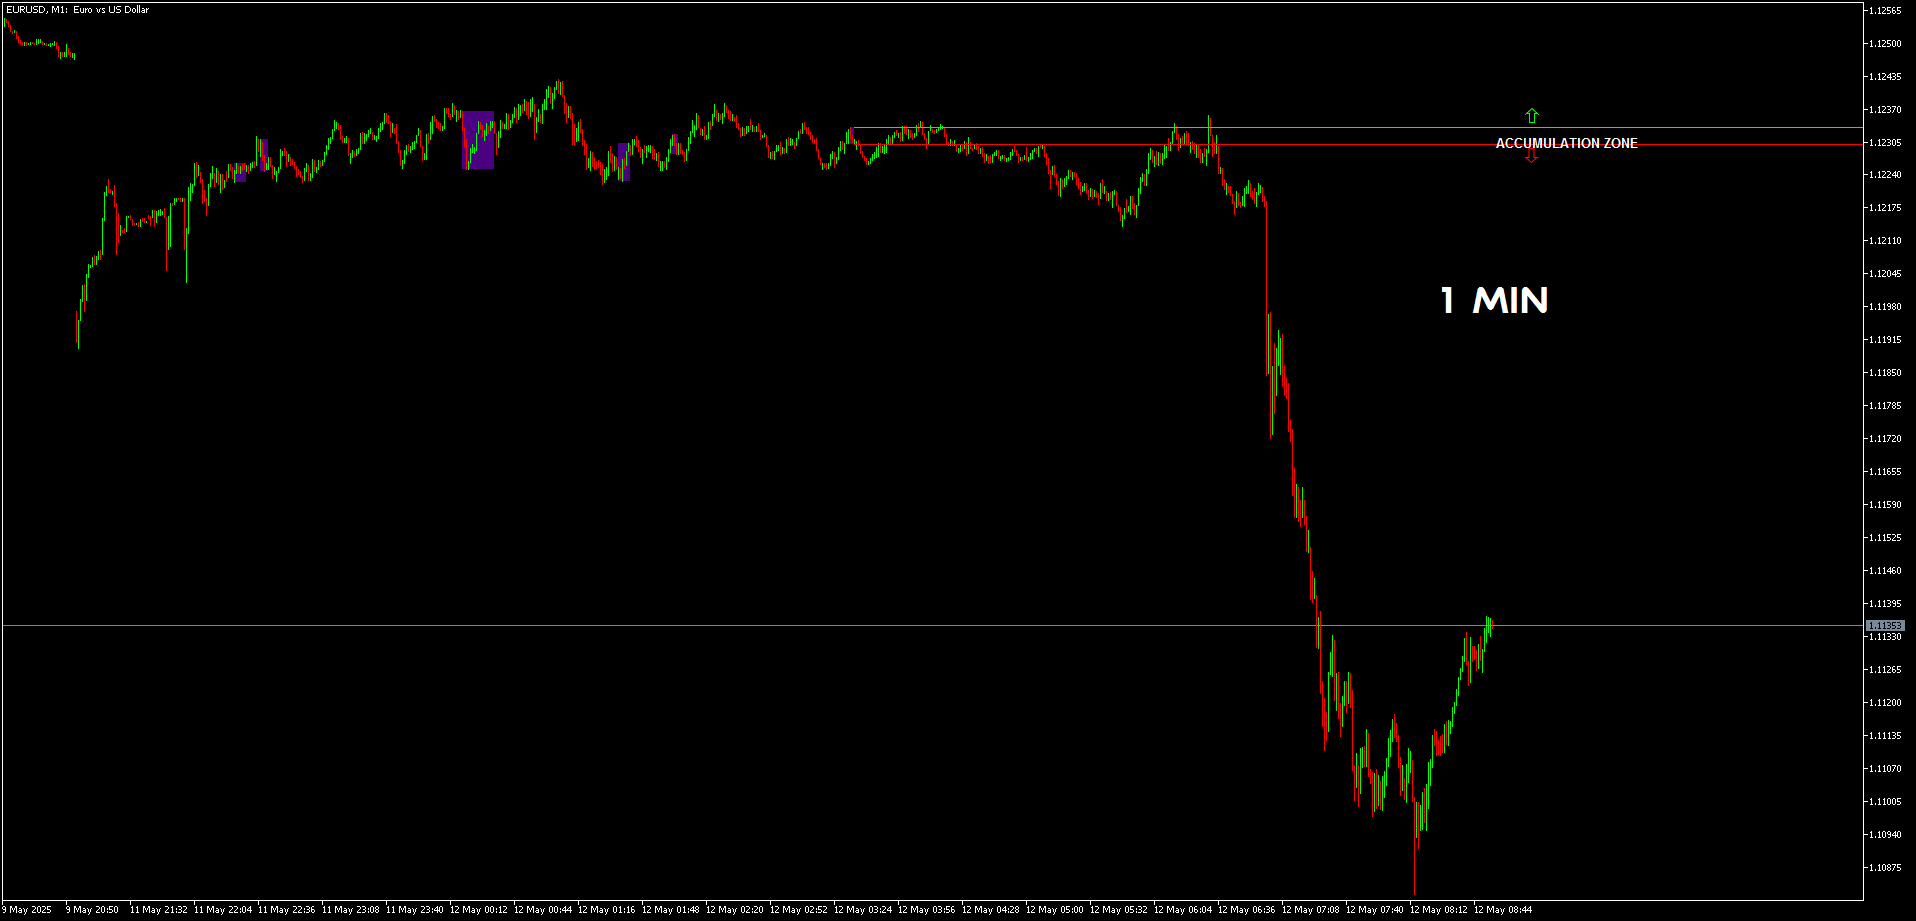
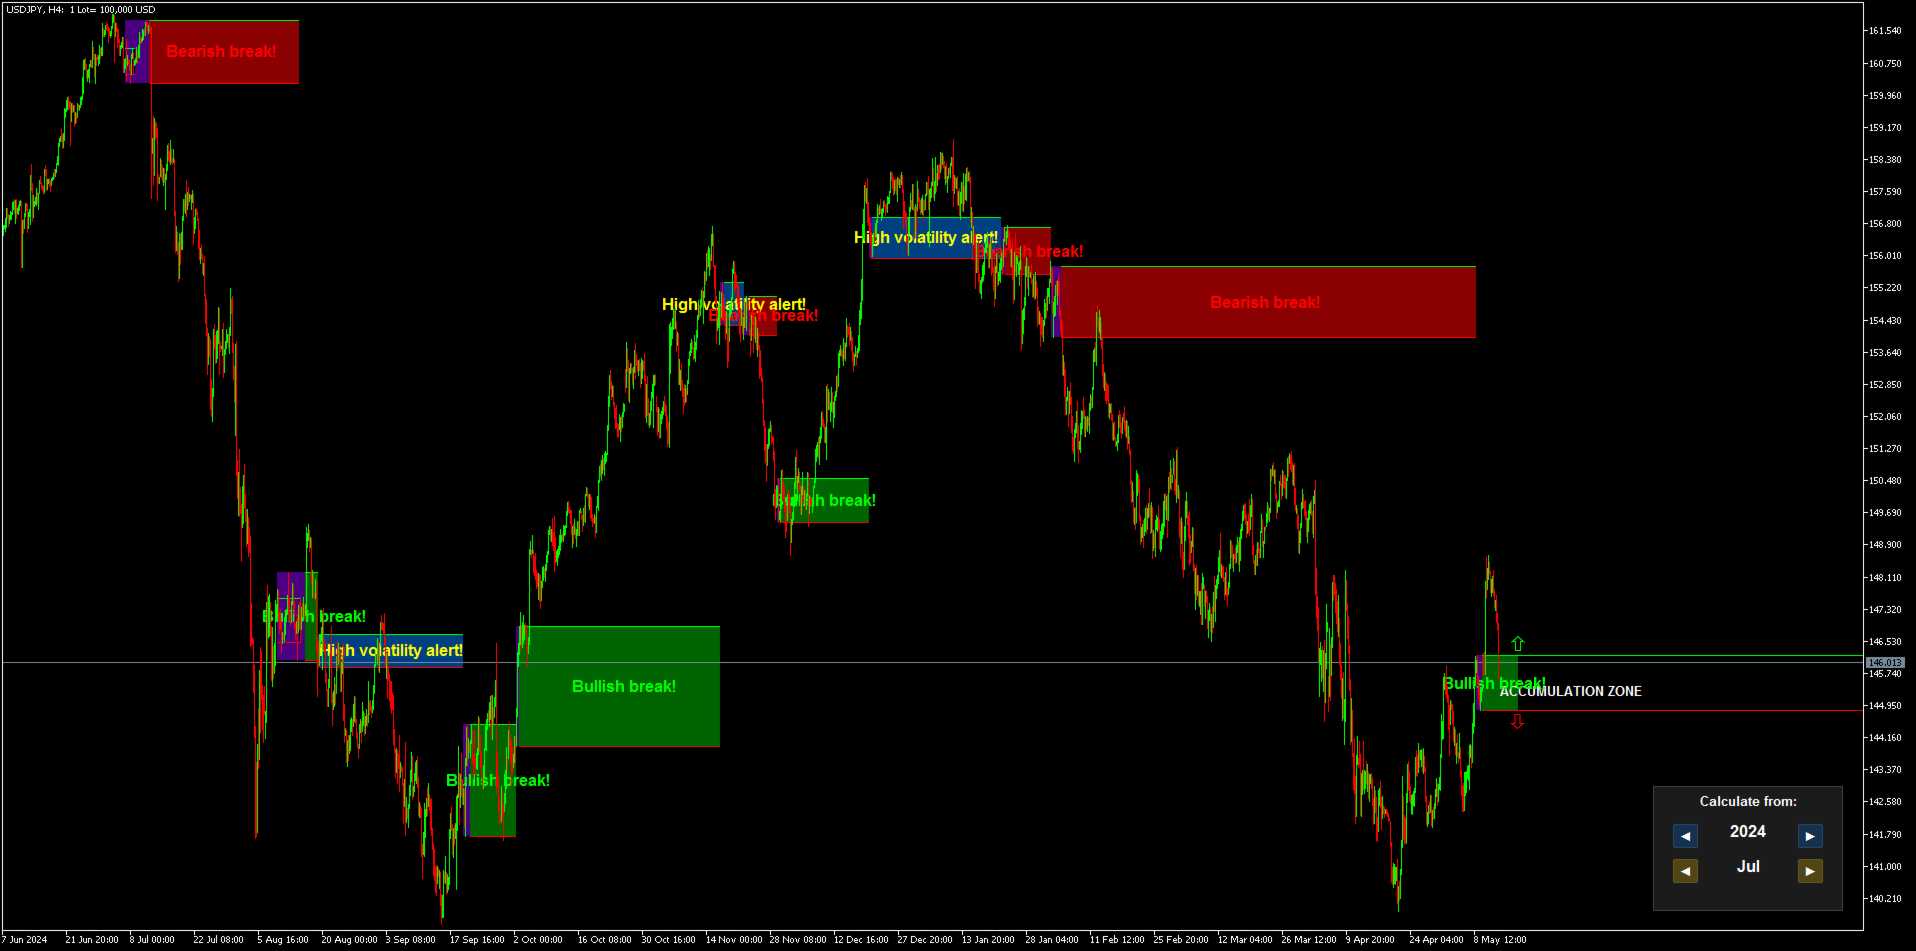
市場が明確な関心を示したエリアは、紫色の長方形で表示されます。
その後に、注文蓄積ゾーンが表示されます。

  • 市場がこのゾーンを上にブレイクした場合、上昇トレンドとなり、ゾーンは緑色に変わります。

  • 市場がゾーンを下にブレイクした場合、下降トレンドとなり、ゾーンは赤色になります。

ゾーンの外で完全に終値を付け、境界線に触れていないローソク足は、本当のブレイクアウトと見なされます。

ローソク足が完全に注文蓄積ゾーンの外に形成された場合、それはブレイクアウトのシグナルであり、市場の方向性を示します。
トレンドは、反対方向へのブレイクアウトが発生するか、新たな関心ゾーンが出現するまで継続されます

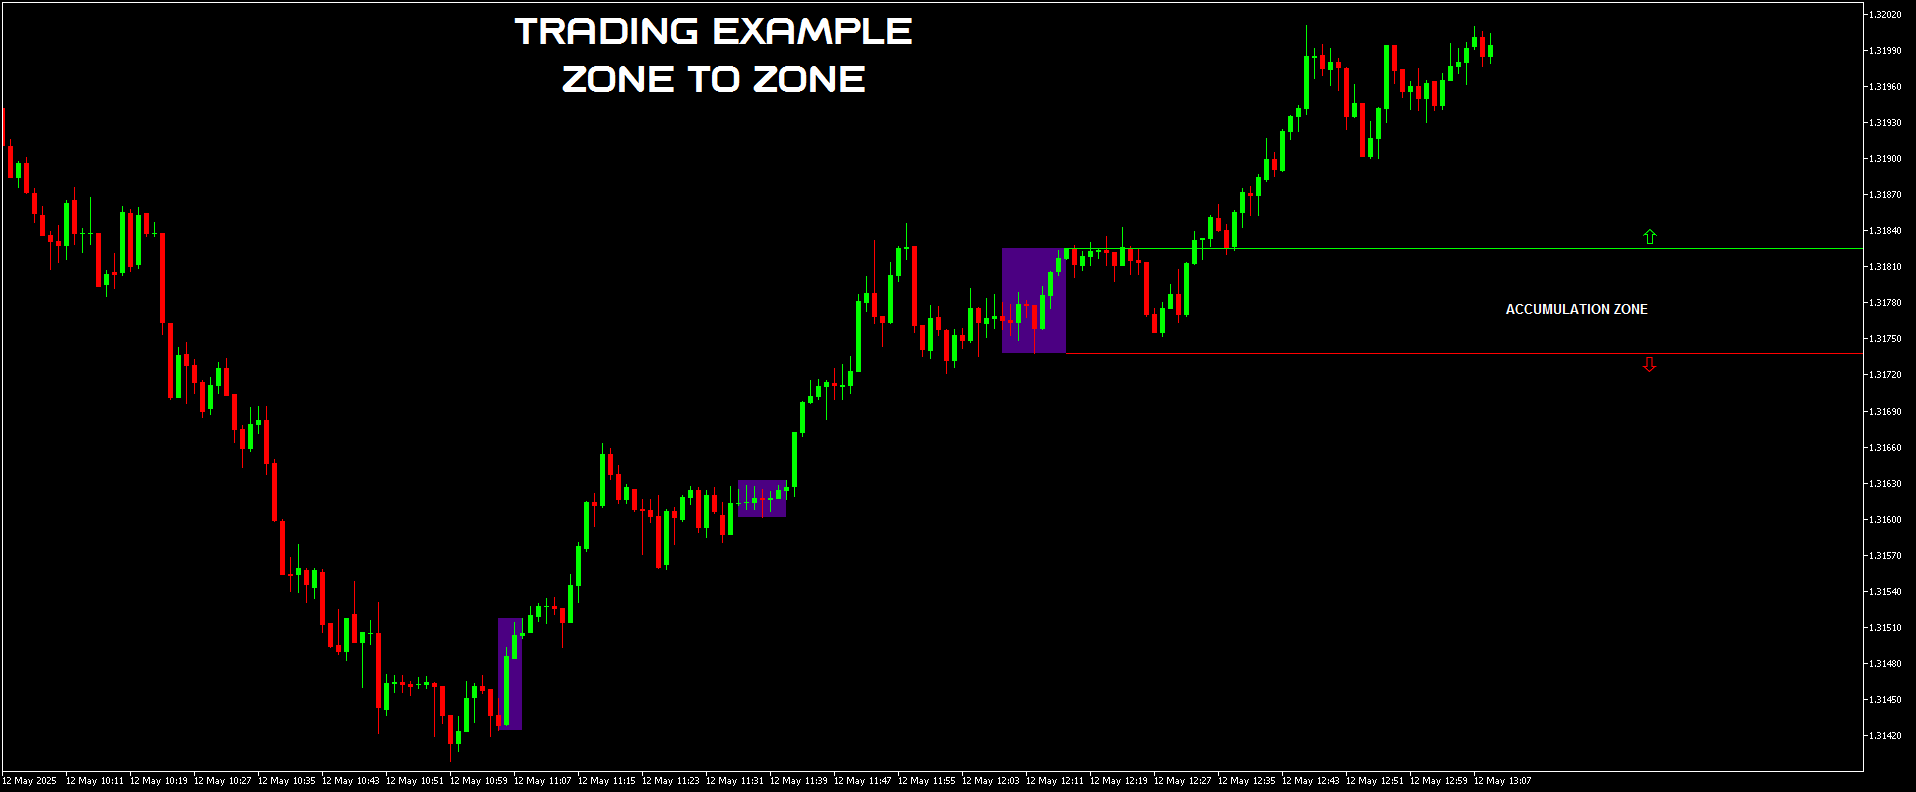
「ゾーンからゾーンへ」取引することが可能です。

例1:
蓄積ゾーンがブレイクされたら、市場の方向にポジションを取ります。

例2:
4時間足で上昇のブレイクアウトが起き、市場が上昇。その後、1時間足で新しいゾーンが出現。
ポジションをクローズし、その1時間ゾーンが次の方向を示すのを待つことができます。

例3:
ゾーン内にいる場合、ゾーン上部から売り、下部から買うことができますが、ブレイクアウトが発生するまではレンジ取引になります。
これはリスクの高い方法です。
絶対にインジケーターに逆らって取引しないこと!決して!

ゾーンが両方向にブレイクされた場合は、**高ボラティリティアラート(High Volatility Alert)**のシグナルが発生します。

これらは資金の足跡です。
そしてこれは目では見えません。なぜなら、私たちはティックボリュームしか見ていないからです。これはFX市場最大の誤解の一つです。
このトランザクションスピードインジケーターは、ティックボリュームを実際の市場活動へと変換します。

これは本格的な分析のための非常に高度なツールです。

推奨設定:

  • 通貨ペア:ティックボリュームが多い主要通貨のみ(EUR/USD、USD/JPY、GBP/USDなど)

  • 時間足:すべての時間足に対応

  • 最低入金額:制限なし

  • 口座タイプ:制限なし

  • ブローカー:制限なし(取引量の多い大手ブローカーが推奨)

純粋な科学です。


レビュー 3
zeke21t2
336
zeke21t2 2026.02.15 13:00 
 

This is an amazing indicator that gives you a quick glimpse into the big picture, the most important aspect of trading: whether you should wait for a buying opportunity, a selling opportunity, or wait for the market to settle down. Simply avoiding false breakouts will dramatically improve your trading performance. For specific buying and selling opportunities, I highly recommend using it in conjunction with Meravith, another of the author's outstanding works. Pullback reversals and reversals from the top or bottom, which are entered based on chart highs and lows or volume changes, will become more effective. Honestly, I recommend this so much that I don't want anyone else to know about it :)

Max2233
565
Max2233 2025.07.08 10:33 
 

I would like to compliment this work of art composed by IVAN, a very precise indicator and in combination with his other jewels created by him, trading has simply become simpler and more intuitive. A round of applause to IVAN.

Mase
1739
Mase 2025.05.29 14:17 
 

Simply perfect! In combination with Ivan's other technical indicators, it is a powerful tool. Warning: highly addictive, as the indicators bring so much joy and success. Highly recommended.

おすすめのプロダクト
RBreaker Gold Indicatorsは、金先物の短期日内取引戦略であり、トレンドフォローと日内反転の2つの取引手法を組み合わせたものです。トレンド相場での利益を捉えるだけでなく、相場が反転した際には迅速に利確し、その流れに沿ってポジションを反転させることができます。 この戦略は、アメリカの雑誌『Futures Truth』において、15年連続で最も収益性の高い取引戦略トップ10に選ばれた実績を持ち、非常に長いライフサイクルを誇り、現在も国内外で広く使用・研究されています。 本インディケーターは、2026年の金先物の値動きに対応し、14日間のATR指標に基づいて、ブレイクアウト係数A、観察係数B、リバーサル係数Rをより合理的な値で定義しています。非常に優れたインディケーターであり、安定的な年間収益を実現しています。ぜひおすすめします〜
これはほぼ間違いなく、MetaTraderプラットフォームで見つけることができる最も完全な調和価格形成自動認識インジケーターです。 19種類のパターンを検出し、フィボナッチプロジェクションをあなたと同じように真剣に受け止め、潜在的逆転ゾーン(PRZ)を表示し、適切なストップロスとテイクプロフィットレベルを見つけます。 [ インストールガイド | 更新ガイド | トラブルシューティング | よくある質問 | すべての製品 ] 19の異なる調和価格形成を検出します プライマリ、派生および補完フィボナッチ投影(PRZ)をプロットします 過去の価格行動を評価し、過去のすべてのパターンを表示します この指標は、独自の品質とパフォーマンスを分析します 適切なストップロスとテイクプロフィットのレベルを表示します ブレイクアウトを使用して適切な取引を通知します すべてのパターン比をグラフにプロットします 電子メール/音声/視覚アラートを実装します スコット・M・カーニーの本に着想を得て、この指標は最も純粋で急を要するトレーダーのニーズを満たすように設計されています。ただし、トレードを容易にする
MT4版  |  FAQ Owl Smart Levels Indicator は、 Bill Williams の高度なフラクタル、市場の正しい波構造を構築する Valable ZigZag、エントリの正確なレベルをマークする Fibonacci レベルなどの一般的な市場分析ツールを含む 1 つのインジケーター内の完全な取引システムです。 利益を得るために市場と場所に。 戦略の詳細な説明 インジケータを操作するための指示 顧問-取引助手 プライベートユーザーチャット ->購入後に私に書いて、私はプライベートチャットにあなたを追加し、あなたはそこにすべてのボーナスをダウンロードすることができます 力はシンプルさにあります! Owl Smart Levels 取引システムは非常に使いやすいので、専門家にも、市場を勉強し始めて自分で取引戦略を選択し始めたばかりの人にも適しています。 戦略と指標に秘密の数式や計算方法が隠されているわけではなく、すべての戦略指標は公開されています。 Owl Smart Levels を使用すると、取引を開始するためのシグナルをすばやく確認し、注文を出すための
このインジケーターは、H.M.Gartley (「株式市場の利益」、1935 年) の開発に従って調和パターン (XABCD) を識別します。 D 点を透視投影の点として投影します (設定で ProjectionD_Mode = true を指定します)。 再描画はしません。 作業時間枠のバーが閉じるとき、特定されたパターン ポイントが Patterns_Fractal_Bars バーの間に移動していない場合、チャート上に (予想される価格変動の方向に) 矢印が表示されます。 この瞬間から、矢印はチャート上に永久に残ります。 連続した 2 ~ 3 つ以上の矢印 - これは市場状況の変化であり、再描画/再描画ではありません (時間枠を前後に切り替えてはなりません)。 注: 2 ~ 3 つ以上の矢印が連続している場合 - これは市況の変化であり、再描画ではありません。 パターンの総数は 85 です (Gartley-222 と Gartley-222WS を含む。完全なリストはコメント セクションにあります)。 識別されたすべてのパターンのうち、最後に識別されたパターンのみがベ
Overview Harmonic Patterns MT5 is a technical analysis indicator designed for the MetaTrader 5 platform. It identifies and displays harmonic price patterns, such as Butterfly, Cypher, Crab, Bat, Shark, and Gartley, in both bullish and bearish directions. The indicator calculates key price levels, including entry, stop loss, and three take-profit levels, to assist traders in analyzing market movements. Visual elements and customizable alerts enhance usability on the chart. Features Detects six ha
Matreshka
Dimitr Trifonov
5 (2)
Matreshka self-testing and self-optimizing indicator: 1. Is an interpretation of the Elliott Wave Analysis Theory. 2. Based on the principle of the indicator type ZigZag, and the waves are based on the principle of interpretation of the theory of DeMark. 3. Filters waves in length and height. 4. Draws up to six levels of ZigZag at the same time, tracking waves of different orders. 5. Marks Pulsed and Recoil Waves. 6. Draws arrows to open positions 7. Draws three channels. 8. Notes support and re
MercariaPattern1-2-3 відстежує рух ціни, знаходить трьоххвильові структури 1-2-3 та підсвічує момент, коли сценарій підтверджується пробоєм ключового рівня. MercariaPattern1-2-3 tracks price movement, detects three-leg 1-2-3 structures and highlights the moment when the scenario is confirmed by a key level breakout. Індикатор збирає локальні свінги в компактну фігуру 0–1–2–3 , чекає підтвердженого пробою та будує стрілку входу з готовими рівнями SL/TP. The indicator combines local swings into a
The RSI Divergence + FVG Signal indicator combines Relative Strength Index (RSI) Divergence with Fair Value Gap (FVG) detection to generate high-probability buy and sell signals based on both momentum shifts and institutional imbalance zones. Core Features: RSI Divergence Detection : Identifies both regular and hidden bullish/bearish divergences between price and RSI. Divergences indicate potential trend reversals or continuation. FVG Zone Recognition : Detects Fair Value Gaps (imbalances caused
Noize Absorption Index - is the manual trading system that measures the difference of pressure between bears forces and bulls forces. Green line - is a noize free index that showing curent situation. Zero value of index shows totally choppy/flat market.Values above zero level shows how powerfull bullish wave is and values below zero measures bearish forces.Up arrow appears on bearish market when it's ready to reverse, dn arrow appears on weak bullish market, as a result of reverse expectation.
プレミアムレベルは、正しい予測の精度が80%を超える独自の指標です。 この指標は、最高のトレーディングスペシャリストによって2か月以上テストされています。 あなたが他のどこにも見つけられない作者の指標! スクリーンショットから、このツールの正確さを自分で確認できます。 1は、1キャンドルの有効期限を持つバイナリーオプションの取引に最適です。 2はすべての通貨ペア、株式、商品、暗号通貨で機能します 手順: 赤い矢印が表示されたらすぐにダウントレードを開き、青い矢印が表示されたら閉じます。青い矢印の後に開くこともできます。 試してテストしてください!推奨設定はデフォルトです! 日足チャートで最高の精度を示します! インディケータは、2600 Pipsの収益性に対して、約10Pipsという非常に小さなマージンを使用します。
ATrend
Zaha Feiz
4.82 (17)
ATrend: その仕組みと使い方 仕組み MT5プラットフォーム向けの「ATREND」インジケーターは、テクニカル分析手法の組み合わせを利用して、トレーダーに堅牢な買いと売りのシグナルを提供するように設計されています。このインジケーターは主に、ボラティリティ測定のために平均真の範囲(ATR)を活用し、潜在的な市場動向を特定するためのトレンド検出アルゴリズムを併用しています。 購入後にメッセージを残すと、特別なボーナスギフトが贈呈されます。 主な特徴: - ダイナミックなトレンド検出: インジケーターは市場トレンドを評価し、シグナルを適宜調整することで、トレーダーが優位な市場環境に合わせて戦略を立てるのを支援します。     - ボラティリティ測定: ATRを使用することで、インジケーターは最適なストップロス(SL)とテイクプロフィット(TP)レベルを決定するために不可欠な市場ボラティリティを測定します。 - シグナルの視覚化: インジケーターは、チャート上に買いと売りのシグナルを視覚的に表示することで、トレーダーの意思決定を強化します。 操作手順 入力とセッティング - TimeF
"Impulses and Corrections 5" is created to help traders navigate the market situation. The indicator shows multi-time frame upward and downward "Impulses" of price movements. These impulses are the basis for determining the "Base" , which is composed of zones of corrections of price movements, as well as "Potential" zones for possible scenarios of price movement. Up and down impulses are determined based on a modified formula of Bill Williams' "Fractals" indicator. The last impulse is always "U
The indicator detects and displays М. Gartley's Butterfly pattern. The pattern is plotted by the extreme values of the ZigZag indicator (included in the resources, no need to install). After detecting the pattern, the indicator notifies of that by the pop-up window, a mobile notification and an email. The pattern and wave parameters are displayed on the screenshots. The default parameters are used for demonstration purposes only in order to increase the amount of detected patterns. Parameters z
Manyal trading system, CovEchoTrend Robot, focuses on reliability and flexibility. By employing statistical analysis methods to study the relationships between the base indicator and market patterns, the system enables a deeper understanding of market processes. Intelligent pattern analysis: The application of statistical data processing helps identify key trend reversal points more accurately, signaling significant market shifts. Informed decision-making is based on the intersection of indicato
SMC Venom Model BPR インジケーターは、スマート マネー (SMC) コンセプトで取引するトレーダー向けのプロフェッショナル ツールです。価格チャート上の 2 つの主要なパターンを自動的に識別します。 FVG   (フェアバリューギャップ) は、3 本のローソク足の組み合わせで、最初のローソク足と 3 番目のローソク足の間にギャップがあります。ボリュームサポートのないレベル間のゾーンを形成し、価格修正につながることがよくあります。 BPR   (バランス価格範囲) は、2 つの FVG パターンの組み合わせで、「ブリッジ」を形成します。これは、価格がボリュームアクティビティの少ない動きで動くときに、ブレイクアウトしてレベルに戻るゾーンで、ローソク足の間にギャップを作成します。 これらのパターンは、大規模な市場プレーヤーと一般参加者の相互作用が発生するチャート上のボリュームと価格動向の分析に基づいて、トレーダーが主要なサポート/レジスタンス レベル、ブレイクアウト ゾーン、エントリ ポイントを識別するのに役立ちます。 インジケーターは、長方形と矢印の形でパターンを視覚
STRICTLY FOR BOOM INDEX ONLY!!!!! Here I bring the Maximum Trend Arrows OT1.0 MT5 indicator. This indicator is made up of a combination of different trend indicators for entries and exits, for entries an orange arrow will paint on the chart below the current market and a red flag for closing of trades and it produces buy arrows only. When the orange arrow appears, it will appear along with it's sound to notify you. The 1H timeframe is recommended, don't use it anywhere else than on the 1H timefr
CosmiCLab SMC FIBO CosmiCLab SMC FIBO is a professional trading indicator designed for traders who use Smart Money Concepts (SMC), market structure analysis and Fibonacci retracement levels. The indicator automatically detects market swings and builds Fibonacci levels based on the latest impulse movement. It also identifies market structure changes such as BOS (Break of Structure) and CHOCH (Change of Character), helping traders understand the current market direction. CosmiCLab SMC FIBO also pr
Price Magnet — Price Density and Attraction Levels Indicator Price Magnet is a professional analytical tool designed to identify key support and resistance levels based on statistical Price Density. The indicator analyzes a specified historical period and detects price levels where the market spent the most time. These zones act as “magnets,” attracting price action or forming a structural base for potential reversals. Unlike traditional Volume Profile tools, Price Magnet focuses on price-time d
PR EA - Engulfing Pattern Trading System Automated Engulfing Pattern Detection with MA Confirmation The PR EA is a Meta Trader 5 expert advisor that identifies and trades bullish/bearish engulfing candlestick patterns when confirmed by a moving average filter. Designed for swing trading on 30-minute charts with compatibility for M15 and H1 time frames. Key Features: Pattern Recognition - Detects valid bullish/bearish engulfing candle formations Trend Confirmation - 238-period SMA filter
Chỉ báo này sẽ thông báo cho bạn nếu cấu hình xu hướng thành công. Tín hiệu theo xu hướng không nên được tăng theo, nhưng tín hiệu mua ở mức giá thấp theo mô hình giao dịch thông thường của bạn, hoặc tín hiệu bán ở mức giá tốt, là một lựa chọn rất tốt. Hãy thiết lập nó trên khung thời gian lớn hơn và theo dõi các khung thời gian nhỏ hơn, bám sát các xu hướng chính. Tôi thường thiết lập ba khung thời gian gần nhau nhất và không bao giờ đi ngược tín hiệu của INdicator này. INdicator   này không có
# DRAWDOWN INDICATOR V4.0 - The Essential Tool to Master Your Trading ## Transform Your Trading with a Complete Real-Time Performance Overview In the demanding world of Forex and CFD trading, **knowing your real-time performance** isn't a luxury—it's an **absolute necessity**. The **Drawdown Indicator V4.0** is much more than a simple indicator: it's your **professional dashboard** that gives you a clear, precise, and instant view of your trading account status. --- ## Why This Indicator
The   Fibonacci Confluence Toolkit   is a technical analysis tool designed to help traders identify potential price reversal zones by combining key market signals and patterns. It highlights areas of interest where significant price action or reactions are anticipated, automatically applies Fibonacci retracement levels to outline potential pullback zones, and detects engulfing candle patterns. Its unique strength lies in its reliance solely on price patterns, eliminating the need for user-define
##   ONLY GOLD ##   Тiльки Золото ## **Mercaria Professional Trading Zones - Complete Guide** ## **Mercaria Professional Trading Zones - Повний посібник** ### **How Mercaria Zones Work / Як працюють зони Mercaria** **English:** Mercaria Zones is an advanced trading indicator that identifies high-probability support and resistance areas using ZigZag extremes combined with mathematical zone calculations. The indicator works on multiple timeframes simultaneously, providing a comprehensive view
The indicator displays the delta and the cumulative delta based on the "Time & Sales" deals list data. In addition to the standard timeframes, the indicator displays data regarding the seconds timeframes (S5, S10, S15, S20, S30) to choose from. Using the rectangle, user can select an arbitrary area in the indicator subwindow to view the ratio of the volumes of deals of buyers and sellers within this area. Indicator features: The indicator works correctly only on those trading symbols for which
The Trend Forecaster indicator utilizes a unique proprietary algorithm to determine entry points for a breakout trading strategy. The indicator identifies price clusters, analyzes price movement near levels, and provides a signal when the price breaks through a level. The Trend Forecaster indicator is suitable for all financial assets, including currencies (Forex), metals, stocks, indices, and cryptocurrencies. You can also adjust the indicator to work on any time frames, although it is recommen
まず第一に、この取引ツールはノンリペイント、ノンリドロー、ノンラグの指標であり、プロの取引に理想的ですことを強調する価値があります。 オンラインコース、ユーザーマニュアル、デモ。 スマートプライスアクションコンセプトインジケーターは、新米から経験豊富なトレーダーまで、非常 に強力なツールです。Inner Circle Trader AnalysisやSmart Money Concepts Trading Strategiesなど、20以上の有用な指標を1つに組み合わせています。このインジケーターはスマートマネーコンセプトに焦点を当て、大手機関の取引方法を提供し、彼らの動きを予測するのに役立ちます。 特に、流動性分析に優れており、機関がどのように取引しているかを理解しやすくしています。市場のトレンドを予測し、価格の動きを慎重に分析するのに優れています。機関の戦略とトレードを合わせることで、市場の動向についてより正確な予測ができます。このインジケーターは多目的であり、市場構造を分析し、重要な注文ブロックを特定し、さまざまなパターンを認識するのに優れています。 このインジケーター
ENGLISH DESCRIPTION (MQL5 Standard Optimized) Product Name: Obsidian Forest Automaton AI (MT5) [Subtitle: Forest Structure | Obsidian Blade TEMA | Shield Safety] Introduction Obsidian Forest Automaton AI is a structural trend-following construct designed to navigate the market with the cold precision of an automaton. It builds a "Forest Structure" using Ichimoku Cloud , cuts through noise with the Obsidian Blade (TEMA) , and validates density with Standard Deviation . This creates a system that
Terra Infinity is a flat indicator. This improved version of the CalcFlat indicator has three additional lines that significantly increase its effectiveness. Unlike its predecessor with two static levels, Terra Infinity adds three dynamic lines above the main histogram, which are interpreted as follows: base signal line, minimum signal line, maximum signal line. These lines are formed using the additional parameter Avg, which is the average value of the histogram. Averaging produces a line cl
Divergent Stochastic Filter II Catch Reversals Early, Filter Noise, Trade with Confidence The Edge: Why This Stochastic is Different  Every trader knows the Stochastic oscillator. But knowing when to trust its signals, that's the real challenge. The Divergent Stochastic Filter II transforms this classic indicator into a precision reversal detection system by adding critical elements: divergence intelligence, signal filtering and exhaustion detection.  While standard Stochastic oscillators fire s
The  SuperTrend Advance Trading  is a widely-used technical indicator based on  SuperTrend Strategy + Price Action + EMA . How it works: -  Buy/Sell Signals  can be generated when the trend reverses, the conditions of Price action, TrendLine and EMA are met. - After the  Signal  appears, be patient and wait until the candle closes, at that time place the order as soon as possible. You may have time to review your entry, consider whether it is a good entry or not. - Carefully review the entry, up
このプロダクトを購入した人は以下も購入しています
AriX
Temirlan Kdyrkhan
1 (4)
AriX Indicator for MT5 A powerful trend-following and signal-evaluation tool AriX is a custom MT5 indicator that combines Moving Averages and ATR-based risk/reward logic to generate clear buy/sell signals. It visualizes dynamic SL/TP levels, evaluates past trade outcomes, and displays win/loss statistics in a clean on-chart panel. Key features include: Buy/Sell signals based on MA crossovers ATR-based SL/TP1/TP2/TP3 levels with visual lines and labels Signal outcome tracking with real-time stat
OmniSync Projection
Antonio-alin Teculescu
5 (1)
Chronos Fractal Engine is an innovative price projection indicator for MetaTrader 5, designed to transform your technical analysis by intelligently identifying and projecting historical price patterns. Built upon an advanced correlation algorithm and the fractal principles of the market, this powerful tool visualizes potential future price movements, giving you a unique edge in your trading decisions. What is Chronos Fractal Engine? At its core, the Chronos Fractal Engine employs a sophisticat
ARIPoint is a powerful trading companion designed to generate high-probability entry signals with dynamic TP/SL/DP levels based on volatility. Built-in performance tracking shows win/loss stats, PP1/PP2 hits, and success rates all updated live. Key Features: Buy/Sell signals with adaptive volatility bands Real-time TP/SL/DP levels based on ATR Built-in MA Filter with optional ATR/StdDev volatility Performance stats panel (Success, Profit/Loss, PP1/PP2) Alerts via popup, sound, push, or email Cu
CGE Trading Suite
Carl Gustav Johan Ekstrom
5 (1)
CGE Trading Suite delivers the analytical edge typically reserved for professional trading desks. The platform integrates a full suite of analytical tools into one seamless workflow: dynamic grid mapping, liquidity behavior analysis, ECM, trend lines, MIDAS, trade cycles, and directional channel projections. Together, these provide a unified view of market structure and momentum. Directional clarity is further enhanced by the capital flow index, which measures currency basket strength to identif
ARIScalp is a powerful trading companion designed to generate high-probability entry signals with dynamic TP/SL/DP levels based on volatility. Built-in performance tracking shows win/loss stats, PP1/PP2 hits, and success rates all updated live. Key Features: Buy/Sell signals with adaptive volatility bands Real-time TP/SL/DP levels based on ATR Built-in MA Filter with optional ATR/StdDev volatility Performance stats panel (Success, Profit/Loss, PP1/PP2) Alerts via popup, sound, push, or email Cus
The Institutional Secret Method  represents a paradigm shift in market analysis, moving away from lagging indicators and into the realm of Topological Finance . It is engineered to decode the hidden geometry of price movement by calculating the most efficient path—the Geodesic —between current price action and institutional liquidity targets. The system views the market as a physical landscape where price is naturally drawn toward massive pools of liquidity (Stops). It uses two primary calculati
note: this indicator is for METATRADER4, if you want the version for METATRADER5 this is the link:  https://www.mql5.com/it/market/product/108106 TRENDMAESTRO ver 2.5 TRENDMAESTRO recognizes a new TREND from the start, he never makes mistakes. The certainty of identifying a new TREND is priceless. DESCRIPTION TRENDMAESTRO identifies a new TREND in the bud, this indicator examines the volatility, volumes and momentum to identify the moment in which there is an explosion of one or more of these da
Rtc ML Ai | Predictor CORE MACHINE LEARNING ENGINE Adaptive ML Market Predictor – Multi-Bar Trend & Candle Forecast What This Indicator Does This indicator is a  real-time market prediction engine  designed to analyze price behavior and estimate  future market tendencies . Unlike conventional indicators, this system  does not rely on static parameters or historical curve-fitting , but adapts its internal state dynamically during live market operation. Instead of using static rules, the indic
Jita Indicator Pro MT5 | All Timeframes Professional Trend Agreement System – Premium Edition ($500) What Is Jita Indicator Pro? Jita Indicator Pro is a structured trend-confirmation system designed for serious traders who value precision, alignment, and controlled signal behavior. It combines: Advanced band-based trend direction logic ATR-driven structural trigger engine Dual-confirmation agreement system Locked history update design This indicator prints signals only when multiple conditions
WARNING: This indicator is distributed EXCLUSIVELY on MQL5.com MT4 version:   https://www.mql5.com/it/market/product/160363 MT5 version:   https://www.mql5.com/it/market/product/160410 ============================================================================================= MAX RIBBON ver 1.00 The indicator that shows you the TREND clearly and unambiguously! ============================================================================================= DESCRIPTION MAX RIBBON is an advanced tre
IVISTscalp5
Vadym Zhukovskyi
5 (6)
iVISTscalp5インジケーターをご紹介します。このインジケーターは、トレーディングにおいて独自でありながら効果的です。時間データに基づくこのインジケーターは、多年にわたる経験と金融市場の深い分析の結果です。iVISTscalp5インジケーターは、手動トレーディングにとって優れたツールです。便利さ、簡単さ、可視化 - すべての複雑さが内部に隠されています。私たちは、iVISTscalp5インジケーターの設定と使用を最大限に簡素化しました。このインジケーターは、MT5ターミナルにあるすべての金融商品に適しています。 稼働時間は、4時から20時(UTC+3)です。 iVISTscalp5インジケーターメニュー(スクリーンショット1を参照): History - 引用を計算する週数 dT_min - 時間間隔の選択(分) TFline - 水平ボリュームの作成(時間枠) BARSline - 水平ボリュームの作成(バー数) TFtrend1 - デイリーチャンネルの作成(時間枠) BARStrend1 - デイリーチャンネルの作成(バー数) TFtrend2 - 週次チャンネルの作成(時
+++++++++++++++++++++++++++++++++++++++++++++++++++++++++++++++++++++++++++++++++++++++++++++++++ +++ Link to EURUSD Only Free Version -->  https://www.mql5.com/en/market/product/156904?source=Unknown +++++++++++++++++++++++++++++++++++++++++++++++++++++++++++++++++++++++++++++++++++++++++++++++++ Hallo Trader, This is a traditional GANN & FIBONACCI strategy based on detection of an impulsive move in the opposite direction. This is called a Breakout. At the moment of Breakout, the indicator draw
Big Player Range
Thalles Nascimento De Carvalho
5 (3)
BigPlayerRange — MT5向け最強インジケーター BigPlayerRange は、MetaTrader 5 で日経ミニやドル先物などの取引において、 最も効果的なインジケーター と評価されています。大口投資家(機関投資家)の行動を可視化し、高精度なテクニカル分析を可能にします。 どのように機能するのか? BigPlayerRangeは、買い圧力ゾーン(緑ライン)と売り圧力ゾーン(赤ライン)を描画し、価格がその範囲を超えるとトレンド方向への動きを示唆します。 緑のライン上で終値: 買いの勢いが強く、上昇トレンドの可能性。 赤のライン下で終値: 売り圧力が優勢で、下落が予想される。 範囲内での価格: レンジ相場でブレイクを待つ段階。 主なメリット: 機関投資家ゾーンの検出: 大口のエントリーポイントを視覚化。 自動ターゲット計算: 利確ポイントを戦略的に設定。 プルバックの可能性分析: リスク管理に役立つ情報提供。 推奨の使い方: Imbalance DOM Pro と併用してゾーンブレイクを確認。 SwingVolum
FRONTIER PIVOTS - Geometric Levels Indicator This indicator plots support and resistance levels/ranges on the chart using mathematical calculations. It helps traders identify potential price reaction zones based on geometric patterns. Main Features: Automatically calculates and displays key price levels Plots both support and resistance lines Uses daily price data for level calculation Clean visual presentation with different colors for different level types No repainting - levels remain static
A tool for on-chart strategy backtesting and performance analysis. A utility for developing, debugging, and testing custom trading ideas and indicator functions. An indicator designed to quickly test trading concepts and visualize the effectiveness of different input parameters. An all-in-one sandbox for testing everything from simple crossovers to complex, multi-condition trading systems.
VTrende Pro
Andrii Diachenko
5 (1)
VTrende Pro - MTF indicator for trend trading with a display panel for MT5 *** Videos can be translated into any language using subtitles (video language - Russian) Although the signals of the VTrende Pro indicator can be used as signals of a full-fledged trading system, it is recommended to use them in conjunction with the Bill Williams TS. VTrende Pro is an extended version of the VTrende indicator. Difference between Pro version and VTrende: - Time zones - Signal V - signal 1-2 waves -    S
Recommended TimeFrame >= H1. 100% Non Repainted at any moment.  Use it carefully, only with Trend Direction. Trading Usage: 2 Variants: as Range System or as BreakOut System (Both Only With Trend Direction)::: (Always use StopLoss for minimise Risk); [1] as Range System: (Recommended) in UP TREND:  - BUY in Blue Line , then if price goes down by 50 points (on H1) open Second BUY.   Close in any Profit you wish: TrailingStop(45 points) or Close when Price touches upper Gold Line. in DOWN TREND
FXLAND Smart Reversal Indicator (MT5) FXLAND Smart Reversal Indicator is a professional technical analysis tool designed to help traders identify potential price reversal zones and key market turning points with clarity and precision. The best reversal indicator and price return by choosing only one ceiling or floor in each time frame A masterpiece of combining mathematics and Gann, fractal matrix, Fibonacci, movement angle and time. Completely intelligent Key Features Detects potenti
A scalping indicator based on mathematical patterns, which on average gives signals with relatively small SL, and also occasionally helps to catch big moves in the markets (more information in the video) This indicator has three main types of notifications: The first type warns of a possible/upcoming signal on the next bar The second type indicates the presence of a ready signal to enter the market/open a position The third type is for SL and TP levels - you will be notified every time price re
The Expert Advisor and the video are attached in the Discussion tab . The robot applies only one order and strictly follows the signals to evaluate the indicator efficiency. Pan PrizMA CD Phase is an option based on the Pan PrizMA indicator. Details (in Russian). Averaging by a quadric-quartic polynomial increases the smoothness of lines, adds momentum and rhythm. Extrapolation by the sinusoid function near a constant allows adjusting the delay or lead of signals. The value of the phase - wave s
Классификатор силы тренда. Показания на истории не меняет. Изменяется классификация только незакрытого бара. По идее подобен полной системе ASCTrend, сигнальный модуль которой, точнее его аппроксимация в несколько "урезанном" виде, есть в свободном доступе, а также в терминале как сигнальный индикатор SilverTrend . Точной копией системы ASCTrend не является. Работает на всех инструментах и всех временных диапазонах. Индикатор использует несколько некоррелируемых между собой алгоритмов для класси
FFx Universal Strength Meter PRO is more than a basic strength meter. Instead of limiting the calculation to price, it can be based on any of the 19 integrated strength modes + 9 timeframes. With the FFx USM, you are able to define any period for any combination of timeframes. For example, you can set the dashboard for the last 10 candles for M15-H1-H4… Full flexibility! Very easy to interpret... It gives a great idea about which currency is weak and which is strong, so you can find the best pai
The FFx Universal MTF alerter shows on a single chart all the timeframes (M1 to Monthly) with their own status for the chosen indicator. 9 indicators mode (MACD-RSI-Stochastic-MA-ADX-Ichimoku-Candles-CCI-PSAR). Each can be applied multiple times on the same chart with different settings. Very easy to interpret. Confirm your BUY entries when most of the timeframes are showing green color. And confirm your SELL entries when most of the timeframes are showing red color. 2 Alert Options : input to s
The FFx Watcher PRO is a dashboard displaying on a single chart the current direction of up to 15 standard indicators and up to 21 timeframes. It has 2 different modes: Watcher mode: Multi Indicators User is able to select up to 15 indicators to be displayed User is able to select up to 21 timeframes to be displayed Watcher mode: Multi Pairs User is able to select any number of pairs/symbols User is able to select up to 21 timeframes to be displayed This mode uses one of the standard indicators
FFx Patterns Alerter gives trade suggestions with Entry, Target 1, Target 2 and StopLoss .... for any of the selected patterns (PinBar, Engulfing, InsideBar, OutsideBar) Below are the different options available: Multiple instances can be applied on the same chart to monitor different patterns Entry suggestion - pips to be added over the break for the entry 3 different options to calculate the SL - by pips, by ATR multiplier or at the pattern High/Low 3 different options to calculate the 2 TPs -
MetaTrader 4 version available here : https://www.mql5.com/en/market/product/24881 FFx Basket Scanner is a global tool scanning all pairs and all timeframes over up to five indicators among the 16 available. You will clearly see which currencies to avoid trading and which ones to focus on. Once a currency goes into an extreme zone (e.g. 20/80%), you can trade the whole basket with great confidence. Another way to use it is to look at two currencies (weak vs strong) to find the best single pairs
MetaTrader 4 version available here: https://www.mql5.com/en/market/product/25793 FFx Pivot SR Suite PRO is a complete suite for support and resistance levels. Support and Resistance are the most used levels in all kinds of trading. Can be used to find reversal trend, to set targets and stop, etc. The indicator is fully flexible directly from the chart 4 periods to choose for the calculation: 4Hours, Daily, Weekly and Monthly 4 formulas to choose for the calculation: Classic, Camarilla, Fibonac
ClassicSBA
Umri Azkia Zulkarnaen
this indicator very simple and easy if you understand and agree with setup and rule basic teknical sba you can cek in link : please cek my youtube channel for detail chanel : an for detail info  contact me  basicly setup buy (long) for this indicator is Magenta- blue and green candle or magenta - green  and green candlestik and for setup sell (short) is Black - yellow - and red candle or black - red  and red candlestik
Indicador en base a la pendiente de la linea de precio, dibuja una línea de color cuando sube a base de los precios que previamente has sido procesados o linealizados, y cuando baja la pendiente la linea linealizada toma otro color. En este caso se a considerado 6 lineas de diferentes procesos desde pendientes largas hacia las cortas, observándose que cuando coincidan las pendientes se produce un máximo o mínimo, lo que a simple vista nos permitirá hacer una COMPRA O VENTA.
Индикатор Coefficient Of Determination (COD) представляет собой значение коэффициента детерминации или квадрат коэффициента корреляции между зависимой переменной — ценой и объясняющей переменной — тиковым объемом. Что это дает нам на практике? COD отлично распознает кульминацию трендовых движений, что позволяет подбирать оптимальные точки и ловить развороты рынка. Как использовать индикатор: Наиболее популярная торговая стратегия строится совместно с трендовым индикатором Moving Average (MA), пе
作者のその他のプロダクト
RSI Divergence Pulse は、ダイバージェンス検出、マルチタイムフレーム分析、視覚ツールを1つの軽量アプリケーションに統合した包括的なRSIインジケーターです。RegularおよびHiddenダイバージェンスを自動的に識別し、ライブマルチタイムフレームRSIパネルを表示し、OB/OSゾーンを視覚的に認識しやすく塗りつぶし、価格チャートとRSIサブウィンドウの両方にダイバージェンス線を描画し、Buy/Sell矢印を配置し、リアルタイムアラートを提供します。 Features Color-Coded RSI Line RSIラインは現在のゾーンに基づいて色が変わります。青は中立ゾーン(30〜70)を示します。緑はオーバーボートゾーン(70以上)を示します。赤はオーバーソールドゾーン(30以下)を示します。 RSI Signal Line RSIのSMA(デフォルト期間9)がシグナルラインとして機能します。RSIとシグナルのクロスオーバーがタイミング情報を提供します。差分(Diff)はダッシュボードに表示されます。 Automatic Divergence Detectio
Meravith
Ivan Stefanov
5 (3)
マーケットメーカーのためのツール。 Meravith は次の機能を提供します: すべての時間足を分析し、現在有効なトレンドを表示します。 強気と弱気の出来高が等しくなる流動性ゾーン(出来高均衡)を強調表示します。 異なる時間足のすべての流動性レベルをチャート上に直接表示します。 テキスト形式の市場分析を生成し、参考情報として表示します。 現在のトレンドに基づいて目標値、サポートレベル、ストップロスを計算します。 取引のリスクリワード比を算出します。 口座残高に基づいてポジションサイズを計算し、潜在的な利益を推定します。 また、市場に大きな変化があった場合には警告を表示します。 インジケーターの主要ライン: 強気/弱気の出来高エグゾーストライン ― 目標値として機能します。 市場のトレンドを示すライン。市場が強気か弱気かによって色が変わり、トレンドのサポートとして機能します。主にその色が市場センチメントを示します。 出来高均衡ライン(Eq)。Eq(Volume Equilibrium)ラインはシステムの中核です。これは買い手と売り手の出来高のバランスポイントを表します。市場の流動性を示し
このインジケーターは、価格の動きとMACDヒストグラムの間の強気および弱気のダイバージェンスを正確に識別します。使用する指数移動平均(EMA)の期間は、5(速い)、34(遅い)、および信号線の期間は5です。このインジケーターは、モメンタムが弱まるポイントを強調表示し、トレンドの反転の可能性を示唆します。 正しいダイバージェンスの識別ルール: 強気のダイバージェンスは、価格がより低い安値を形成し、MACDヒストグラムがゼロラインの上で同時により高い安値を形成する場合に有効です。 弱気のダイバージェンスは、価格がより高い高値を形成し、MACDヒストグラムがゼロラインの下で同時により低い高値を形成する場合に有効です。 ヒストグラムの極値と価格の極値がゼロラインの同じ側に一致していない場合、ダイバージェンス信号は無効となります。これは誤った信号を引き起こす可能性があります。 このアプローチは、MACDダイバージェンス分析を適用するための最も正確で信頼性の高い方法です。 インジケーターの特徴: 確認された強気および弱気のダイバージェンスを明確にマークします。 MACDダイバージェンス検証ルール
FREE
MERAVITH SCANNERは、MetaTrader 5用のプロフェッショナルな金融市場インジケーターで、複数の分析ツールを一つの統合システムにまとめています。独自の出来高加重平均価格(VWAP)手法を使用してすべての計算を自動で行い、主観的な解釈を完全に排除します。 このインジケーターは、すべての資産クラス(FX、株式、指数、商品、暗号通貨)およびM1から月足までのすべての時間軸で動作します。基本原理は「価格は出来高に従う」というものです。MERAVITHは機関投資家の出来高が集中するポイントを特定し、その集中から数学的に正確な価格レベルを導き出します。予測や投機は行わず、計算のみを行います。 MERAVITH SCANNERを使用すると、28の主要FX通貨ペアをすべての時間軸でわずか2~3分でスキャンできます。また、任意の市場をスキャンすることも可能です。例えば、約100銘柄の株式を約10分でスキャンできます。 インジケーターは、消耗レベル、均衡線、偏差、統計レベル、およびターゲット予測を算出します。 チャート要素 Origin Point :すべての計算が始まる起点です。イン
Horizont は、エントリーポイント、ターゲット1、ターゲット2、ストップロスを含む完全なトレードセットアップを提供するトレーディングシステムです。これらはすべて自動で計算されます。 システムは市場の高値と安値を自動的に検出し、それらを結んで現在のトレンドを定義します。どのトレンドで取引するかを選択すると、Horizont が対応するエントリー、ターゲット、ストップのレベルを生成します。 本システムには自動リスク管理機能が含まれています。口座残高を確認し、リスクを計算したうえで、適切なポジションサイズを提案します。リスクリワード比(R:R)は第1ターゲットに対してのみ表示されます。 計算は即時に行われます。ほかの取引機会を探したい場合は、通貨パネルをクリックして銘柄を切り替え、より良い R:R 比率を探すことができます。 本システムは主に Forex に焦点を当てていますが、金属、指数、暗号資産の取引も可能です(現在はベータ版であり、すべてのブローカーに対応しているとは限りません)。 システムは各セットアップごとに評価付きのシグナルを生成します。シグナルは星1つ、2つ、3つで評価さ
このインジケーターは、MetaTrader 4 および 5 用のインタラクティブなエリオット波動ラベリングツールです。 チャート上のメニューから、ラベルのサイズ、色、波動の種類(ABC修正波、5波のインパルス、またはWXY構造)を選択し、チャート上に直接波動ラベルを手動で配置することができます。 チャートを1回クリックするだけで、選択した価格と時間の位置に適切な波動ラベルが順番に配置され、エリオット波動構造を視覚的に整理・把握するのに役立ちます。 気に入ったら評価してください! このインジケーターは、MetaTrader 4 および 5 用のインタラクティブなエリオット波動ラベリングツールです。 チャート上のメニューから、ラベルのサイズ、色、波動の種類(ABC修正波、5波のインパルス、またはWXY構造)を選択し、チャート上に直接波動ラベルを手動で配置することができます。 チャートを1回クリックするだけで、選択した価格と時間の位置に適切な波動ラベルが順番に配置され、エリオット波動構造を視覚的に整理・把握するのに役立ちます。 気に入ったら評価してください!
FREE
Meravith Autoは、Meravithトレーディングシステムの自動化バージョンです。 このインジケーターは、色が変化するトレンドラインで構成されています。強気のときは緑色、弱気のときは赤色になります。これはトレンドのサポートラインです。強気の出来高と弱気の出来高が等しくなる流動性ライン。三重の強気デビエーションライン。三重の弱気デビエーションライン。大きな出来高を示す紫色と青色のドット。紫色のドットは平均出来高より2つのデビエーション分大きい出来高を示し、青色のドットは2つのデビエーションを示します。 使い方は? 強気のトレンドラインと、トレンドラインの上にある流動性は強気トレンドを示します。市場は上昇すると予想されます。ロングポジションを開きます。 弱気のトレンドラインと、トレンドラインの下にある流動性は弱気トレンドを示します。市場は下落すると予想されます。ショートポジションを開きます。 他のインジケーターと自由に組み合わせて使用できます。 どの通貨ペア、どの時間足でも使用できます。 ブローカーが提示する出来高の違いにより、結果が異なる場合があります。 出来高が多いため、大
市場のボラティリティに応じて計算期間を自動的に調整し、より正確な買われ過ぎ・売られ過ぎのシグナルを提供する高度なモメンタム・オシレーターです。 仕組み このインジケーターは適応型の期間計算を使用しており、ボラティリティが高いときは期間を短くし、低いときは期間を長くします。この動的な調整により、トレンド相場ではより速いシグナルを提供し、レンジ相場ではダマシを減らします。 RSI の値はこの可変期間に基づいて計算されるため、現在の市場状況により敏感に反応します。従来の 30(売られ過ぎ)と 70(買われ過ぎ)の水準を使用しますが、適応型であるため、これらの水準に到達する際の重要性が高まります。 主な特徴: 市場のボラティリティに基づいて計算期間を自動調整 売買タイミングを示す矢印をチャートに表示 カラーオシレーター:50 以上は緑、50 未満は赤 トレンド相場での高速な反応 レンジ相場でのダマシの減少 リペイントなしのインジケーター ― ローソク足確定後に値は固定 すべての時間足およびすべての市場で使用可能
FREE
Meravith Autoは、Meravithトレーディングシステムの自動化バージョンです。 このインジケーターは、色が変化するトレンドラインで構成されています。強気のときは緑色、弱気のときは赤色になります。これはトレンドのサポートラインです。強気の出来高と弱気の出来高が等しくなる流動性ライン。三重の強気デビエーションライン。三重の弱気デビエーションライン。大きな出来高を示す紫色と青色のドット。紫色のドットは平均出来高より2つのデビエーション分大きい出来高を示し、青色のドットは2つのデビエーションを示します。 使い方は? 強気のトレンドラインと、トレンドラインの上にある流動性は強気トレンドを示します。市場は上昇すると予想されます。ロングポジションを開きます。 弱気のトレンドラインと、トレンドラインの下にある流動性は弱気トレンドを示します。市場は下落すると予想されます。ショートポジションを開きます。 他のインジケーターと自由に組み合わせて使用できます。 どの通貨ペア、どの時間足でも使用できます。 ブローカーが提示する出来高の違いにより、結果が異なる場合があります。 出来高が多いため、大手
このインジケーターは、MetaTrader 4 および 5 用のインタラクティブなエリオット波動ラベリングツールです。 チャート上のメニューから、ラベルのサイズ、色、波動の種類(ABC修正波、5波のインパルス、またはWXY構造)を選択し、チャート上に直接波動ラベルを手動で配置することができます。 チャートを1回クリックするだけで、選択した価格と時間の位置に適切な波動ラベルが順番に配置され、エリオット波動構造を視覚的に整理・把握するのに役立ちます。 気に入ったら評価してください! このインジケーターは、MetaTrader 4 および 5 用のインタラクティブなエリオット波動ラベリングツールです。 チャート上のメニューから、ラベルのサイズ、色、波動の種類(ABC修正波、5波のインパルス、またはWXY構造)を選択し、チャート上に直接波動ラベルを手動で配置することができます。 チャートを1回クリックするだけで、選択した価格と時間の位置に適切な波動ラベルが順番に配置され、エリオット波動構造を視覚的に整理・把握するのに役立ちます。 気に入ったら評価してください!
FREE
このインディケータは、選択した期間における強気と弱気の不均衡を測定し、2 点間の直線を示す。 強気派が弱気派より出来高が多ければ、線は緑色に変わる。 ベアの方が出来高が多い場合、線は赤になる。 線は、出来高の差のパーセンテージも示します。 このインジケーターは、同じデータを別ウィンドウで表示します。また、分割された出来高を見ることもできます。 このインジケーターには2つのモードがあります。 そのために、左上にボタンがあります、  - ボタンを押さなければ、市場の任意のポイントと現在の価格との間の不均衡を測定します。 - ボタンを押すと、市場の任意の2点間のバランスを測定できます。 このインディケータは、選択した期間における強気と弱気の不均衡を測定し、2 点間の直線を示す。 強気派が弱気派より出来高が多ければ、線は緑色に変わる。 ベアの方が出来高が多い場合、線は赤になる。 線は、出来高の差のパーセンテージも示します。 このインジケーターは、同じデータを別ウィンドウで表示します。また、分割された出来高を見ることもできます。 このインジケーターには2つのモードがあります
マーケットメーカーのためのツール。 Meravith は次の機能を提供します: すべての時間足を分析し、現在有効なトレンドを表示します。 強気と弱気の出来高が等しくなる流動性ゾーン(出来高均衡)を強調表示します。 異なる時間足のすべての流動性レベルをチャート上に直接表示します。 テキスト形式の市場分析を生成し、参考情報として表示します。 現在のトレンドに基づいて目標値、サポートレベル、ストップロスを計算します。 取引のリスクリワード比を算出します。 口座残高に基づいてポジションサイズを計算し、潜在的な利益を推定します。 また、市場に大きな変化があった場合には警告を表示します。 インジケーターの主要ライン: 強気/弱気の出来高エグゾーストライン ― 目標値として機能します。 市場のトレンドを示すライン。市場が強気か弱気かによって色が変わり、トレンドのサポートとして機能します。主にその色が市場センチメントを示します。 出来高均衡ライン(Eq)。Eq(Volume Equilibrium)ラインはシステムの中核です。これは買い手と売り手の出来高のバランスポイントを表します。市場の流動性を示し
価格のみに基づいてレベルを計算する、非常に珍しいインジケーターの一つです。このインジケーターは、時間足やトレンド、市場サイクルの影響を受けません。これまでに作られた中で最も論理的なインジケーターの一つです。 FIFTY インジケーターは、現在自動化バージョンとして登場し、レベルを手動で描画する必要がなくなりました。このバージョンでは、日足・週足・月足・年足のレベルが自動でチャートに描画され、正確さと時間の節約を実現します。さらに、各レベルの表示を切り替えるためのボタンも用意されており、完全にカスタマイズが可能です。手動を好む方のために、無料版も引き続き利用可能で、十分に機能します。トレーダーは自分の取引スタイルに応じて、手動と自動のツールを選ぶことができます。 非常に信頼性が高く、強くおすすめします!手動版の FIFTY インジケーターをご希望の方は、お問い合わせください
Naturu
Ivan Stefanov
5 (1)
「Naturu(ナチュル)」は自然の対称性をアルゴリズムとして用いる手動インジケーターです。 シンプルな戦略と隠された知恵でマーケットを制覇しましょう! インジケーターを読み込むと、上側(Top)と下側(Bottom)の2本のラインが表示されます。 ラインを一度クリックするとアクティブ化され、移動させたいローソク足をクリックするだけでその位置に移動できます。 高値ポイントと安値ポイントを設定すると、インジケーターが自動的に以下を計算します: マゼンタのゾーン:ブル(買い勢)とベア(売り勢)の関心が最も接近する、サポート/レジスタンスになりやすいエリア グレーのゾーン:次に注目されるエリア アクア色のライン:ブルの価格目標 ゴールド色のライン:ベアの価格目標 手動インジケーターは完全なコントロールと柔軟性を提供し、リアルタイムの相場状況や個人の直感に応じてラインを調整できます。 価格の動きを自ら深く分析することで、サポートやレジスタンス、チャートパターンの形成を本質的に理解できます。 人間の判断を活かすことで、自動システムが誤認しがちなノイズを除去し、誤シグナルを減らします。 また、自分
Sense
Ivan Stefanov
5 (2)
SENSEは、厳選されたGANN手法とフラクタル計算を組み合わせた自動システムです。このシステムは、どこで取引を開始し、どこで決済するかを教えてくれます。もう複雑な計算に時間を費やす必要はありません。インジケータをインストールするだけです。 基本原則: 価格が白い線の上にある時、市場は強気である。 白い線の上で買い、下で止める 緑線は上値目標 白い線より下にあるときは弱気。 白い線より下で売り、上で止める。 赤線は下値目標 緑または赤の線が二重になっている場合は、強いエリアであることを示す。 なぜSENSEなのか? 利益目標 SENSEは自動的に利益確定のターゲットを設定し、取引の成功を最大化するお手伝いをします。 自動適応: このインディケータは、どのような時間枠に対しても自動的に再計算を行い、手動で調整する必要なく、正確で信頼性の高いシグナルを提供します。 スキャルピングにも最適です。 デモをチェック
このインディケータは、外為市場のティックボリュームを強気と弱気に効果 的に分けます。  さらに、選択した任意の期間の強気と弱気のティックボリュームの合計を計算し、表示する機能を提供します。  チャート上の2本の青い線を動かすことで簡単に期間を調整でき、お客様の取引ニーズに合わせたカスタマイズ可能で正確な出来高分析が可能です。  もしお役に立つようでしたら、レビューをお寄せください!  それでは、良いお取引を! このインディケータは、外為市場のティックボリュームを強気と弱気に効果 的に分けます。 さらに、選択した任意の期間の強気と弱気のティックボリュームの合計を計算し、表示する機能を提供します。 チャート上の2本の青い線を動かすことで簡単に期間を調整でき、お客様の取引ニーズに合わせたカスタマイズ可能で正確な出来高分析が可能です。 もしお役に立つようでしたら、レビューをお寄せください! それでは、良いお取引を!
FREE
2 SNAKES  is a first class scalping system. As the entries are quite precise, you are likely to become addicted to this system very quickly.  You have 2 snakes. When you see a candle above or below them that does not touch them - that is your scalping signal. Then buy or sell at the green line or close. If you use a larger time frame, scalping can become trend following. The snakes are calculated precisely in relation to the current state of the market. They ARE NOT moving averages.  You decide
Enigmera
Ivan Stefanov
5 (8)
ENIGMERA: 市場の中心 重要:MQL5.comのデモはStrategy Testerで実行されており、Enigmeraの機能を完全には反映していない場合があります。詳細については、説明、スクリーンショット、ビデオをご確認ください。質問があれば、遠慮なくメッセージを送ってください! インジケーターのコードは完全に書き直されました。バージョン3.0は新機能を追加し、インジケーターの開始以来蓄積されたバグを修正しました。 紹介 このインジケーターとトレーディングシステムは、金融市場への注目すべきアプローチです。ENIGMERAはフラクタルサイクルを使用して、サポートとレジスタンスのレベルを正確に計算します。真の蓄積フェーズを示し、方向と目標を提供します。トレンドでも修正でも機能するシステムです。 動作方法 インジケーターのほとんどの機能は、チャートの左側にあるボタンで制御され、市場の状況に迅速に対応できるようになっています。 ボタン ON/OFF – インジケーター全体を表示または非表示にします。 Channel – サポートチャネルを有効にし、許容範囲の偏差を示します。 Dev
Levelss
Ivan Stefanov
5 (1)
LEVELSSインディケータが示す: - 日足の強気ゾーンと弱気ゾーン。毎日00:00から23:59まで表示。 - 週足の強気・弱気ゾーン。毎週月曜日0:00から金曜日23:59まで表示されます。 - 特定のタイムフレームから特別に計算されたチャネルで、他のすべてのタイムフレームに表示されます。デフォルトでは、これは4時間のタイムフレームで、取引したい他のタイムフレームに変更することができます。これはノンストップで計算されます。 画面の左上には、ゾーンとチャネルが強気、弱気、中立のいずれであるかが表示されています。この3つすべてが強気の場合、現在のローソク足に緑の点が表示されます。3つとも弱気の場合、ピンクの点が表示されます。 このインディケータに制限はありません。
GANNの正確な目標は、彼の時代を超えた方法に基づいて計算され、目の前に提示されます。このツールは、取引をよりスムーズで直感的にするために設計されています。白いラインを上に、または緑のラインを下に動かすことで、なぜGANNの技法が取引の世界で今なお影響力を持っているのかがすぐにわかるでしょう。 GANNの戦略は、市場の動きを高精度で予測することに焦点を当てており、このツールはその力をあなたの手元に提供します。経験豊富なトレーダーであっても、初心者であっても、ラインを操作することで、彼の手法がなぜ時の試練に耐えてきたのかを深く理解することができるでしょう。 GANNの正確な目標は、彼の時代を超えた方法に基づいて計算され、目の前に提示されます。このツールは、取引をよりスムーズで直感的にするために設計されています。白いラインを上に、または緑のラインを下に動かすことで、なぜGANNの技法が取引の世界で今なお影響力を持っているのかがすぐにわかるでしょう。 GANNの戦略は、市場の動きを高精度で予測することに焦点を当てており、このツールはその力をあなたの手元に提供します。経験豊富なトレーダーであっ
The indicator displays support and resistance zones defined logically using the MACD. The entire concept is explained in the video, with specific examples shown. The indicator works on any instruments and timeframes. It does not repaint. After placing it on the chart, please go through all the timeframes sequentially, from monthly to 1-minute, so that all lines load correctly. After that, you can start using it. The concept is unique and has not been seen in other systems or indicators.
FIFTYインジケーターは、手動でレベルを描画する必要がない自動バージョンを提供するようになりました。このバージョンでは、日次、週次、月次、年次のレベルが自動的にチャート上に描画され、精度を確保しながら時間を節約できます。さらに、これらのレベルの表示を切り替えるボタンが用意されており、完全なカスタマイズが可能です。手動操作を好む方のために、無料版のインジケーターも引き続き利用可能で、完全な機能を備えています。トレーダーは、自分の取引スタイルに応じて手動ツールと自動ツールを選択できます。 最も論理的なインジケーターの一つ。 高い信頼性。 FIFTYインジケーターは、手動でレベルを描画する必要がない自動バージョンを提供するようになりました。このバージョンでは、日次、週次、月次、年次のレベルが自動的にチャート上に描画され、精度を確保しながら時間を節約できます。さらに、これらのレベルの表示を切り替えるボタンが用意されており、完全なカスタマイズが可能です。手動操作を好む方のために、無料版のインジケーターも引き続き利用可能で、完全な機能を備えています。トレーダーは、自分の取引スタイルに応じて手動ツ
「Naturu(ナチュル)」は自然の対称性をアルゴリズムとして用いる手動インジケーターです。 シンプルな戦略と隠された知恵でマーケットを制覇しましょう! インジケーターを読み込むと、上側(Top)と下側(Bottom)の2本のラインが表示されます。 ラインを一度クリックするとアクティブ化され、移動させたいローソク足をクリックするだけでその位置に移動できます。 高値ポイントと安値ポイントを設定すると、インジケーターが自動的に以下を計算します: マゼンタのゾーン:ブル(買い勢)とベア(売り勢)の関心が最も接近する、サポート/レジスタンスになりやすいエリア グレーのゾーン:次に注目されるエリア アクア色のライン:ブルの価格目標 ゴールド色のライン:ベアの価格目標 手動インジケーターは完全なコントロールと柔軟性を提供し、リアルタイムの相場状況や個人の直感に応じてラインを調整できます。 価格の動きを自ら深く分析することで、サポートやレジスタンス、チャートパターンの形成を本質的に理解できます。 人間の判断を活かすことで、自動システムが誤認しがちなノイズを除去し、誤シグナルを減らします。 また、自
MACD Divergence Pulse — 4色ヒストグラム、アラート、ダッシュボード付きのスマートダイバージェンススキャナー 短い説明 プロフェッショナルMACDインジケーター。レギュラー&隠れダイバージェンスを自動検出、4色ダイナミックヒストグラム、買い/売り矢印、シグナルラベル、リアルタイムダッシュボード、多チャンネルアラート。どんなシンボル・時間足でも動作。 詳細説明 MACD Divergence Pulseは、クラシックMACDオシレーターを次のレベルへ引き上げます。レギュラーと隠れダイバージェンスを自動検出し表示、価格チャートとMACDサブウィンドウにラインを描画、矢印を配置、シグナルラベルを表示、生ダッシュボードを提供 — すべて軽量シングルインジケーターで実現。 トレーダーがMACD Divergence Pulseを選ぶ理
RSI Divergence Pulse — Smart Divergence Scanner with MTF Panel, Zone Fill, Alerts & Dashboard SHORT DESCRIPTION Professional RSI indicator with automatic Regular & Hidden divergence detection, color-coded RSI line, Multi-Timeframe panel, OB/OS zone fills, Buy/Sell arrows, signal labels, real-time dashboard, and multi-channel alerts. Works on any symbol and timeframe. FULL DESCRIPTION
Enigmera MT5
Ivan Stefanov
3.67 (3)
ENIGMERA:市場の核心 (これは手動インジケーターであり、MetaTrader の現在のテスト環境では一部の機能がサポートされない場合があります) イントロダクション このインジケーターおよびトレーディングシステムは、金融市場に対する独自のアプローチを提供します。ENIGMERA はフラクタルサイクルを利用して、サポートおよびレジスタンスレベルを正確に算出します。実際の蓄積フェーズを示し、方向性と目標を明確にします。トレンド相場でも調整局面でも機能するシステムです。 仕組み インジケーターのほとんどの機能は、チャート左側のボタンを通じて操作され、市場の変化に素早く対応できます。 ボタン ON/OFF – インジケーター全体の表示/非表示を切り替えます。 Support – トレンドのメインサポートライン。 Ch – サポートチャネルを有効にし、許容される乖離範囲を示します。 Dev1(第1偏差)– サポート範囲内の価格変動を示し、市場の停滞またはエネルギー蓄積を示唆します。 Dev2(第2偏差)– 偏差間の価格変動を示し、トレンド形成と方向性を示します。 Dev3(第3偏差)–
伝説のウィリアム・ギャン(William Gann)レベルを完全自動で表示するMT5用インジケーター。GANN Masterは日足・週足・月足のデータに基づき、価格が反転またはトレンド継続しやすい重要ゾーンを瞬時にプロットします。 主な機能 ワンクリック期間選択 :Daily/Weekly/Monthlyボタンをクリックするだけで、当日・当週・当月のゾーンを即時表示 自動&手動モード 自動モード :GANN Masterがスイング高値・安値を自動検出し、すべてのギャンレベルを計算 手動モード :チャート上のTopラインとBottomラインをドラッグして任意のスイングポイントを設定、レベルが即座に再計算 強気/弱気レベル :買い/売りそれぞれのレベルを表示。線が接近すると強固なサポート/レジスタンスゾーンを示唆 幅広い銘柄対応 :Forex、貴金属(例:ゴールド)、株価指数、暗号資産など高額商品にも対応。設定でアセットクラスを切り替えるだけでスケールと乗数が自動調整 ユーザーフレンドリーなインターフェース :鮮やかな配色、見やすいラベル、直感的なボタン操作でリアルタイムにレベルを調整 ト
SPEKULATORは、重要なサポートゾーンと市場の方向性を特定するのに役立つ手動取引システムおよびインジケーターです。 シンプルな戦略と隠れた知恵で市場をマスターしましょう。 グラフ上で任意のトップ(TOP)とボトム(BOTTOM)を選択すると、インジケーターは次のように描画します: あなたのトレンドに対するサポートゾーン。 強気トレンドの場合、緑色のゾーンが表示され、弱気トレンドの場合、赤色のゾーンが表示されます。サポートゾーンの感度はインジケーターの設定で調整可能です。このゾーンは、選択したトレンドに基づいてサポートが現れる可能性のある場所を示します。 高い偏差線と低い偏差線 W.D. ガンの9のスクエアに基づいて計算された角度線 取引に入るタイミング: 高い偏差線を上に突破した場合、ロングポジションを取ります。 低い偏差線を下に突破した場合、ショートポジションを取ります。 市場が偏差線の間にある場合、その間で買いと売りを行いながら、サポートゾーンを尊重します。 ガンの角度線は利益確定ゾーンとしてガイドラインとして使用されます。 360度線が重要なレベルです: 価格がその上にある
MACD Divergence Pulse — 4色ヒストグラム、アラート、ダッシュボード付きのスマートダイバージェンススキャナー 短い説明 プロフェッショナルMACDインジケーター。レギュラー&隠れダイバージェンスを自動検出、4色ダイナミックヒストグラム、買い/売り矢印、シグナルラベル、リアルタイムダッシュボード、多チャンネルアラート。どんなシンボル・時間足でも動作。 詳細説明 MACD Divergence Pulseは、クラシックMACDオシレーターを次のレベルへ引き上げます。レギュラーと隠れダイバージェンスを自動検出し表示、価格チャートとMACDサブウィンドウにラインを描画、矢印を配置、シグナルラベルを表示、生ダッシュボードを提供 — すべて軽量シングルインジケーターで実現。 トレーダーがMACD Divergence Pulseを選ぶ理
フィルタ:
zeke21t2
336
zeke21t2 2026.02.15 13:00 
 

This is an amazing indicator that gives you a quick glimpse into the big picture, the most important aspect of trading: whether you should wait for a buying opportunity, a selling opportunity, or wait for the market to settle down. Simply avoiding false breakouts will dramatically improve your trading performance. For specific buying and selling opportunities, I highly recommend using it in conjunction with Meravith, another of the author's outstanding works. Pullback reversals and reversals from the top or bottom, which are entered based on chart highs and lows or volume changes, will become more effective. Honestly, I recommend this so much that I don't want anyone else to know about it :)

Max2233
565
Max2233 2025.07.08 10:33 
 

I would like to compliment this work of art composed by IVAN, a very precise indicator and in combination with his other jewels created by him, trading has simply become simpler and more intuitive. A round of applause to IVAN.

Mase
1739
Mase 2025.05.29 14:17 
 

Simply perfect! In combination with Ivan's other technical indicators, it is a powerful tool. Warning: highly addictive, as the indicators bring so much joy and success. Highly recommended.

レビューに返信