Transaction Speed MT5

5

当然,以下是翻译成中文(简体)的版本:

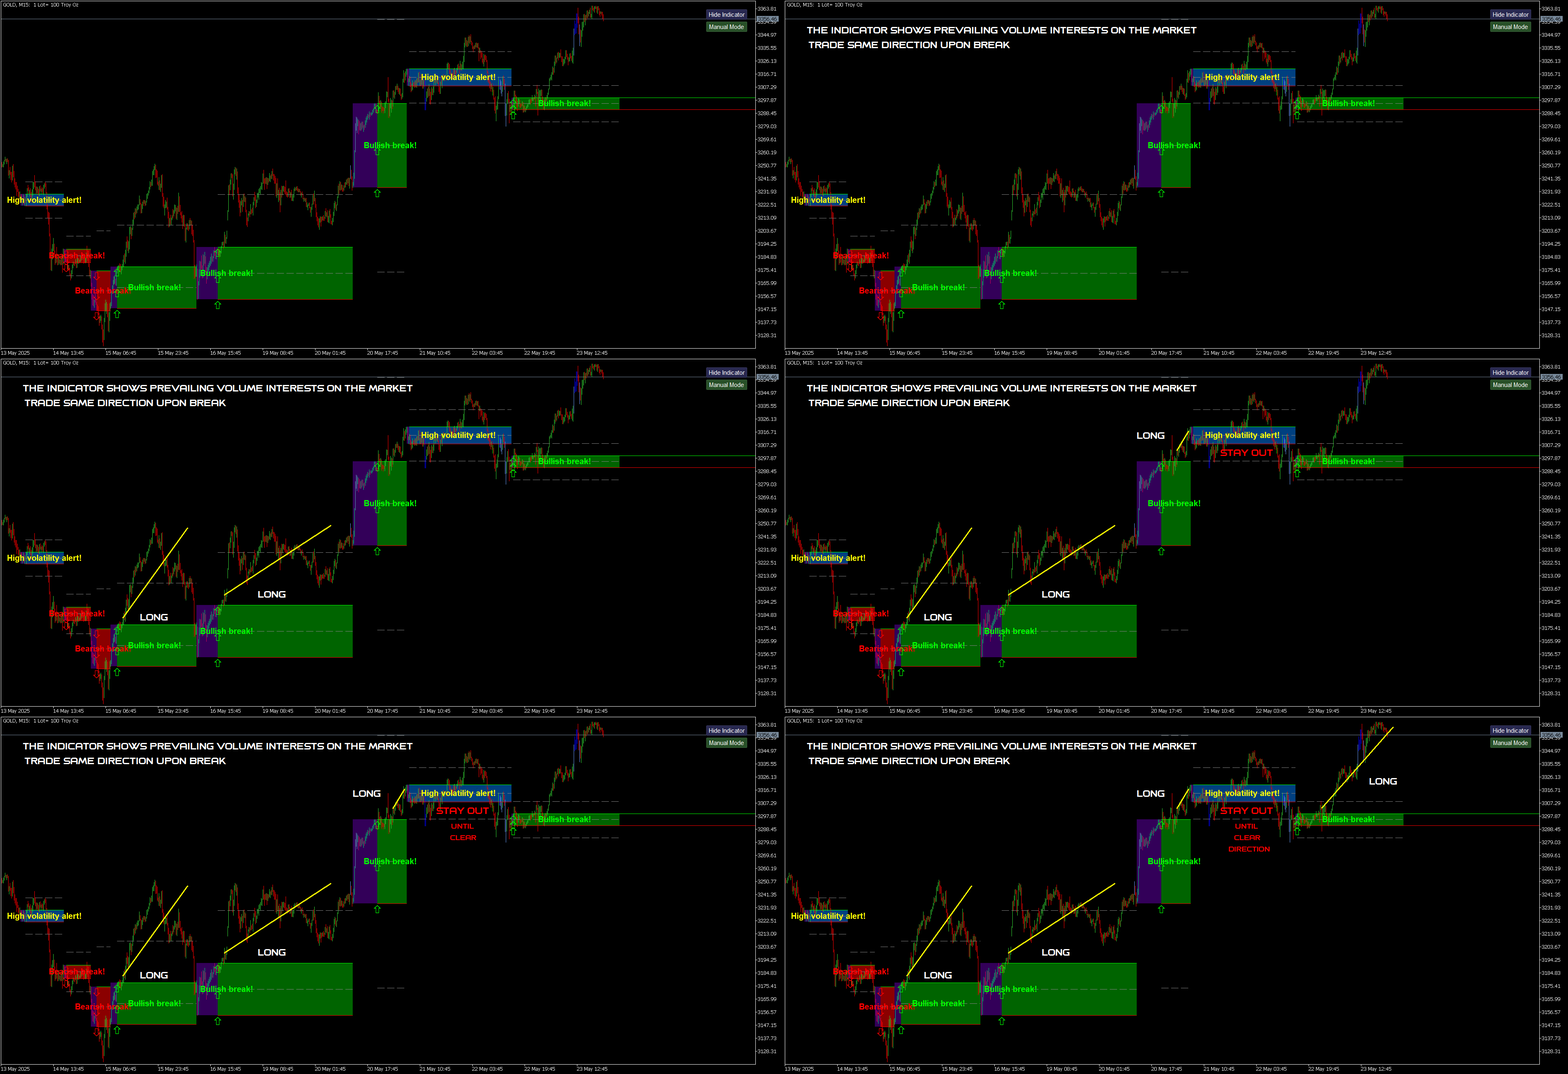
该指标标出市场中显现出交易兴趣的区域,并随后显示订单积累区域。它的工作方式类似于大规模的订单簿。
这是为大资金打造的指标,性能卓越。市场中有任何兴趣,你都能通过它清晰看到。

(这是一个完全重写的自动化版本 —— 不再需要手动分析。)
交易速度是一个全新的概念指标,它显示了市场上大订单何时、何地聚集,并揭示了其背后的意义。它可以在非常早期就检测到趋势的变化。
在外汇市场,所谓的“交易量”实际上是误导性的,因为那指的是价格在单位时间内的变化,因此真正的名称应是“交易速度”。
一切都取决于我们如何思考、如何行动、如何分析。改变分析范式至关重要。
该指标完全重构了外汇市场上“交易量”的概念,用逻辑方式重新定义并应用,从而成为一个独特而精准的工具。

使用方法:

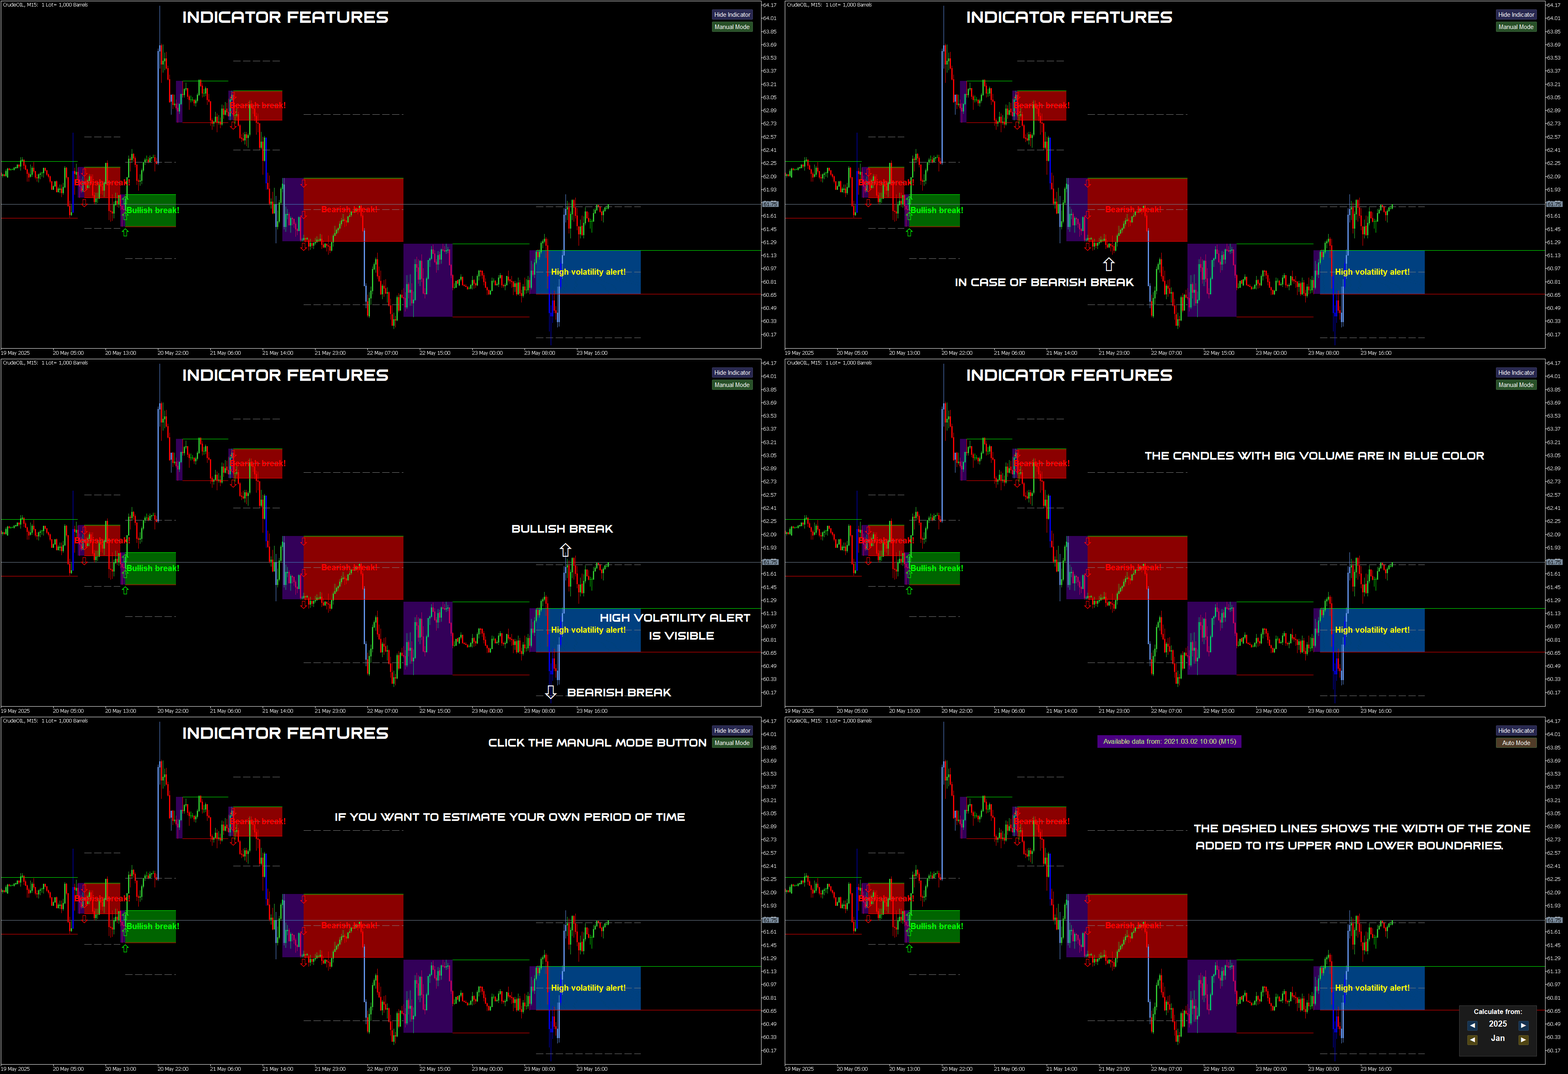
默认情况下,指标处于自动模式,可独立用于任何时间周期。如果你希望切换到手动模式,只需点击 Auto / Manual Mode 按钮即可。

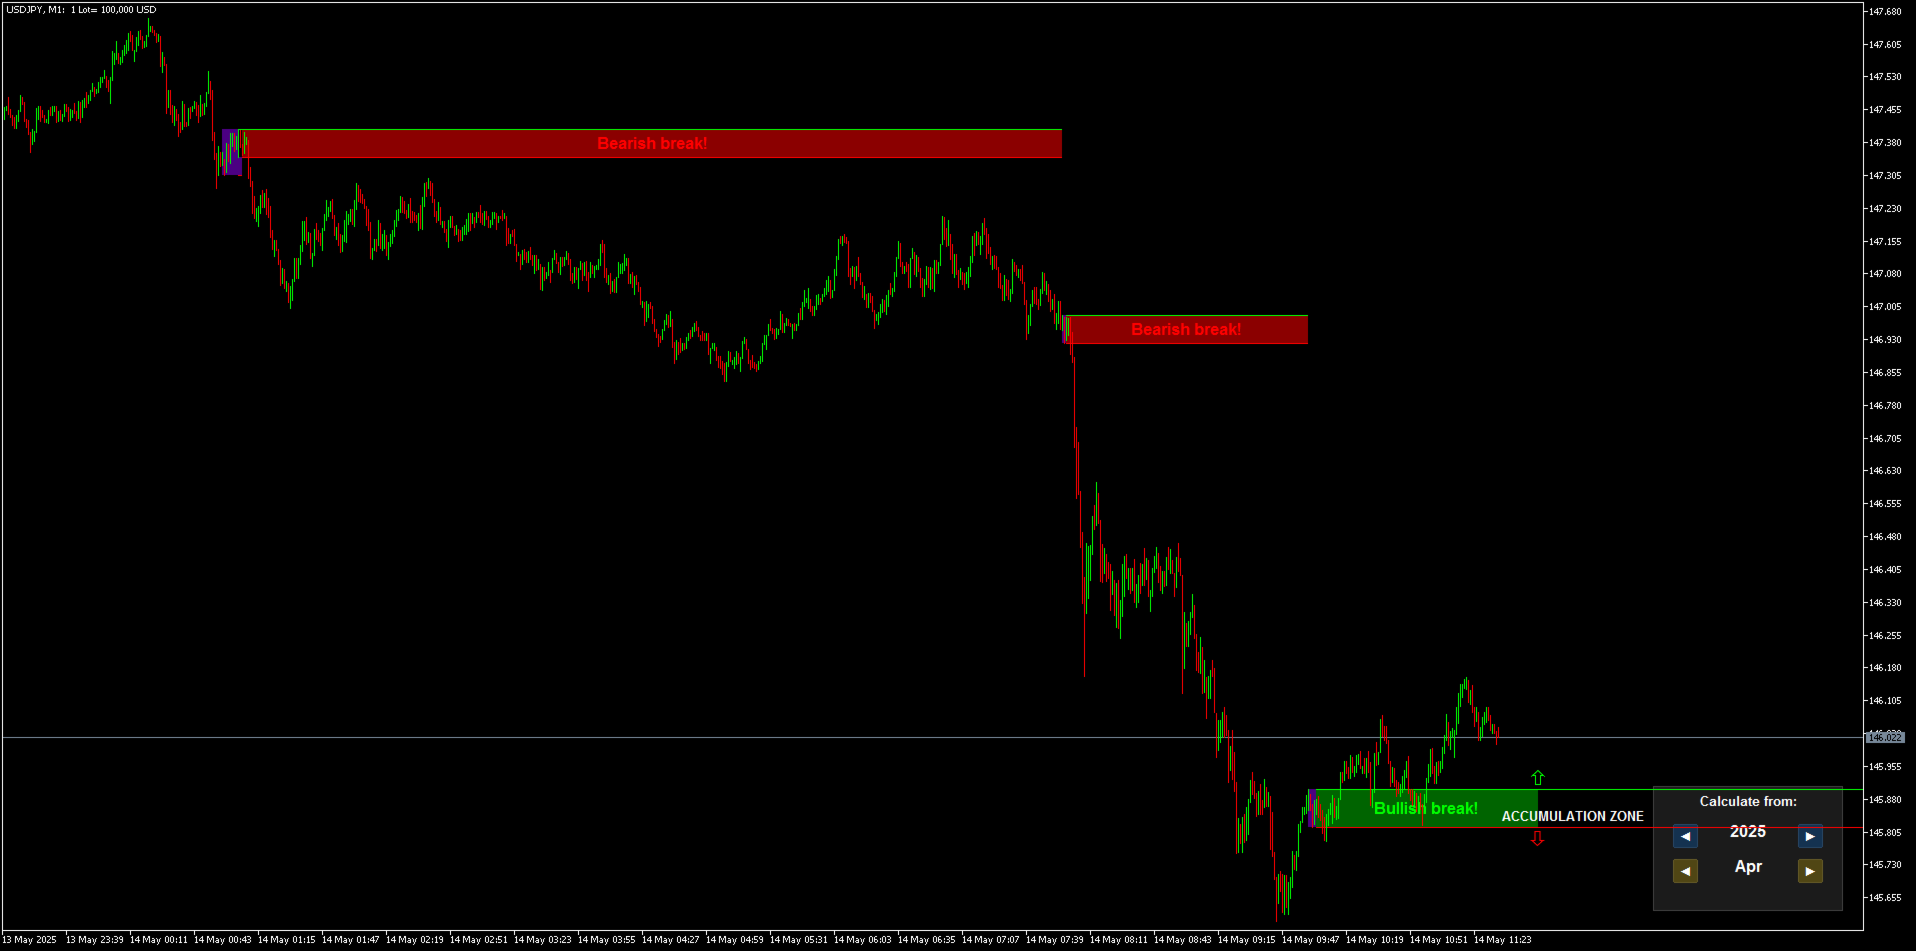
在手动模式下,所有计算从 2025年1月1日 开始。你可以根据需要更改该日期,以查看不同的分析结果。
最优数据周期为4至6个月,这可以确保涵盖多个市场周期,让分析结果更加稳健。
周期越长,识别出的区域数量越少。

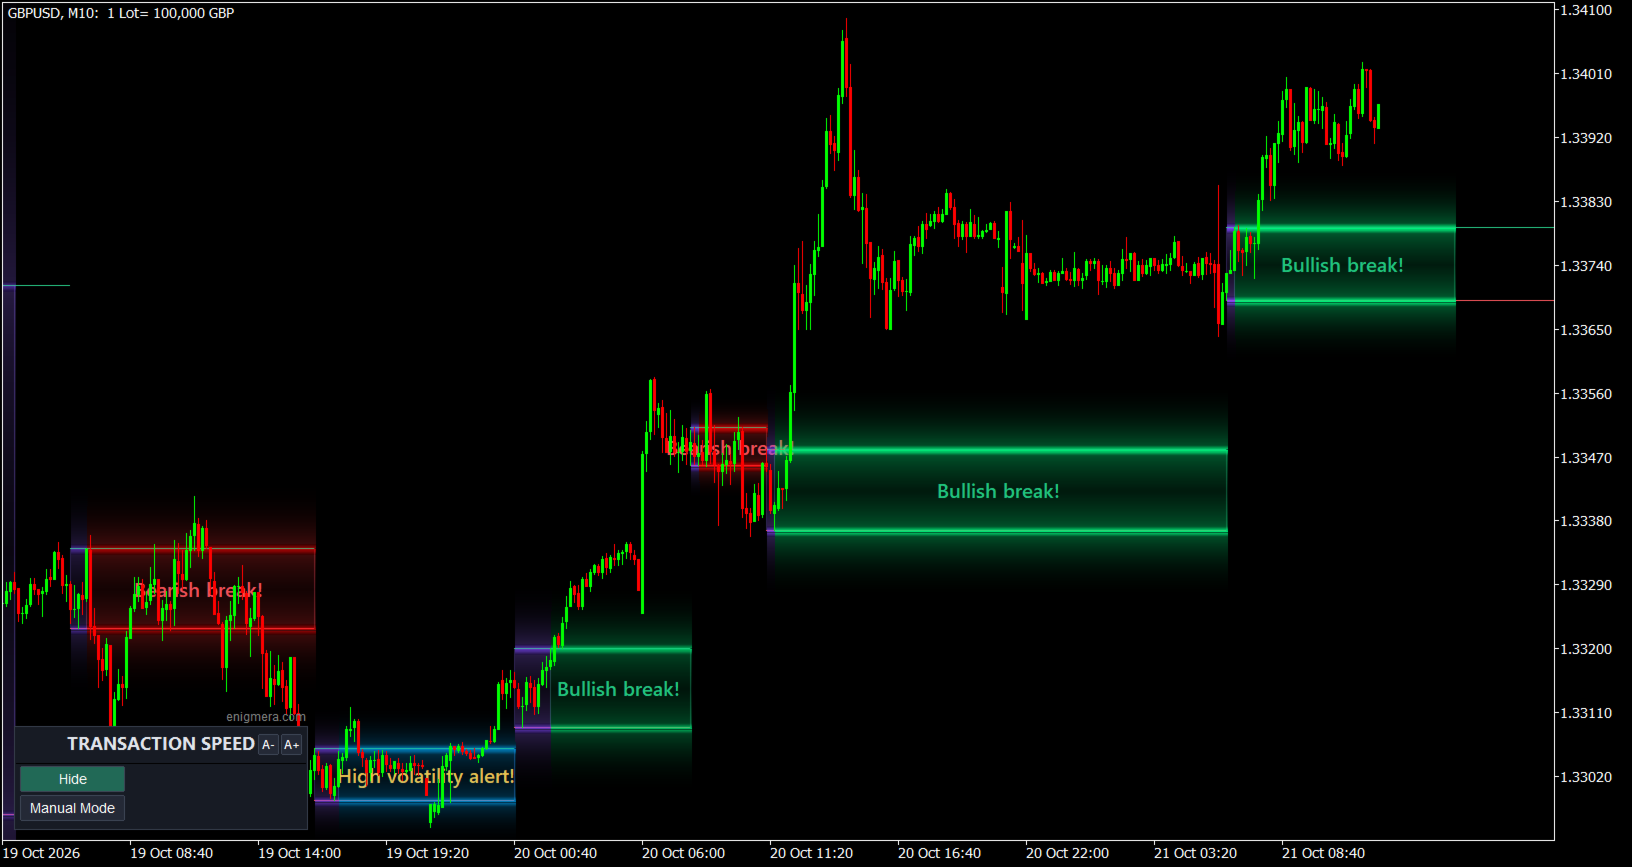
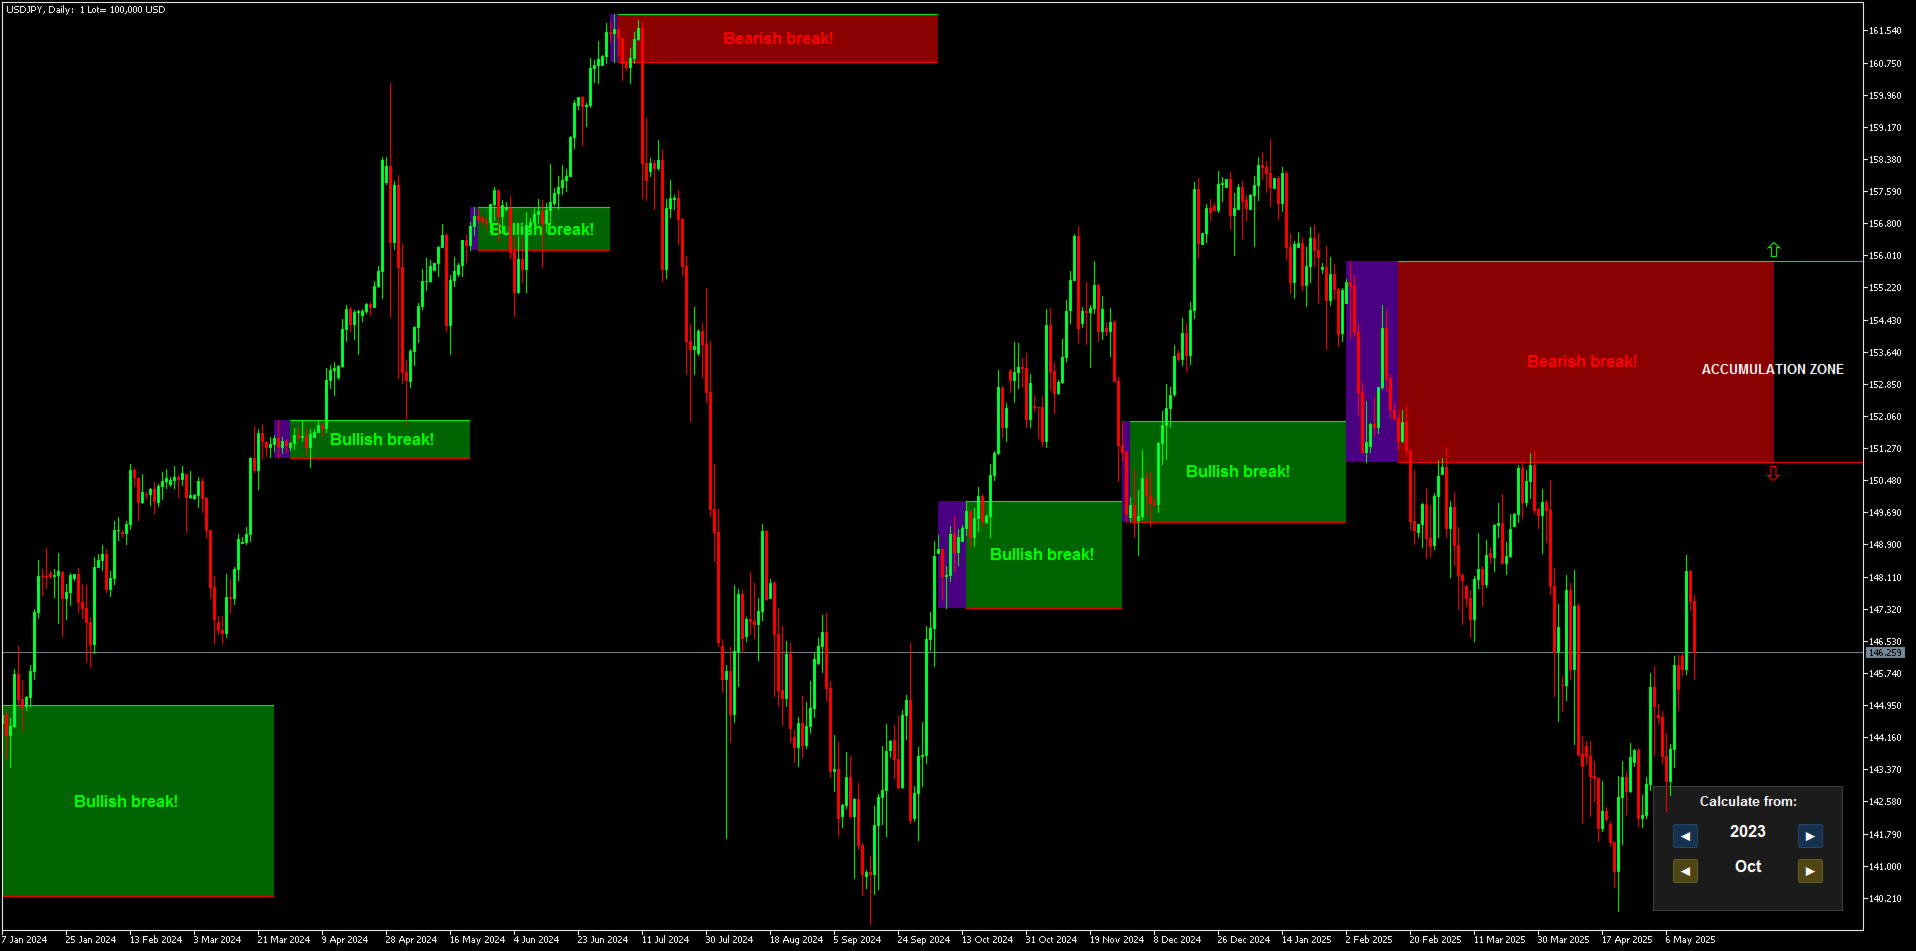
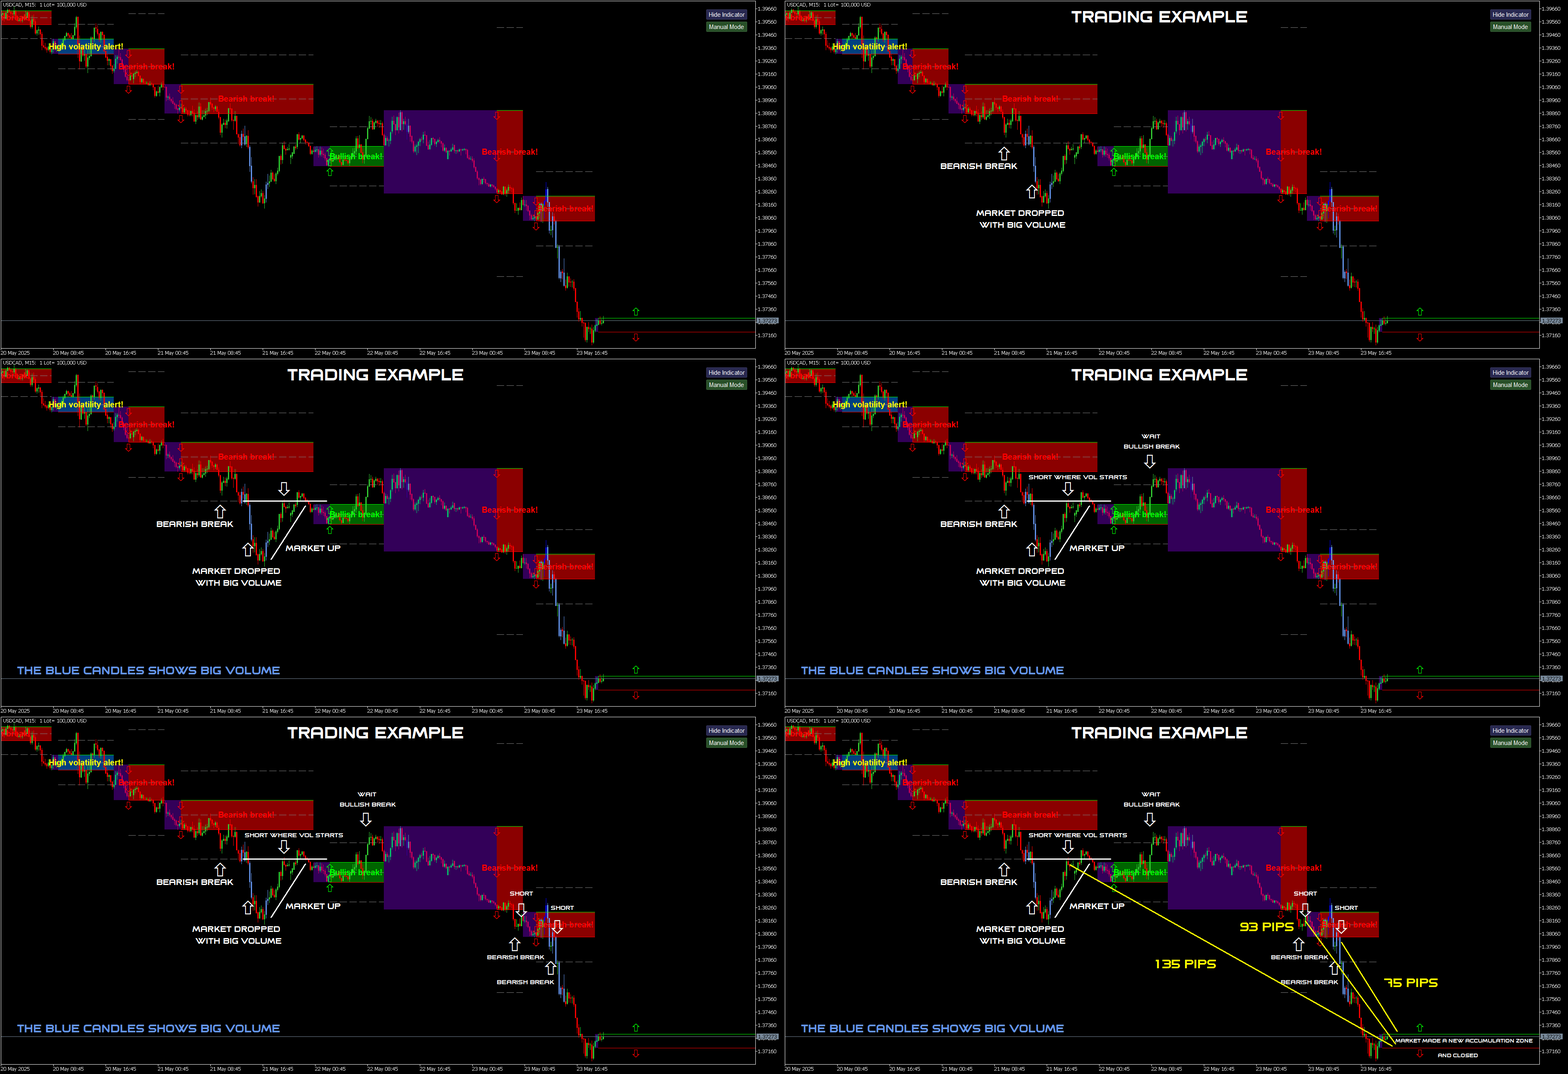
市场表现出明显兴趣的区域,会用紫色矩形标出。
随后,你将看到订单积累区域。

  • 如果市场突破积累区上方,则趋势为上涨,区域变为绿色;

  • 如果市场突破下方,则趋势为下跌,区域变为红色。

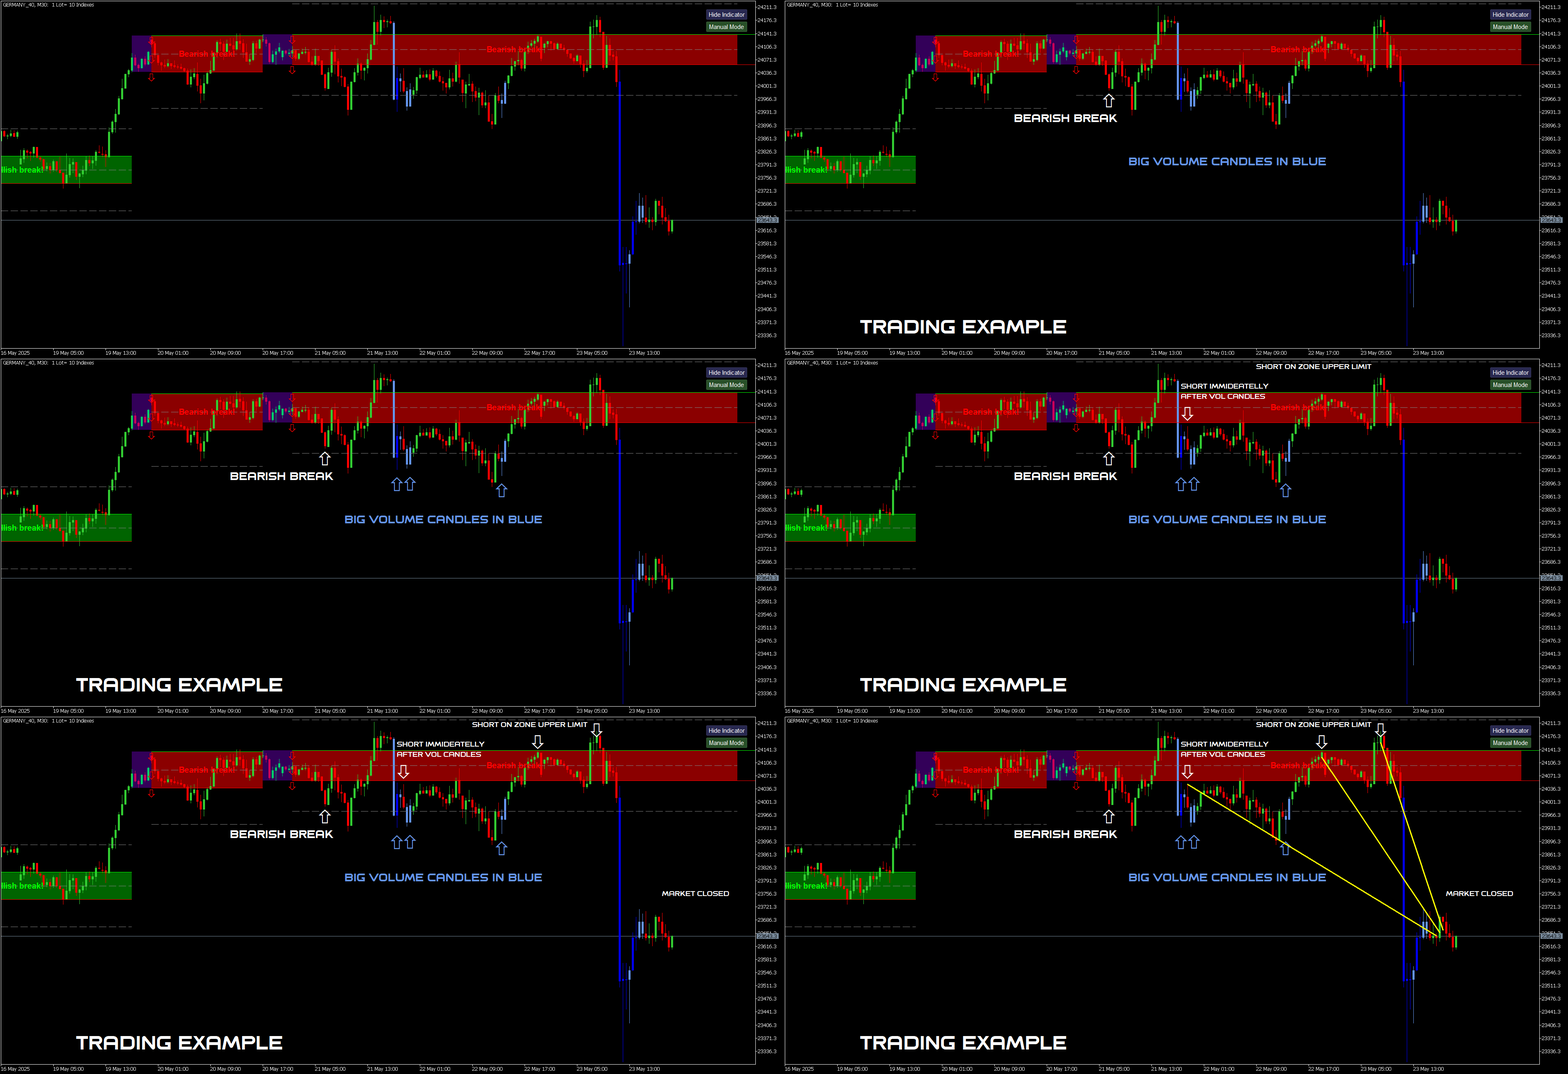
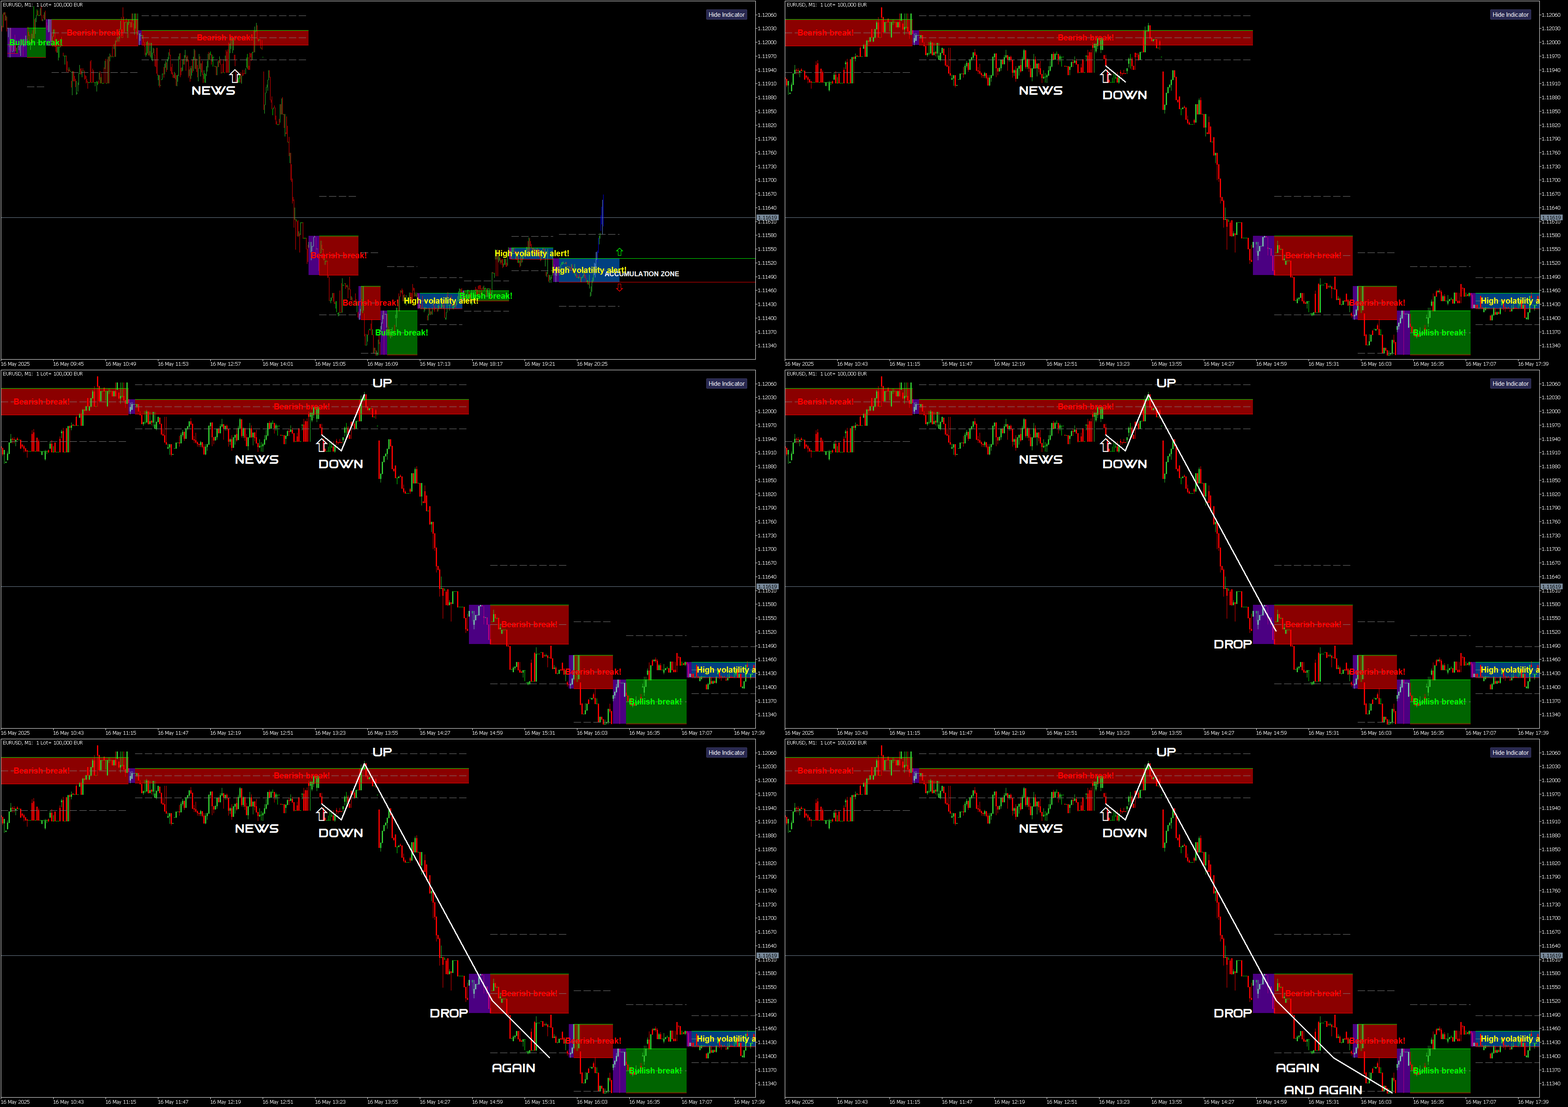
当一根K线完整地收于区域之外且未接触区域边缘,则视为真正突破。

当K线完全脱离订单积累区形成时,就构成了有效突破,明确显示了市场方向。
趋势将一直有效,直到出现相反方向的突破,或者市场出现新的兴趣区域。

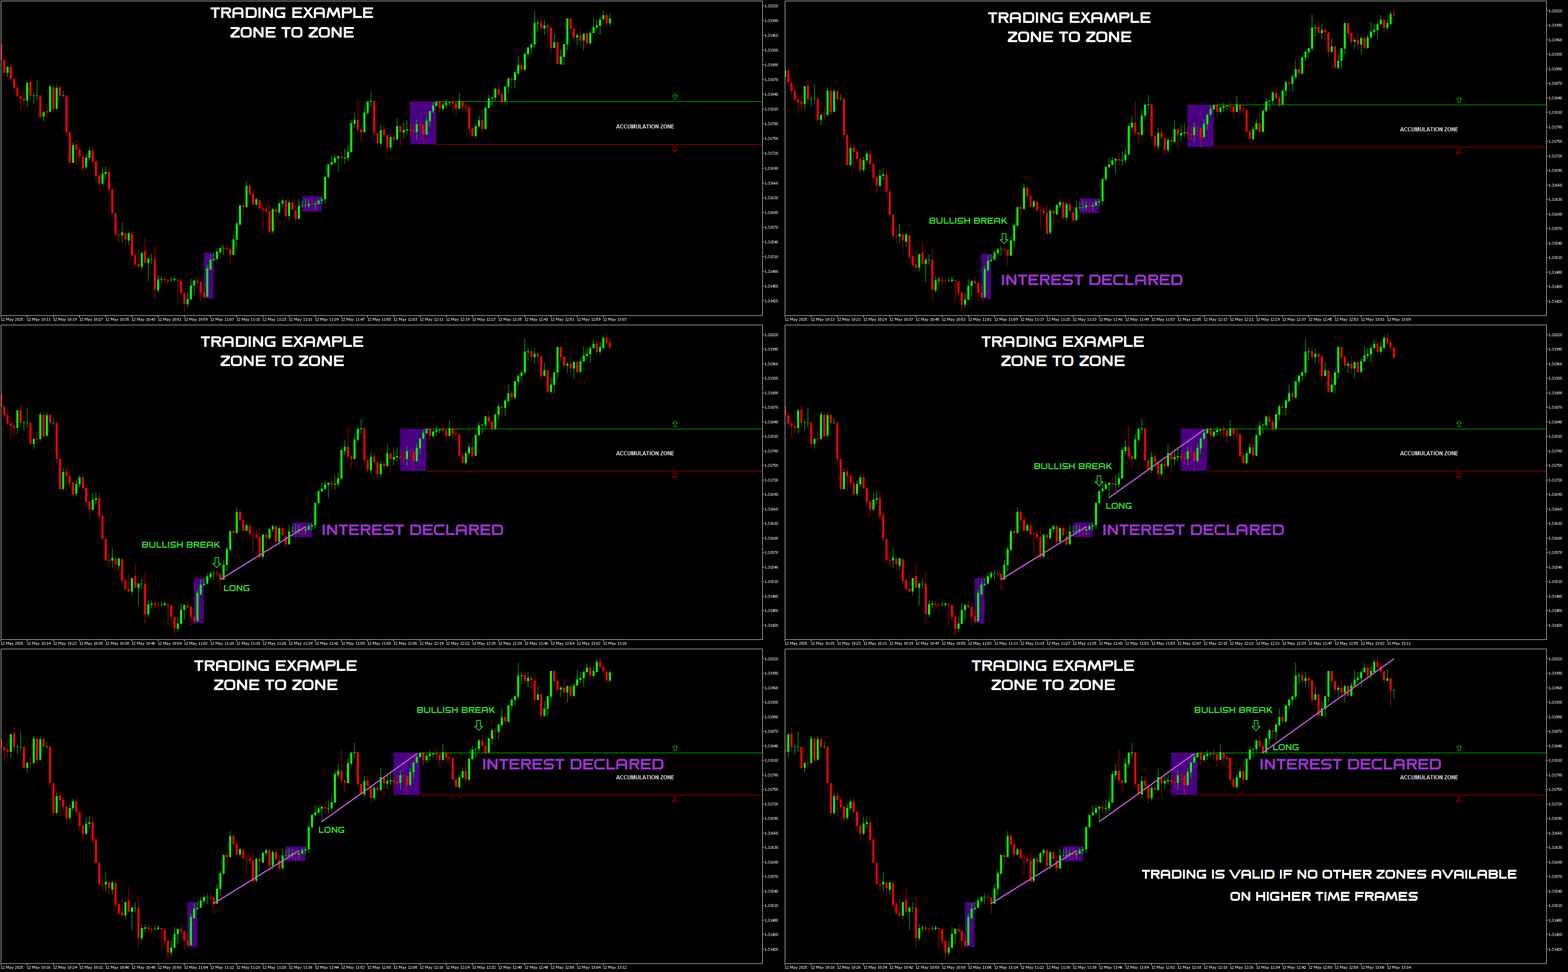
你可以采用“区域到区域”的交易方式:

示例1:
当出现订单积累区突破时,按突破方向开仓。

示例2:
在4小时图上,市场发生多头突破并上涨,之后出现了1小时的新区域。你可以选择平仓,并等待1小时区域给出进一步指引。

示例3:
当价格在区域内部运行时,可以选择从上边界做空、从下边界做多,直到区域被突破。这是震荡交易方式,但风险较高。
切记:绝不能逆势操作!绝不能!

如果区域被双向突破,将触发高波动性警告信号(High Volatility Alert)。

这就是资金的踪迹。而这些信息,肉眼是无法察觉的,因为我们看到的只是虚假的“tick交易量”,这正是外汇市场最大的误区之一。
这正是交易速度指标的使命:将tick交易量转化为真实的市场行为。

这是一款非常严肃、用于高级分析需求的工具。

推荐设置:

  • 货币对:仅推荐使用tick交易量大的品种,如EUR/USD、USD/JPY、GBP/USD等

  • 时间周期:所有时间周期均适用

  • 最低入金要求:无

  • 账户类型限制:无

  • 经纪商限制:无,但建议选择大经纪商,因其交易量更高

纯粹的科学分析。
评分 4
John
133
John 2026.07.06 23:06 

love this developer .. friendly and engaging and very active on his telegram channel .. as for the indicator, its awesome add kama for an extra 50 bucks, and its a weapon

zeke21t2
813
zeke21t2 2026.02.15 13:00 

This is an amazing indicator that gives you a quick glimpse into the big picture, the most important aspect of trading: whether you should wait for a buying opportunity, a selling opportunity, or wait for the market to settle down. Simply avoiding false breakouts will dramatically improve your trading performance. For specific buying and selling opportunities, I highly recommend using it in conjunction with Meravith, another of the author's outstanding works. Pullback reversals and reversals from the top or bottom, which are entered based on chart highs and lows or volume changes, will become more effective. Honestly, I recommend this so much that I don't want anyone else to know about it :)

Max2233
807
Max2233 2025.07.08 10:33 

I would like to compliment this work of art composed by IVAN, a very precise indicator and in combination with his other jewels created by him, trading has simply become simpler and more intuitive. A round of applause to IVAN.

推荐产品
Blahtech VWAP MT5
Blahtech Limited
5 (1)
Blahtech VWAP - Volume Weighted Average Price (VWAP) is the ratio of price to total volume. It provides an average price over a specified time interval.  Links [  Install  |  Update  |  Documentation   ] Feature Highlights Configurable VWAP Line Sessions, intervals, anchored or continuous Previous day settlement line Standard Deviation bands Alerts at bar close or real time Automatic Broker or Tick volumes Significantly reduced CPU usage Input Parameters Expert Advisor Mode  - Reserved for iCu
FREE
Delta Profile Volume
Teresinha Moraes Correia
指标技术说明 – Delta Profile for MetaTrader 5 Delta Profile 是为 MetaTrader 5 开发的一款指标,用于在指定的 K 线区间内对成交量流进行详细分析。它能够在不同的价格水平上对正向成交量(与上涨相关)和负向成交量(与下跌相关)的不平衡进行结构化和可视化展示。最终,用户可以清晰地识别图表中成交最为集中的区域,以及真实的市场不平衡形成的位置。 以下是该指标的主要技术特征与参数说明。 核心概念 指标会识别 价格水平 ,并将其分类为正向成交量、负向成交量,以及净 Delta(正负成交量的差值)。 每个价格水平会在图表中以 水平条形 显示,帮助用户直观观察市场活跃区和不平衡区域。 用户可自由控制 分析的 K 线数量 、 价格精度(小数位数) 、 显示的最大水平数量 以及 可视化样式 。 主要功能 价格水平映射 :根据设定的精度对价格进行四舍五入,并累计对应 K 线的成交量。 净 Delta 计算 :显示正负成交量的差值,提供每个价格区间的客观数值。 最强 Delta 水平突出显示 :自动识别 Delta 绝对值最大的价格水平,并用特殊颜色标
ModGod Trend Scalp Pullback
Egon Henrique Portolani
ModGod Scalp Pullback - Precision Trend & Reversion Engine LAUNCH PROMOTION: Only $49 for the first 10 copies! The official price will be $490. Buy before the price goes up! The   ModGod Scalp Pullback   is an advanced, all-in-one indicator designed for professional scalpers and day traders. It combines the extreme smoothness of Triangular Moving Averages (TMA) with Heikin-Ashi trend filtering to provide highly accurate pullback entries and extreme exhaustion reversals. By mapping the natu
Value Chart Candlesticks
Flavio Javier Jarabeck
4.57 (14)
The idea of a Value Chart indicator was presented in the very good book I read back in 2020 , " Dynamic Trading Indicators: Winning with Value Charts and Price Action Profile ", from the authors Mark Helweg and David Stendahl. The idea is simple and the result is pure genius: Present candlestick Price analysis in a detrended way! HOW TO READ THIS INDICATOR Look for Overbought and Oversold levels. Of course, you will need to test the settings a lot to find the "correct" one for your approach. It
FREE
Frato Vwap Bands
Francisco Felipe Alves Da Silva Rocha
Frato VWAP 带——带标准差的成交量加权平均价格 Frato VWAP 带指标结合了传统的成交量加权平均价格 (VWAP) 和动态波动率带。它提供成交量加权平均价格的多周期视图。 主要功能: 该指标计算成交量加权平均价格 (VWAP),并根据标准差绘制最多 3 条上下波动率带。每次选择新的周期(小时、4 小时、日线、周线、月线)时,计算都会重置,从而支持日内和长期趋势分析。 标准差带的权重与 VWAP 的权重相同。这使得它们具有动态性,能够灵敏地反映市场活动,有助于识别异常的价格波动和潜在的反转区域。 解读指南:VWAP 线通常用作加权平均价格的参考线。高于 VWAP 线的交易表明买盘压力,而低于 VWAP 线的交易则表明卖盘压力。这些带状区域作为动态参考水平,外侧带状区域指示具有统计显著性的极值。 配置参数: 周期:定义 VWAP 重置频率。 - 1 小时 (H1) – 每 00:00 重置一次。 - 4 小时 (H4) – 每 4 小时重置一次(00:00、04:00、08:00 等)。 - 日线 – 在每个交易日开始时重置。 - 周线 – 在每个交

FREE
This z-score indicator shows the correct z-score of an asset, as it uses the normalized price data for calculation, which is the only correct way. Z-score is only applicable for normal distributed data, therefore not the actual price is considered, but the normalised returns, which were assumed to follow a normal distribution. Returns are mean reverting and assumed to follow a normal distribution, therefore z-score calculation of returns is more reliable than z-score on price, as price is NOT m
Session Volume Heatmap
Dang Tam Tran
5 (1)
Volume Profile FREE — Multi-Session Heatmap (POC · VAH · VAL) See where trading activity actually occurs—not just where price moves. This indicator builds a clear, color-coded Volume Profile Heatmap directly on your chart and highlights the market's most important price levels: the Point of Control (POC) and the Value Area (VAH/VAL) , where price is most likely to react.
FREE
MW Volume
Martin Bittencourt
3.8 (5)
The Martinware Volume indicator plots a colored moving average over volume bars. The coloring uses three colors and can be done in different ways choosable by the user and is applied both to the average as to the volume bars. Three types of coloring are possible: None: no coloring is done Increasing or decreasing: changes the color depending on the current value being bigger or lesser than the previous one Volume relative to average: colors vary if the current volume is bigger or lesser then
FREE
Volume flow Profile
Israr Hussain Shah
大师版是一款专业级的分析工具,旨在通过成交量和资金流向的视角来可视化市场结构。与标准的成交量指标不同,该工具直接在图表上显示每日成交量分布,让您准确看到价格发现发生的位置以及“聪明钱”的定位。 此大师版专为清晰度和速度而设计,具有独特的自动主题同步系统,加载后即刻美化您的图表布局。 主要特点: 真实资金流向计算: 超越标准的跳动量。启用“Use Money Flow”时,成交量按价格加权,揭示了特定价格水平的实际资金投入。 价值区域 (VA) 可视化: 自动计算价值区域(默认为成交量的70%)。 VA填充: 为价值区域背景着色,以便即时识别控制区域。 关键水平: 清晰标记控制点 (POC)、价值区域高点 (VAH) 和价值区域低点 (VAL)。 专业标记系统: 扫描概况结构以识别关键交易区域: HVN (高成交量节点): 接受和盘整区域(支撑/阻力)。 LVN (低成交量节点): 拒绝区域或“快速通过”区域。 所有标记均向右绘制延长线,便于监控。 Delta 背离(左侧直方图): 左侧直方图可视化每个级别的买卖压力对比。这有助于识别隐藏的背离——即价格可能上涨,但卖家在这些水平上激进打
Angus Orderflow Heatmap
Mr Monthon Chaipreechapat
Volume Footprint & Heatmap Indicator This indicator combines Volume Footprint and Heatmap visualization, inspired by the Order Flow and Heatmap concepts found in Bookmap. Unlike futures markets, the Forex market does not provide real exchange-traded volume data. Instead, it only offers Tick Volume . This indicator is designed to simulate Bookmap-style market visualization as closely as possible using the available Tick Volume data. Because the indicator relies on Tick Volume, the quality and acc
Smart Trendline Detector
Ramandeep Singh
5 (1)
Smart Trendline Detector Smart Trendline Detector is an automatic multi-timeframe trendline analysis indicator for MetaTrader 5 that detects and ranks rising support and falling resistance structures using market swing points. Instead of filling the chart with every possible trendline, the indicator evaluates qualifying structures and displays only a controlled number of the strongest candidates according to configurable ranking criteria. The result is a cleaner chart with relevant trendline str
FREE
Aggression Volume
Flavio Javier Jarabeck
4.29 (17)
Aggression Volume Indicator is the kind of indicator that is rarely found in the MQL5 community because it is not based on the standard Volume data provided by the Metatrader 5 platform. It requires the scrutiny of all traffic Ticks requested on the platform... That said, Aggression Volume indicator requests all Tick Data from your Broker and processes it to build a very special version of a Volume Indicator, where Buyers and Sellers aggressions are plotted in a form of Histogram. Additionally,
FREE
Easy VWAP
Luca Spinello
VWAP Indicator, the short form of Volume Weighted Average Price, is similar to a moving average but takes into consideration the tick volume of the candles. The indicator calculates the moving average multiplying the price of each candle for the tick volume in the candle. Said calculation weighs with more significance price where more transactions were made. Features: Visual styling customizable Period customizable Ease of use
FREE
Visual Heatmap Book Analyzer
Alexandre Moraes De Souza Lima
Visual Heatmap Book Analyser This indicator monitors the market liquidity and generates colors based on order patterns, quantities, and renewal activities in the book. This allows you to visualize the order flow and identify areas of high and low liquidity and activity. The indicator uses machine learning techniques to analyze the order behavior in the book, enabling it to detect patterns and trends in orders, allowing you to make informed decisions about your trading operations. The color pale
Ultimate Clock – Candle & Session Indicator Ultimate Clock is an all-in-one MT5 trading indicator that combines a professional multi-session clock , real-time candle countdown timer , and session-based candle coloring into a single, lightweight tool. It helps traders instantly identify active trading sessions, monitor candle expiration, and stay synchronized with the world's major financial markets. Designed for scalpers, day traders, and swing traders, Ultimate Clock enhances market awareness
Haven Volume Profile
Maksim Tarutin
4.62 (13)
Haven Volume Profile 是一个多功能的成交量剖面分析指标,帮助基于交易量分布识别关键价格水平。它旨在为专业交易者提供更深入的市场理解,并帮助识别重要的进出场点。 其他产品 ->  这里 主要功能: Point of Control (POC) 计算 - 最大交易活动水平,帮助识别最具流动性的水平 Value Area 定义(增加活动区)和可自定义的成交量百分比,帮助更准确地评估交易区间 支持tick成交量和实际成交量,适用于不同市场类型和交易策略 灵活的计算周期设置(天数),使工具能够适应任何时间范围 自动适应浅色和深色终端主题,提升用户界面的可视体验 清晰的水平可视化,支持自定义样式和颜色,便于图表分析和快速决策 该指标非常适合识别重要的价格水平和整合区,帮助交易者做出更加明智的交易决策。使用 Haven Volume Profile 有助于通过更准确的成交量和市场动态分析来降低风险并增加利润。
FREE
QuantumAlert RSI Navigator is a free indicator available for MT4/MT5 platforms, its work is to provide "alerts" when the market is inside "overbought and oversold" regions in the form of "buy or sell" signals. This indicator comes with many customization options mentioned in the parameter section below, user can customise these parameters as needful. Join our MQL5 group , where we share important news and updates. You are also welcome to join our private channel as well, contact me for the priva
FREE
Ospe POC Volume Profile
Nur Azureen Binti Ab Aziz
A volume-at-price heatmap with POC, value area, estimated buy/sell pressure, confirmed signals and alerts. POC Volume Profile Heatmap is a MetaTrader 5 indicator that organizes historical volume across price levels. It identifies the Point of Control, displays the selected value area, and estimates buying and selling pressure at the POC. The indicator is intended for traders who use volume-at-price structure to study acceptance, rejection and interaction around high-activity price levels. It c
FREE
Simple QM Pattern MT5
Suvashish Halder
3.33 (3)
Simple QM Pattern   is a powerful and intuitive trading indicator designed to simplify the identification of the Quasimodo (QM) trading pattern. The QM pattern is widely recognized among traders for effectively signaling potential   reversals   by highlighting key market structures and price action formations. This indicator helps traders easily visualize the QM pattern directly on their charts, making it straightforward even for those who are new to pattern trading. Simple QM Pattern includes d
FREE
Aggression Volume Profile
Edson Cavalca Junior
4.55 (11)
This indicator plots the volume profile by Price on the chart There are 5 ways to view it: By Total Volume Traded (Premium Version); Volume Ticks(Forex) Separated by Buyers and Sellers (Premium Version); Buyers Only (Premium Version); Sellers Only (Premium Version); Business balance (Buyers - Sellers) (Premium Version); . It is possible to select how many days the profiles will be calculated.( Premium Version) On the current day it recalculates the histogram data for each new candlestick.
FREE
Trend Following EURJPY
Sergio Tiscar Ortega
This EA employs a robust, data-driven approach to capitalize on the specific volatility and trend dynamics of the Euro/Yen cross. Core Strategy Features: Timeframe & Data: Optimized for the H2 (2-hour) timeframe, backtested using high-quality Dukascopy tick data with M1 precision. Intelligent Trade Management: The system utilizes advanced exit mechanisms to protect capital and lock in profits, including dynamic Trailing Stops , technical Take Profit (PT) , and strict Stop Loss (SL) risk controls
Renko bricks drawn as time-anchored boxes on your ordinary chart, so brick structure and real time stay visible together. A renko brick prints when price moves a set distance, ignoring how long that takes. That strips out the sideways noise a time chart is full of. The usual way to see them is a separate offline chart, which loses the clock. This draws the same bricks over your normal candles instead, so you keep the time axis, your other indicators, and your orders. How the bricks are built Onl
FREE
VisualVol EURUSD
Maxim Kuznetsov
The indicator highlights the points that a professional trader sees in ordinary indicators. VisualVol visually displays different volatility indicators on a single scale and a common align. Highlights the excess of volume indicators in color. At the same time, Tick and Real Volume, Actual range, ATR, candle size and return (open-close difference) can be displayed. Thanks to VisualVol, you will see the market periods and the right time for different trading operations. This version is intended f
FREE
TrendSync Risk Calculator
Juliano Guzlinki Pacheco
Stop guessing your lot size. Risk the same amount on every trade. Most traders blow accounts not because of bad entries, but because of inconsistent position sizing: fixed lots with variable stops means every trade risks a different — and unknown — amount of money. TrendSync Risk Calculator solves this in one drag. How it works Attach the indicator. It automatically anchors three draggable lines at the current price: Entry , SL at N×ATR and TP at your chosen R:R . Drag any line — or type a new A
FREE
This robot sends Telegram notifications based on the coloring rules of PLATINUM Candle indicator. Example message for selling assets: [SPX][M15] PLATINUM TO SELL 11:45. Example message for buying assets : [EURUSD][M15] PLATINUM TO BUY 11:45 AM. Before enable Telegram notifications  you need to create a Telegram bot, get the bot API Key and also get your personal Telegram chatId. It's not possible to send messages to groups or channels. You can only send messages to your user chatId. You should
FREE
PZ Penta O MT5
PZ TRADING SLU
3.8 (5)
The Penta-O is a 6-point retracement harmonacci pattern which usually precedes big market movements. Penta-O patterns can expand and repaint quite a bit. To make things easier this indicator implements a twist: it waits for a donchian breakout in the right direction before signaling the trade. The end result is an otherwise repainting indicator with a very reliable trading signal. The donchian breakout period is entered as an input. [ Installation Guide | Update Guide | Troubleshooting | FAQ | A
FREE
Session Profiles
Basharat Umar Khan
Short Description Draws rolling Time-Price-Opportunity (TPO) and footprint volume profiles for the Asia, London, and New York sessions with POC/VAH/VAL levels, delta volume bias, order flow overlays, liquidity heatmaps, developing rolling lines, Naked POC (NPOC) tracking, Initial Balance breakouts, multi-session confluence zones, and automatic broker GMT-offset detection. Full Description Plots separate market-profile and volume-profile style histograms for the three major trading sessions (Asi
FREE
Volume Profile Advance
Israr Hussain Shah
Daily & Composite Volume Profile   This is a professional-grade market profile tool designed for MetaTrader 5. It utilizes a   Dual-Profile System   to visualize supply, demand, and liquidity concentrations. Key Features Left Side: Daily Session Profiles Automatically identifies the start and end of every trading day. Generates a unique Volume Profile for each individual day. Allows you to see how value migrated from yesterday to today (e.g., Is today's volume higher or lower than yesterday?).
TPO Profile MT5
Kyra Nickaline Watson-gordon
Definition : TPO is a Time Price Opportunity. Instead of using bars or candles with an Open, High, Low, and Close price, each "bar" in a Market Profile is represented by horizontal bars against the price It is called Market Profile terminology. In other words time-price-opportunity (TPO) profiles are histograms of how much time was spent at each price within the span of the profile. By using a TPO chart, you are able to analyze the amount of trading activity, based on time, for each price level
Friend of the trend
Anderson De Assis
Friend of the Trend: Your Trend Tracker Master the market with Friend of the Trend , the indicator that simplifies trend analysis and helps you identify the best moments to buy, sell, or wait. With an intuitive and visually striking design, Friend of the Trend analyzes price movements and delivers signals through a colorful histogram: Green Bars : Signal an uptrend, indicating buying opportunities. Red Bars : Alert to a downtrend, suggesting potential selling points. Orange Bars : Represent cons
FREE
该产品的买家也购买
Meravith Scanner
Ivan Stefanov
5 (3)
MERAVITH SCANNER 是一款适用于 MetaTrader 5 的专业金融市场指标,将多种分析工具整合为一个统一的系统。它基于专有的成交量加权平均价格(VWAP)方法自动完成所有计算,完全消除主观判断。 该指标适用于所有资产类别(外汇、股票、指数、大宗商品、加密货币)以及从 M1 到 Monthly 的所有时间周期。其核心原理是价格跟随成交量。MERAVITH 识别机构资金成交量的集中区域,并从该集中区域中推导出数学上精确的价格水平。它不预测,不推测。它只计算。 使用 MERAVITH SCANNER,您可以在 2–3 分钟内扫描全部 28 个主要外汇货币对的所有时间周期。您也可以扫描任何您选择的市场——例如,大约 100 只股票约需 10 分钟。 该指标计算耗尽水平、平衡线、偏差、统计水平以及目标投射。 图表元素 Origin Point 标记所有计算的起始位置。指标会自动将其放置在最佳位置。红色标签(TOP)表示市场高点并带有看跌倾向。绿色标签(BOTTOM)表示市场低点并带有看涨倾向。 Sentiment Line 是一条动态曲线,反映基于成交量加权计算得出的市场情绪。
Volume Arrow Signal Product Description Volume Arrow Signal is a smart trading indicator designed to help traders identify potential buy and sell opportunities using price action, volume behavior, and directional arrow signals. The indicator places clear arrows directly on the chart, making it easy to spot possible market reversals, trend continuations, and entry opportunities without spending hours analyzing charts manually. Whether you are trading Gold (XAUUSD) , Forex pairs, Indices, or Crypt
ORB Seeker MT5
Marcela Goncalves De Oliveira
特价促销,限量供应,保持产品稀缺性! 仅售 599 美元! 购买后请联系我以获取奖励的 ORB Seeker EA 和个人优化设置文件。 自信地捕捉干净利落的比赛片段! ORB Seeker MT5 是一款专业的开盘区间突破 (ORB) 指标,专为追求准确性、简洁性、灵活性和清晰图表结构的交易者而设计。 它能自动绘制任何交易品种的盘前或自定义交易时段区间,然后给出清晰的突破信号,包括入场点、止损点、止盈点以及可选的50%部分止盈位。所有数据均实时计算并直接显示在图表上。 您可以选择交易伦敦开盘、纽约交易时段、亚洲交易时段,或者自定义交易时段。ORB Seeker MT5 会自动适应您选择的交易时段,让您精准掌握市场波动范围、突破位和交易位。 每次购买均免费赠送 ORB Seeker EA 智能交易系统。该 EA 系统读取指标的突破信号并可自动下单,您可以选择手动交易,也可以让 EA 系统根据指标的信号逻辑自动处理入场。   为什么选择 ORB Seeker MT5 支持多个交易时段 - 您可以自行设置伦敦、纽约、亚洲或自定义交易时段的盘前交易时间和交易时段。 完整的突破视觉效果 -
KenKem Master Volume Profiler - Brief Introduction A Display-only volume-profile cockpit for XAUUSD, BTCUSD and other liquid symbols. Draws profile structure, multi-timeframe flow, EMA trend and study-only setup markers. Places no orders. Not a signal service.  It maps where the market has actually traded and reads recent order flow, so you can see structure and lean at a glance.  What it shows: Master and local volume profiles (POC and value-area high/low) - the price shelves that matter. A liv
一句话理解 这是一个 二合一的智能指示器 ——把 RSI 和 MACD 两位“专家”的意见打包成一个简单的结论:出现箭头,就行动;没有箭头,就等待。 而且箭头 不会重绘 ,收盘后是什么样,永远就是什么样。 它解决了什么问题 很多交易者同时看 RSI(判断动量和超买超卖)和 MACD(判断趋势方向),但两者经常给出矛盾信号。 这个指示器的做法是: 只有两人同时同意 ,才发出信号。这就过滤掉了大量假信号和模糊时段。 你实际看到的东西 独立的指示器窗口(不遮住 K 线图) 清晰的 买入箭头 和 卖出箭头 放大版的 MACD 柱状图(更容易看清动量变化) RSI 和 MACD 的线依然在,但你的注意力只需放在箭头上 谁适合用 新手 :不用学两个指标如何配合,跟着箭头做即可 老手 :节省时间,快速过滤噪音,且不重绘的特性让回测结果可信 所有讨厌信号闪烁的人 为什么它不重绘 因为它的判断逻辑基于 完整收盘后的价格数据 。信号只有在满足条件的那一刻才会固定下来,之后不会因为后续 K 线的变化而修改之前的箭头。 这意味着你可以放心做回测,也能在实盘中信任你看到的每一个信号。 底层特点(不复杂地说) 它
TrendMaestro5
Stefano Frisetti
note: this indicator is for METATRADER4, if you want the version for METATRADER5 this is the link:  https://www.mql5.com/it/market/product/108106 TRENDMAESTRO ver 2.5 TRENDMAESTRO recognizes a new TREND from the start, he never makes mistakes. The certainty of identifying a new TREND is priceless. DESCRIPTION TRENDMAESTRO identifies a new TREND in the bud, this indicator examines the volatility, volumes and momentum to identify the moment in which there is an explosion of one or more of these da
看清市场真正在做什么。   在您眼前实时观察三大市场阶段(收缩、扩张、趋势),并在趋势阶段的早期阶段抓住更优的入场点。   不要再猜测。开始像机构和聪明钱那样解读市场。   Apex Market Structure Pro(MT5 版)是一款精准的聪明钱分析工具,它剥离噪音,向您展示每根 K 线之下的真实结构:流动性、结构转变、吸   筹区域与趋势偏向,全部呈现在一个简洁、专业的图层中。专为厌倦了滞后指标、准备以清晰视角交易的严肃交易者打造。   重要提示:本指标专为 Heikin Ashi(平均足)K 线设计。使用前请将图表切换为 Heikin Ashi,以释放其全部威力。全部分析都围绕 Heikin   Ashi 的价格流构建。正是在这里,Apex Market Structure Pro 发挥出最佳表现。   交易者为何选择 Apex Market Structure Pro:   流动性,一览无遗: 瞬间看清止损池所在之处。卖方与买方流动性会被自动标注。实时关注尚未被扫的价位,捕捉价格攫取流动性并反转的精确时   刻。在聪明钱交易的地方交易。   会说话的结构:
FX-AIEA 供给需求区智能识别指标(Supply and Demand Indicators MT5)——技术原理与参数讨论 版本:2.51 | 适用平台:MetaTrader 5 引言 供给需求区是机构订单流的重要表现形式,相比传统支撑阻力位能更直接地反映买卖力量的失衡。本指标尝试通过算法自动识别高概率供需区域,以减少手动绘制的耗时与主观性。其核心逻辑基于自适应 ZigZag 算法,提取波峰波谷并生成区域标识 。 核心技术特点 全自动绘制机制 :基于改良版 ZigZag 动态提取有效极值,标记潜在供给区与需求区。指标遵循 MQL5 原生   prev_calculated   机制,在新 K 线生成时自动重绘,支持跨周期强制计算( Forced_TimeFrame   参数)。 区域边界模式 :支持宽带(覆盖K线影线极值)与窄带(仅覆盖实体)两种模式,用户可通过   use_narrow_bands   参数切换,以适应不同交易风格。 滤噪算法 :启用   kill_retouch   后,自动剔除被后续行情反复轻触但未有效突破的弱势区域,以提升信号有效性。 视觉与性能 :支持自
VTrende Pro
Andrii Diachenko
5 (1)
VTrende Pro - MTF indicator for trend trading with a display panel for MT5 *** Videos can be translated into any language using subtitles (video language - Russian) Although the signals of the VTrende Pro indicator can be used as signals of a full-fledged trading system, it is recommended to use them in conjunction with the Bill Williams TS. VTrende Pro is an extended version of the VTrende indicator. Difference between Pro version and VTrende: - Time zones - Signal V - signal 1-2 waves -    S
SMC Institutional Suite
Catur Cipto Nugroho
SMC Institutional Suite v3.7 Professional Smart Money Concept Indicator for MetaTrader 5 What is New in Version 3.7 - Visual Stability Update This release focuses entirely on one goal: making every zone, label, and line on your chart rock-solid stable. There is no more flickering, no more zones disappearing on a new candle, and no more duplicate drawings. Order Block (OB) zones no longer flicker or disappear. Once drawn, they stay permanently on the chart. Equal Highs and Equal Lows (EQH / EQL)
PrimeScalping
Temirlan Kdyrkhan
PrimeScalping is a powerful trading companion designed to generate high-probability entry signals with dynamic TP/SL/DP levels based on volatility. Built-in performance tracking shows win/loss stats, PP1/PP2 hits, and success rates — all updated live. Key Features: Buy/Sell signals with adaptive volatility bands Real-time TP/SL/DP levels based on ATR Built-in MA Filter with optional ATR/StdDev volatility Performance stats panel (Success, Profit/Loss, PP1/PP2) Alerts via popup, sound, push, or e
MasterTrend
Temirlan Kdyrkhan
MasterTrend Indicator for MT5 A powerful trend-following and signal-evaluation tool MasterTrend   is a custom MT5 indicator that combines Moving Averages and ATR-based risk/reward logic to generate clear buy/sell signals. It visualizes dynamic SL/TP levels, evaluates past trade outcomes, and displays win/loss statistics in a clean on-chart panel. Key features include: Buy/Sell signals based on MA crossovers ATR-based SL/TP1/TP2/TP3 levels with visual lines and labels Signal outcome tracking wit
SMC Sweep Fvg MT5
Daniil Sleptsov
5 (1)
SMC Sweep Fvg MT5 — 像聪明钱一样看市场,就在你的图表上 你一定有过这种感觉:价格扫掉你的止损,随后反转,并正好走到你预期的方向。方向你是对的,错的只是入场。 这个指标就是为了让这类情况少发生。它接手分析中最繁重的部分——图表标注,把真正重要的留给你:决策。 你会在图表上看到什么 市场结构 — 真实的结构高点与低点,带有 HH / HL / LH / LL 标记和水平线。趋势一目了然,无需猜测。 失衡区(FVG) — 价格推进过快、之后常会回补的区域。未回补与已回补的区域用不同颜色显示。 流动性行为 — 指标跟踪市场在反转前扫过关键水平的时刻。 现成的交易布局 — 入场箭头、止损位与盈利目标。全部画好,无需心算。 趋势过滤 — 更高周期的趋势线,帮你站在主趋势一侧。 指标关注流动性扫荡、失衡形成与结构状态——并只突出这些因素同时对齐的情形。 统计面板——回应每一个疑虑 你不必只听别人说。图表上的内置面板会按所选历史显示: 分析周期(K线数量); 检测到的情形总数; 多少到达目标、多少触及止损; 仍在运行中的数量; 以点数计的净结果。 切换品种——面板重
Pan PrizMA CD Phase
Aleksey Panfilov
The Expert Advisor and the video are attached in the Discussion tab . The robot applies only one order and strictly follows the signals to evaluate the indicator efficiency. Pan PrizMA CD Phase is an option based on the Pan PrizMA indicator. Details (in Russian). Averaging by a quadric-quartic polynomial increases the smoothness of lines, adds momentum and rhythm. Extrapolation by the sinusoid function near a constant allows adjusting the delay or lead of signals. The value of the phase - wave s
Классификатор силы тренда. Показания на истории не меняет. Изменяется классификация только незакрытого бара. По идее подобен полной системе ASCTrend, сигнальный модуль которой, точнее его аппроксимация в несколько "урезанном" виде, есть в свободном доступе, а также в терминале как сигнальный индикатор SilverTrend . Точной копией системы ASCTrend не является. Работает на всех инструментах и всех временных диапазонах. Индикатор использует несколько некоррелируемых между собой алгоритмов для класси
FFx Universal Strength Meter PRO is more than a basic strength meter. Instead of limiting the calculation to price, it can be based on any of the 19 integrated strength modes + 9 timeframes. With the FFx USM, you are able to define any period for any combination of timeframes. For example, you can set the dashboard for the last 10 candles for M15-H1-H4… Full flexibility! Very easy to interpret... It gives a great idea about which currency is weak and which is strong, so you can find the best pai
The FFx Universal MTF alerter shows on a single chart all the timeframes (M1 to Monthly) with their own status for the chosen indicator. 9 indicators mode (MACD-RSI-Stochastic-MA-ADX-Ichimoku-Candles-CCI-PSAR). Each can be applied multiple times on the same chart with different settings. Very easy to interpret. Confirm your BUY entries when most of the timeframes are showing green color. And confirm your SELL entries when most of the timeframes are showing red color. 2 Alert Options : input to s
FFx Watcher Pro MT5
Eric Venturi-Bloxs
The FFx Watcher PRO is a dashboard displaying on a single chart the current direction of up to 15 standard indicators and up to 21 timeframes. It has 2 different modes: Watcher mode: Multi Indicators User is able to select up to 15 indicators to be displayed User is able to select up to 21 timeframes to be displayed Watcher mode: Multi Pairs User is able to select any number of pairs/symbols User is able to select up to 21 timeframes to be displayed This mode uses one of the standard indicators
FFx Patterns Alerter gives trade suggestions with Entry, Target 1, Target 2 and StopLoss .... for any of the selected patterns (PinBar, Engulfing, InsideBar, OutsideBar) Below are the different options available: Multiple instances can be applied on the same chart to monitor different patterns Entry suggestion - pips to be added over the break for the entry 3 different options to calculate the SL - by pips, by ATR multiplier or at the pattern High/Low 3 different options to calculate the 2 TPs -
FFx Basket Scanner MT5
Eric Venturi-Bloxs
MetaTrader 4 version available here : https://www.mql5.com/en/market/product/24881 FFx Basket Scanner is a global tool scanning all pairs and all timeframes over up to five indicators among the 16 available. You will clearly see which currencies to avoid trading and which ones to focus on. Once a currency goes into an extreme zone (e.g. 20/80%), you can trade the whole basket with great confidence. Another way to use it is to look at two currencies (weak vs strong) to find the best single pairs
MetaTrader 4 version available here: https://www.mql5.com/en/market/product/25793 FFx Pivot SR Suite PRO is a complete suite for support and resistance levels. Support and Resistance are the most used levels in all kinds of trading. Can be used to find reversal trend, to set targets and stop, etc. The indicator is fully flexible directly from the chart 4 periods to choose for the calculation: 4Hours, Daily, Weekly and Monthly 4 formulas to choose for the calculation: Classic, Camarilla, Fibonac
ClassicSBA
Umri Azkia Zulkarnaen
this indicator very simple and easy if you understand and agree with setup and rule basic teknical sba you can cek in link : please cek my youtube channel for detail chanel : an for detail info  contact me  basicly setup buy (long) for this indicator is Magenta- blue and green candle or magenta - green  and green candlestik and for setup sell (short) is Black - yellow - and red candle or black - red  and red candlestik
WanaScalper
Isaac Wanasolo
1 (1)
A scalping indicator based on mathematical patterns, which on average gives signals with relatively small SL, and also occasionally helps to catch big moves in the markets (more information in the video) This indicator has three main types of notifications: The first type warns of a possible/upcoming signal on the next bar The second type indicates the presence of a ready signal to enter the market/open a position The third type is for SL and TP levels - you will be notified every time price re
Индикатор Coefficient Of Determination (COD) представляет собой значение коэффициента детерминации или квадрат коэффициента корреляции между зависимой переменной — ценой и объясняющей переменной — тиковым объемом. Что это дает нам на практике? COD отлично распознает кульминацию трендовых движений, что позволяет подбирать оптимальные точки и ловить развороты рынка. Как использовать индикатор: Наиболее популярная торговая стратегия строится совместно с трендовым индикатором Moving Average (MA), пе
Recommended TimeFrame >= H1. 100% Non Repainted at any moment.  Use it carefully, only with Trend Direction. Trading Usage: 2 Variants: as Range System or as BreakOut System (Both Only With Trend Direction)::: (Always use StopLoss for minimise Risk); [1] as Range System: (Recommended) in UP TREND:  - BUY in Blue Line , then if price goes down by 50 points (on H1) open Second BUY.   Close in any Profit you wish: TrailingStop(45 points) or Close when Price touches upper Gold Line. in DOWN TREND
Spike Detector
Tete Adate Adjete
this indicator is a Spike detector indicator, it is specially designed to trade Boom 1000, Boom 500, Crash 1000 and Crash 500 We recommend using it on Deriv Boom and Crash indices only Its setting is intuitive, familiar, easy to use it has notification functions; audible notifications and push notifications. this tool is simple to use, easy to handle This update is based on different strategies for spikes
Limitless MT5
Dmitriy Kashevich
Limitless MT5 is a universal indicator suitable for every beginner and experienced trader. works on all currency pairs, cryptocurrencies, raw stocks Limitless MT5 - already configured and does not require additional configuration And now the main thing Why Limitless MT5? 1 complete lack of redrawing 2 two years of testing by the best specialists in trading 3 the accuracy of correct signals exceeds 80% 4 performed well in trading during news releases Trading rules 1 buy signal - the ap
Seconds Charts
Aleksandr Goryachev
Micro  ******************* Секундные графики MT5 ********************** Более точного инструмента для входа в сделку вы не найдёте. Входные параметры: Timeframe, sek - период построения графика, секунды Displayed bars - отображаемые бары Step of price levels, pp, 0-off - шаг отрисовки ценовых уровней, пункты Scale points per bar, 0-off - масштаб в пунктах на бар Show lines - отображение текущих уровней Show comment - отображение комментария Standard color scheme - стандартная цветовая сх
QXS Market Scanner
Netlux Digital Kft.
QuantXMarketScanner is a multi assets indicator for MT5 - Mathematical model based on 7 custom moving averages indicators  - Adaptable on Currencies, Stocks and Crypto - Automatic setup, self optimized About QuantXsystem Products: –         Simple installation & integration into MT5   –         Unlimited License after purchase (for one user) –         Automatic pattern recognition to identify the best timing and price levels. –         Trading indicators are displayed directly and automaticall
作者的更多信息
Meravith Scanner
Ivan Stefanov
5 (3)
MERAVITH SCANNER 是一款适用于 MetaTrader 5 的专业金融市场指标,将多种分析工具整合为一个统一的系统。它基于专有的成交量加权平均价格(VWAP)方法自动完成所有计算,完全消除主观判断。 该指标适用于所有资产类别(外汇、股票、指数、大宗商品、加密货币)以及从 M1 到 Monthly 的所有时间周期。其核心原理是价格跟随成交量。MERAVITH 识别机构资金成交量的集中区域,并从该集中区域中推导出数学上精确的价格水平。它不预测,不推测。它只计算。 使用 MERAVITH SCANNER,您可以在 2–3 分钟内扫描全部 28 个主要外汇货币对的所有时间周期。您也可以扫描任何您选择的市场——例如,大约 100 只股票约需 10 分钟。 该指标计算耗尽水平、平衡线、偏差、统计水平以及目标投射。 图表元素 Origin Point 标记所有计算的起始位置。指标会自动将其放置在最佳位置。红色标签(TOP)表示市场高点并带有看跌倾向。绿色标签(BOTTOM)表示市场低点并带有看涨倾向。 Sentiment Line 是一条动态曲线,反映基于成交量加权计算得出的市场情绪。
Meravith MT5
Ivan Stefanov
5 (3)
MERAVITH 是一款适用于 MetaTrader 5 的多周期成交量与流动性指标,它在每一个时间周期上显示趋势、支撑与阻力区域、入场、目标和止损。它为您提供完整的市场流动性地图,一个对冲基金风格的流动性工具,并用专有的成交量加权平均价格方法自动完成全部计算,因此没有主观解读。 适用于外汇、黄金(XAUUSD)、指数和加密货币,适用于所有时间周期。 购买后赠送:一套关于如何用 MERAVITH 交易的视频课程。购买后请给我发消息。 MERAVITH 的功能 分析所有时间周期,并显示每个周期上正在生效的趋势。 标记流动性区域(Volume Equilibrium),即多头与空头成交量相等的位置。 将所有时间周期的流动性水平直接显示在您的图表上。 写出市场的文字分析供您参考。 根据当前趋势计算入场、目标、支撑位和止损。 计算您交易的风险回报比。 按您的账户余额计算仓位大小,并估算潜在利润。 在市场出现重要变化时提醒您:警报、电子邮件和推送到手机的通知。 主要线条 Bullish / Bearish Volume Exhaustion 线:目标位。 趋势线:随趋势改变颜色(多头或空头),显
Currency Strength Anchor —— 会话自适应的相对强度指标,以日开盘、周开盘和月开盘为锚点。无重绘。 大多数强度指标在固定回溯期内比较不同品种。但随着交易日从一个交易时段进入下一个时段,这种比较的意义会发生变化:基于亚洲时段数据的排名在伦敦和纽约开盘后几乎没有参考价值。 Currency Strength Anchor 采用不同的参考方式。它将每个品种与三个固定锚点进行比较——日开盘、周开盘和月开盘——并根据你所处的交易时段自动调整计算范围。 上下文会自动在以下范围之间切换: 仅亚洲时段 亚洲 + 欧洲时段 亚洲 + 欧洲 + 美洲时段 仅美洲时段 所有数值均基于已完成的价格数据计算,不会重绘。 如何阅读 指标为图表上的每个组成部分绘制一条线,因此你始终是在比较两条线。 示例 1 —— 黄金。你会看到两条线,一条代表 XAU,一条代表 USD。如果 XAU 线高于 USD 线,说明黄金强于美元,你应寻找做多 XAUUSD 的机会。 示例 2 —— EURUSD。如果 EUR 线低于 USD 线,说明欧元弱于美元,你应寻找做空 EURUSD 的机会。 规则对所有品
Fibowave
Ivan Stefanov
FIBOWAVE 在七个时间周期上同时自动完成艾略特波浪计数,从月线图一直到 M5,并给出运行中调整浪的斐波那契回撤、第3浪、第5浪和C浪的斐波那契目标、计数失效的价位,以及第3浪或第5浪开始时的提醒。 手工数浪速度很慢,而且两位分析师很少能得出相同的计数。FIBOWAVE 按固定规则计数,每次的方式都相同,并把各浪、它们的子浪以及子浪的子浪标注在您的图表上。 计数从哪里开始 您不需要选择起点,也不需要设置任何参数。本指标从月线图开始逐级向下寻找市场最近一次显示出新一轮走势开端的位置,并从该位置开始计数。 在起始阶段,一段走势既可能是新趋势的第1浪,也可能是旧趋势的第2浪,在价格再次运行之前没有人能够确定。FIBOWAVE 会如实说明这一点:标签显示为 "1/2?",状态行会告诉您每种情况分别需要发生什么。一旦价格给出答案,标签就变为第1浪或第2浪,计数由此继续。若某段走势最终被确认为B浪,同样会重新标注。 高时间周期上尚未确定的浪不会中断分析。较低的时间周期会继续对该走势计数,状态行会说明它们采用的是哪一种解读。 从月线图逐级向下 每个时间周期的计数都一直延伸到最后一
GANN Master 为当前的日、周或月绘制江恩(W. D. Gann)平方根水平,并标出买方与卖方目标相遇的区域。水平由上一周期的最高价和最低价计算,在整个周期内保持不变,不会重画。 水平如何构建 上一周期的最高价成为 TOP 线,其最低价成为 BOTTOM 线。指标从 TOP 向下量出三个看跌目标(Bears' interest 1、2 和 3),从 BOTTOM 向上量出三个看涨目标(Bulls' interest 1、2 和 3),使用江恩的平方根步长 1/8、2/8 和 3/8。 江恩计算始终需要一个比例。GANN Master 会自行选择:它尝试每一个比例,并保留使看涨线与看跌线彼此最接近的那一个。当一条看跌线与一条看涨线相互靠近时,双方的利益就在此相遇。指标把这些位置着色为共同利益区域。每个周期最多绘制五个区域。 每个区域周围有两条虚线的区域突破线,位于该区域上方和下方,距离为 TOP-BOTTOM 区间的 1/8。TOP 和 BOTTOM 周围也有一条同样大小的着色带。 图表上显示的内容 TOP 与 BOTTOM、六条江恩线及其名称,显示在当前K线的右侧 当前日、周或
MACD divergency
Ivan Stefanov
4.7 (10)
该指标准确地识别出价格走势与MACD柱状图之间的牛市和熊市背离,使用的指数移动平均线(EMA)周期为5(快速),34(慢速),信号线周期为5。该指标突出显示了动能减弱的点,提示可能的趋势反转。 正确识别背离的规则: 当价格形成更低的低点,而MACD柱状图同时在零线之上形成更高的低点时,牛市背离有效。 当价格形成更高的高点,而MACD柱状图同时在零线以下形成更低的高点时,熊市背离有效。 如果柱状图的极值和价格的极值没有位于零线的同一侧,则背离信号无效,因为这可能导致假信号。 这种方法代表了应用MACD背离分析最准确和可靠的方法。 指标特点: 清晰地标记已确认的牛市和熊市背离。 严格遵守MACD背离验证规则,提高可靠性。 其他信息:该指标作为MetaTrader 5的EX5编译文件提供。它不需要外部库或DLL文件。建议交易者将此工具与整体交易策略一起使用。在进行真实交易前,请务必在模拟账户中充分测试。该指标不保证盈利,仅作为帮助识别真实MACD背离的分析工具。
FREE
Primes Action
Ivan Stefanov
Primes Action 在图表上绘制前一日、前一周和前一月的高点和低点,并在价格突破这些位置时给出提示。每个周期使用各自的颜色,三条参考线一目了然。 水平线如何确定 一个周期的精确高点或低点往往只是一根短促的尖刺。Primes Action 取前一个已完成周期的上八分之一和下八分之一区间,在每个区间内绘制价格停留时间最长的位置。计算使用一分钟数据,而不是您当前图表的K线。因此,日线、周线和月线的水平线在 M5、H1 或 H4 上完全相同。 每一天在纽约收盘时结束,即纽约时间 17:00。美国夏令时自动处理。一周从纽约时间周日 17:00 到周五 17:00。因此,这些水平线不依赖于经纪商服务器的时区。 突破线 W. D. Gann 描述过 lost motion:价格可以稍微越过一个水平位而并未真正突破它。Primes Action 在每条水平线之外绘制一条突破线,距离为高低两条水平线之间区间的八分之一。只有当前 Bid 价格越过这条线时,才标记为多头或空头突破。箭头标出发生突破的那根K线。水平线与其突破线之间的区域会被填色。 面板 面板显示三个周期各自的状态:中性、多头或
Ichimoku Nexus Pro
Ivan Stefanov
5 (1)
Ichimoku Nexus Pro 一目均衡表,将细田悟一的全部三大理论呈现在同一张图表上:五条线、波动论(I、V、N、P、Y、W 波)、价格论(N、V、E、NT 目标)和时间论(基本数值与对等数值的时间计数)。 另外还包含:不重绘的高周期云图、经过测算的迟行带(Chikou Span)、在基准线走平、云层过薄或价格处于云中时暂停交叉信号的震荡过滤器,以及读取"市场报价"中全部品种并按可靠度排序的扫描器。 多数一目均衡表工具只画五条线,再加一个面板和一个提醒。五条线只是一目均衡表的第一部分。细田悟一把这套系统建立在三大理论之上:行情的形态、应走的幅度,以及何时应当发生变化。Ichimoku Nexus Pro 三者全画。 五条线 转换线、基准线、云(先行带 A 与 B)和迟行带均在指标内部计算。策略测试器中的数值与实盘图表完全一致,没有断档,也没有空值。 周期预设: Traditional 9 / 26 / 52 / 26 Crypto 20 / 60 / 120 / 30 Doubled 18 / 52 / 104 / 26 Auto:加密货币品种用 Crypto,其余一律用 Tr
FREE
KAMA Confluence Engine
Ivan Stefanov
5 (2)
KAMA Confluence Engine 顺势交易——在趋势反转的那一刻立即知道你的入场、止损和目标位。 KAMA Confluence Engine 是一款基于考夫曼自适应移动平均线(KAMA)的全能趋势指标,并结合了成交量加权、多周期共振确认以及自动交易水平。它会根据市场环境自动调整:在趋势行情中快速敏捷,在震荡行情中平稳过滤噪音——让你始终站在正确的一侧。 它的独特之处 成交量加权自适应引擎 ——当真实的成交量进入市场时,KAMA 线会加速;当成交量减弱时,它会放缓,让你留在强势行情中,避开假突破。 醒目的霓虹趋势带 ——亮丽、流畅的线条,底部带有深色阴影。绿色 = 上升趋势,红色 = 下降趋势,灰色 = 横盘/无交易。趋势一眼即可识别,即使远距离也清晰可见。 趋势颜色蜡烛图 ——蜡烛本身会根据趋势着色,让整个图表呈现统一的趋势故事。 自动 Entry / SL / TP 水平(新功能) 当新趋势出现时,指标会自动在图表上绘制可直接使用的交易水平: 入场线位于信号价格 止损由 ATR 计算(根据品种波动性自动调整) TP1 / TP2 / TP3 按你设定的风险回报比(默认
Order Block Scorecard 在您的图表上标记供给区与需求区,并为每一个区域记录来自您自己历史数据的三项数值:价格进入该区域的次数、其中有多少次被守住,以及此后价格走出的最远距离。 这三个数字描述的是您眼前这个品种与周期上已经发生的事情。它是过去行为的记录,不是预测。 区域规则 只有一条规则,完整写出,您可以在任何一根K线上用肉眼验证: 供给区 - 下跌前的最后一根阳线,且该下跌在允许的K线数量内走完所需距离 需求区 - 上涨前的最后一根阴线,条件相同 区域就是这根K线,取整根或仅取实体,由您选择。没有隐藏过滤,没有平滑处理。 每个区域的记录 从区域生成的那一刻起,指标沿历史向前推演并记录发生了什么: 测试次数 - 价格进入该区域的次数 守住次数 - 其中有多少次之后出现了足够大的离开走势 最佳 - 触及后价格从区域边界走出的最远距离 当一个区域结束时它会变灰:或者因为有K线收盘穿过了它的远端边界,或者因为它已被测试到您允许的次数上限。结束的区域仍留在图表上,因为失效的区域同样是记录的一部分。 大幅走势上的箭头 当一次触及之后出现了超过您设定阈值的走势,会从区域边界画出一
FREE
Meravith
Ivan Stefanov
5 (3)
做市商工具。 Meravith 将: 分析所有时间周期并显示当前正在运行的趋势。 标注流动性区域(成交量均衡区),即多头与空头成交量相等的位置。 在您的图表上直接显示来自不同时间周期的所有流动性水平。 生成并展示基于文本的市场分析供您参考。 根据当前趋势计算目标位、支撑位和止损位。 计算交易的风险回报比。 根据您的账户余额计算仓位大小,并估算潜在利润。 在市场出现重大变化时,Meravith 还会发出警告。 指标的主要线条: 多头/空头成交量衰竭线 —— 作为目标位使用。 趋势线 —— 指示市场趋势方向。根据市场是多头还是空头而改变颜色,并作为趋势支撑。其颜色主要反映市场情绪。 成交量均衡线(Eq)—— Eq(Volume Equilibrium)是系统的核心。它表示买卖双方成交量的平衡点,即市场流动性所在位置。向上突破 Eq 表示多头倾向,向下突破 Eq 表示空头倾向。突破后,应等待回调——当价格回到相反趋势的偏离线或衰竭线附近时。 使用方法:只需将其添加到图表中。 Meravith 可以分析一切——趋势和回调。 趋势线与某条成交量衰竭线之间的距离越大,说明该方向的成交量越高。 趋
RSI Divergence Pulse 是一个全面的 RSI 指标,结合了背离检测、多时间框架分析和可视化工具于一身,轻量级应用。它自动识别常规和隐藏背离,显示实时多时间框架 RSI 面板,填充 OB/OS 区域以便视觉识别,在价格图表和 RSI 子窗口上绘制背离线,放置买卖箭头,并提供实时警报。 Features Color-Coded RSI Line RSI 线根据当前区域改变颜色。蓝色表示中性区域(30 到 70 之间)。绿色标记超买区域(高于 70)。红色标记超卖区域(低于 30)。 RSI Signal Line RSI 的 SMA(默认周期 9)作为信号线。RSI 和信号线的交叉提供额外的时机信息。差值(Diff)显示在仪表板中。 Automatic Divergence Detection 基于分形的枢轴算法扫描最多 500 根 K 线,检测两种类型的背离。常规(实际)背离识别经典反转信号,即价格创出新极值而 RSI 不认可。隐藏背离识别趋势延续信号,在回调期间。 Dual Divergence Lines 实线代表常规背离,虚线代表隐藏背离。线条同时绘制在价格图表
Imbalance Pro
Ivan Stefanov
5 (4)
该指标测量所选时段内牛市和熊市之间的不平衡,并在两点之间显示一条直线。 如果牛市的成交量大于熊市,则该线变为绿色。 如果熊市成交量更大,则为红色。 直线还显示成交量的百分比差异。 该指标在单独的窗口中显示相同的数据。您还可以看到分割后的成交量。 该指标有两种模式。 为此,左上方有一个按钮、  - 如果不按下,它将测量市场任意点与当前价格之间的不平衡。 - 如果按下按钮,则可以测量市场任意两点之间的平衡。 该指标测量所选时段内牛市和熊市之间的不平衡,并在两点之间显示一条直线。 如果牛市的成交量大于熊市,则该线变为绿色。 如果熊市成交量更大,则为红色。 直线还显示成交量的百分比差异。 该指标在单独的窗口中显示相同的数据。您还可以看到分割后的成交量。 该指标有两种模式。 为此,左上方有一个按钮、  - 如果不按下,它将测量市场任意点与当前价格之间的不平衡。 - 如果按下按钮,则可以测量市场任意两点之间的平衡。
RSI Divergence Pulse is an RSI-based indicator for MetaTrader 4. It detects regular and hidden divergences, draws them on the price chart and in the RSI subwindow, shows RSI values from five timeframes in one panel, and reports the current RSI state in an information panel. Alerts can be sent when a divergence is confirmed. How it works The indicator calculates a standard RSI and a signal line, which is a simple moving average of the RSI. Significant RSI highs and lows are located with a frac
Enigmera
Ivan Stefanov
5 (9)
ENIGMERA: 市场的核心 重要提示:MQL5.com 演示版本在策略测试器中运行,可能无法完全反映 Enigmera 的功能。请查看描述、截图和视频了解详细信息。如有任何问题,请随时联系我! 该指标的代码已完全重写。版本 3.0 增加了新功能并修复了自指标发布以来积累的错误。 简介 这个指标和交易系统是金融市场的一种独特方法。ENIGMERA 使用分形周期来精确计算支撑和阻力水平。它展示了真实的积累阶段,并提供了方向和目标。无论是在趋势中还是在修正中,这个系统都能工作。 它是如何工作的 指标的大部分功能通过图表左侧的按钮控制,使得能够快速响应不同的市场情况。 按钮 ON/OFF – 显示或隐藏整个指标。 Channel – 激活支撑通道,显示可接受的偏差范围。 Dev1 (第一偏差) – 指示价格在支撑偏差内的波动,信号表示市场正在整合或积累力量。 Dev2 (第二偏差) – 显示价格在偏差之间的波动,表示趋势形成和方向。 Dev3 (第三偏差) – 表示趋势的显著加速和高波动性。 45deg (45度) – 显示市场的节奏和相对于 45 度线的运动稳定性。 Tgt1/2
Sense
Ivan Stefanov
5 (2)
SENSE 是一个自动系统,它将选定的 GANN 方法与分形计算相结合。系统会告诉我们在哪里开仓,在哪里平仓。无需再将时间浪费在复杂的计算上 - SENSE 会为您完成一切。只需安装指标即可。 基本原则: 当价格高于白线时,市场看涨 在白线上方买入,在白线下方止损 绿线为上涨目标 当价格低于白线时,市场看跌。 在白线下方卖出,在白线上方止损 红线为下行目标 双绿线或红线表示较强的区域。 为什么是 SENSE? 获利目标: SENSE 自动设置获利目标,帮助您最大限度地提高交易成功率。 自动适应: 该指标可自动重新计算任何时间框架,提供准确可靠的信号,无需手动调整。 非常适合剥头皮交易。 查看演示版! SENSE 是一个自动系统,它将选定的 GANN 方法与分形计算相结合。系统会告诉我们在哪里开仓,在哪里平仓。无需再将时间浪费在复杂的计算上 - SENSE 会为您完成一切。只需安装指标即可。 基本原则: 当价格高于白线时,市场看涨 在白线上方买入,在白线下方止损 绿线为上涨目标 当价格低于白线时,市场看跌。 在白线下方卖出,在白线上方止损 红线为下行目标
Two Snakes
Ivan Stefanov
5 (1)
GANN Master
Ivan Stefanov
5 (1)
GANN Master 为当前的日、周或月绘制江恩(W. D. Gann)平方根水平,并标出买方与卖方目标相遇的区域。水平由上一周期的最高价和最低价计算,在整个周期内保持不变,不会重画。 水平如何构建 上一周期的最高价成为 TOP 线,其最低价成为 BOTTOM 线。指标从 TOP 向下量出三个看跌目标(Bears' interest 1、2 和 3),从 BOTTOM 向上量出三个看涨目标(Bulls' interest 1、2 和 3),使用江恩的平方根步长 1/8、2/8 和 3/8。 江恩计算始终需要一个比例。GANN Master 会自行选择:它尝试每一个比例,并保留使看涨线与看跌线彼此最接近的那一个。当一条看跌线与一条看涨线相互靠近时,双方的利益就在此相遇。指标把这些位置着色为共同利益区域。每个周期最多绘制五个区域。 每个区域周围有两条虚线的区域突破线,位于该区域上方和下方,距离为 TOP-BOTTOM 区间的 1/8。TOP 和 BOTTOM 周围也有一条同样大小的着色带。 图表上显示的内容 TOP 与 BOTTOM、六条江恩线及其名称,显示在当前K线的右侧 当前日、周或
Fifty Pro
Ivan Stefanov
5 (1)
FIFTY 指标现在提供自动化版本,无需手动绘制水平线。此版本可自动在图表上绘制每日、每周、每月和年度水平线,确保准确性并节省时间。此外,提供按钮以切换这些水平线的可见性,实现完全自定义。对于喜欢手动操作的用户,免费版本仍然可用且功能齐全,让交易者可以根据自己的需求选择手动或自动工具。 最符合逻辑的指标之一。 高度可靠。 FIFTY 指标现在提供自动化版本,无需手动绘制水平线。此版本可自动在图表上绘制每日、每周、每月和年度水平线,确保准确性并节省时间。此外,提供按钮以切换这些水平线的可见性,实现完全自定义。对于喜欢手动操作的用户,免费版本仍然可用且功能齐全,让交易者可以根据自己的需求选择手动或自动工具。 最符合逻辑的指标之一。 高度可靠。
Fifty Pro MT5
Ivan Stefanov
这是为数不多仅基于价格计算水平的指标之一。该指标不受时间周期、趋势或市场周期的影响,是有史以来最具逻辑性的指标之一。 现在, FIFTY 指标推出了自动版本,无需手动绘制水平线。此版本会自动在图表上绘制每日、每周、每月和每年的水平线,确保精确并节省时间。此外,提供了按钮用于切换这些水平线的显示,方便用户完全自定义。对于喜欢手动方式的用户,免费版本仍然可用且功能齐全,可根据交易需求选择手动或自动工具。 非常可靠,强烈推荐!快来索取你的手动版 FIFTY 指标吧! 这是为数不多仅基于价格计算水平的指标之一。该指标不受时间周期、趋势或市场周期的影响,是有史以来最具逻辑性的指标之一。 现在, FIFTY 指标推出了自动版本,无需手动绘制水平线。此版本会自动在图表上绘制每日、每周、每月和每年的水平线,确保精确并节省时间。此外,提供了按钮用于切换这些水平线的显示,方便用户完全自定义。对于喜欢手动方式的用户,免费版本仍然可用且功能齐全,可根据交易需求选择手动或自动工具。 非常可靠,强烈推荐!快来索取你的手动版 FIFTY 指标吧!
Speculator MT5
Ivan Stefanov
SPEKULATOR 是一个手动交易系统和指标,帮助您识别关键支撑区域和市场方向。 用简单的策略和隐藏的智慧掌握市场。 您可以在图表上选择任意一个顶部(TOP)和底部(BOTTOM),指标将自动绘制: 您趋势方向的支撑区。 如果是多头趋势,将显示绿色区域;如果是空头趋势,将显示红色区域。该支撑区的灵敏度可以在设置中调整。该区域基于您选择的趋势,表示支撑最可能出现的位置。 高偏差线和低偏差线 根据甘氏九宫格(W.D. Gann’s Square of 9)计算的角度线 入场规则如下: 如果价格向上突破高偏差线,可以做多 如果价格向下突破低偏差线,可以做空 如果价格在偏差线之间震荡,可以在区间内高抛低吸,同时遵守支撑区的方向 甘氏角度线可用作止盈参考 关键水平是360度线: 如果价格高于该线,市场可能会上涨 如果价格低于该线,市场可能会继续下跌 加载指标后,它会出现在图表上的第20根到第50根K线之间。 点击该线即可激活,激活后可以将其移动到任意顶部或底部。 SPEKULATOR 是少数几个将清晰逻辑与优雅视觉效果结合在一起的指标之一。 您可以选择启用区域之间的颜色渐变,使图表显示更为平
Naturu
Ivan Stefanov
5 (1)
“Naturu” 是一个使用大自然对称性作为算法的手动指标。 用简单策略和隐藏智慧,掌控市场! 加载指标后,您会看到两条线——上线(Top)和下线(Bottom)。 单击一次即可激活某条线。要移动,只需点击您想放置该线的那根K线。 您设定一个高点和一个低点,指标会自动计算: 洋红色区域,显示多空双方兴趣最接近之处,也就是最有可能成为支撑/阻力的区域。 灰色区域,标示下一层次的关注区。 青绿色线条,表示多方的目标价位。 金色线条,表示空方的目标价位。 手动指标赋予您完全的控制和灵活性,让您根据实时市场环境和个人直觉调整级别。它们迫使您更深入地亲自分析价格走势,帮助您真正理解支撑、阻力和形态是如何形成的。依靠人工判断,可以过滤掉自动系统常常误判的大量“噪音”,减少错误信号。而且,因您亲自设定每个级别,可在突发新闻或极端行情时立即调整,无需等候代码更新。 隐藏于简单游戏背后的神圣力量!
Chart AI Assistant – 一键完成实时图表的 AI 分析 AI 会像您一样查看图表的画面。它看到屏幕上的蜡烛、价位和指标,读懂它们,然后告诉您正在发生什么。 Chart AI Assistant 像经验丰富的交易者一样分析您的图表,并告诉您它看到了什么:结构、区域、流动性、形态、成交量以及可能的下一步走势。它适用于任何品种和任何周期。按下 ANALYZE,答案就会以您的语言显示在图表上。 该助手不交易,也不开仓或平仓。它为您提供第二个意见,而每一个决定仍由您自己做出。 工作方式 将该 EA 加载到任何图表上。 勾选您关心的问题。 按下 ANALYZE。 答案会显示在图表旁的面板上,关键价格水平会绘制在图表上。 只问您想知道的 共有九个问题按钮。您可以任意组合: BOS / CHOCH Order Block Fair Value Gap Nearest Liquidity Chart Pattern Candle Pattern What is the Trend? Analyze Volume Most Important 全部九项都勾选时,您将得到完整分析:市场背
Gann Gold Scalp Gann Gold Scalp 是一款用于 MetaTrader 5 的黄金剥头皮指标。它在日、周、月的江恩水平上显示在哪里开仓、在哪里止盈以及止损在哪里。 清晰的 BUY 和 SELL 信号,两个入场点,TARGET 1 和 TARGET 2,STOP,图表警报和推送通知。 不重绘。专为 M5 上的 XAUUSD 设计,在外汇、指数、股票以及比特币等加密货币上同样适用,适用于所有时间周期。 在哪里开仓,在哪里平仓 在江恩水平之间,指标绘制出战斗区域,即买方和卖方相遇的地方。它们是一眼就能看到的支撑和阻力区域:离价格最近的区域最亮,较远的区域逐渐变淡。 当价格从一个区域突破进入下一个区域时,信号出现: BUY 1 和 BUY 2 (或 SELL 1 和 SELL 2 ):两个入场位置。 TARGET 1 和 TARGET 2 :两个止盈位置。目标达到时会标上对勾。如果走势继续沿同一方向,下一个目标会显示为 TARGET 3、TARGET 4,依此类推。 STOP :对面区域被突破的大致价格。您在开仓之前就知道它。如果一根K线收盘超过该价格,STOP 会被
筛选:
John
133
John 2026.07.06 23:06 

love this developer .. friendly and engaging and very active on his telegram channel .. as for the indicator, its awesome add kama for an extra 50 bucks, and its a weapon

Ivan Stefanov
9600
来自开发人员的回复 Ivan Stefanov 2026.07.07 07:36
Thank you very much for the good words!
zeke21t2
813
zeke21t2 2026.02.15 13:00 

This is an amazing indicator that gives you a quick glimpse into the big picture, the most important aspect of trading: whether you should wait for a buying opportunity, a selling opportunity, or wait for the market to settle down. Simply avoiding false breakouts will dramatically improve your trading performance. For specific buying and selling opportunities, I highly recommend using it in conjunction with Meravith, another of the author's outstanding works. Pullback reversals and reversals from the top or bottom, which are entered based on chart highs and lows or volume changes, will become more effective. Honestly, I recommend this so much that I don't want anyone else to know about it :)

Ivan Stefanov
9600
来自开发人员的回复 Ivan Stefanov 2026.07.07 07:39
Thank you so much for the feedback — I truly appreciate it.
As the author of this indicator, my goal has always been to give traders a clear, reliable view of the market’s real direction and help them avoid unnecessary losses caused by false breakouts. I’m glad to hear it’s doing exactly that for you. Meravith is indeed a great companion tool, especially for timing precise entries during pullbacks or reversals. When used together, both indicators complement each other and make decision‑making much more straightforward. Your support means a lot — and your last sentence made me smile. I’m really glad you find it valuable.
Max2233
807
Max2233 2025.07.08 10:33 

I would like to compliment this work of art composed by IVAN, a very precise indicator and in combination with his other jewels created by him, trading has simply become simpler and more intuitive. A round of applause to IVAN.

Ivan Stefanov
9600
来自开发人员的回复 Ivan Stefanov 2026.07.07 07:39
Thank you sincerely for your words — they mean a lot.
I’m truly glad to hear that my work helps make your trading simpler, clearer, and more intuitive. Every indicator I create is designed to complement the others, so hearing that the combination works so well for you is incredibly rewarding. Your appreciation and support are genuinely motivating.
Thank you for the applause — it’s received with gratitude.
Mase
1799
Mase 2025.05.29 14:17 

Simply perfect! In combination with Ivan's other technical indicators, it is a powerful tool. Warning: highly addictive, as the indicators bring so much joy and success. Highly recommended.

Ivan Stefanov
9600
来自开发人员的回复 Ivan Stefanov 2026.07.07 07:40
Thank you so much for your kind words — I truly appreciate it.
I’m really glad to hear that the indicators work powerfully together and bring both clarity and enjoyment to your trading. Creating tools that make the process intuitive and effective has always been my goal, so feedback like yours means a lot. And your “warning” made me smile — I’ll take that as a compliment.
Thank you for the recommendation and for the support.
回复评论