Transaction Speed MT5

5

이 지표는 시장에서 관심이 나타나는 영역을 강조 표시한 후, 주문이 누적되는 영역을 보여줍니다.
이는 **대규모 오더북(호가창)**처럼 작동합니다.
이것은 거대한 자금을 위한 인디케이터입니다. 성능은 탁월하며,
시장에서 어떤 관심이 있든 반드시 포착할 수 있습니다.

(이것은 완전히 새로 작성되고 자동화된 버전입니다 – 이제 수동 분석은 필요하지 않습니다.)
**거래 속도(Transaction Speed)**는 새로운 개념의 인디케이터로,
시장에 대규모 주문이 언제, 어디에 쌓이는지를 보여주며, 그 이점을 분석합니다.
매우 초기 단계에서 트렌드 전환을 감지할 수 있습니다.
FX 시장에서 흔히 사용하는 "거래량(volume)"은 오해입니다. 실제로는 시간당 가격 변화량이므로, 올바른 용어는 거래 속도입니다.
우리가 어떻게 사고하고, 행동하며, 분석하느냐가 가장 중요합니다.
분석 패러다임의 전환은 필수적입니다.
이 인디케이터는 외환 시장에서의 볼륨 개념을 논리적으로 재정의하여,
정확하고 독특한 도구로 만들어 줍니다.

사용 방법:

기본적으로 이 지표는 자동 모드로 설정되어 있으며, 모든 시간 프레임에서 독립적으로 작동합니다.
수동 모드로 전환하려면, Auto / Manual Mode 버튼을 클릭하면 됩니다.

수동 모드에서는 모든 계산이 2025년 1월 1일부터 시작됩니다.
이 날짜는 원하는 대로 변경 가능하며, 다양한 결과를 분석할 수 있습니다.
권장되는 데이터 기간은 4~6개월입니다.
이 기간은 여러 사이클을 포함하기 때문에 결과의 신뢰도를 높여줍니다.
기간이 길수록 표시되는 존(Zone)은 적어집니다.

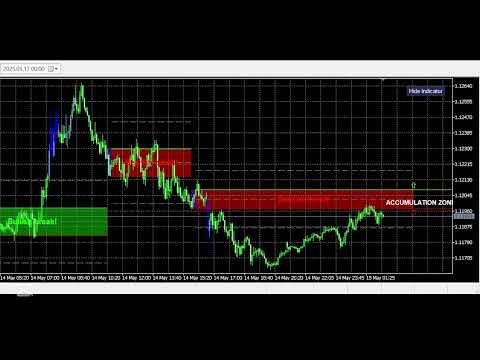
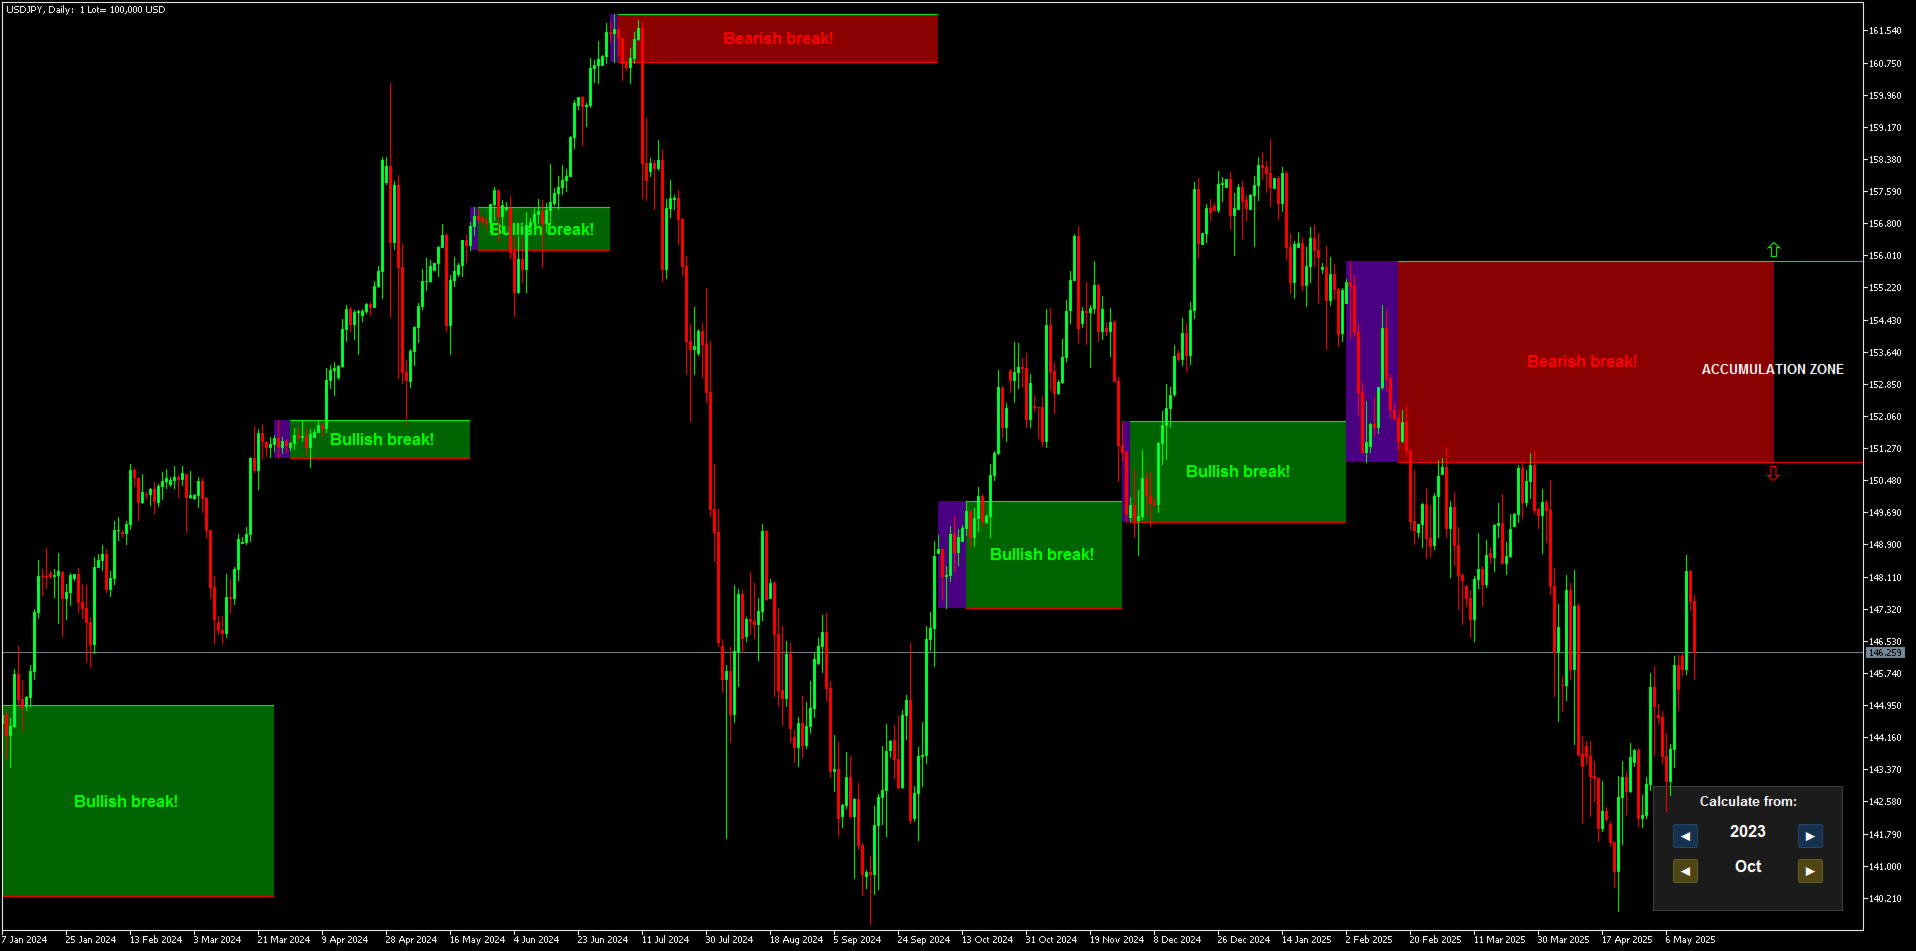
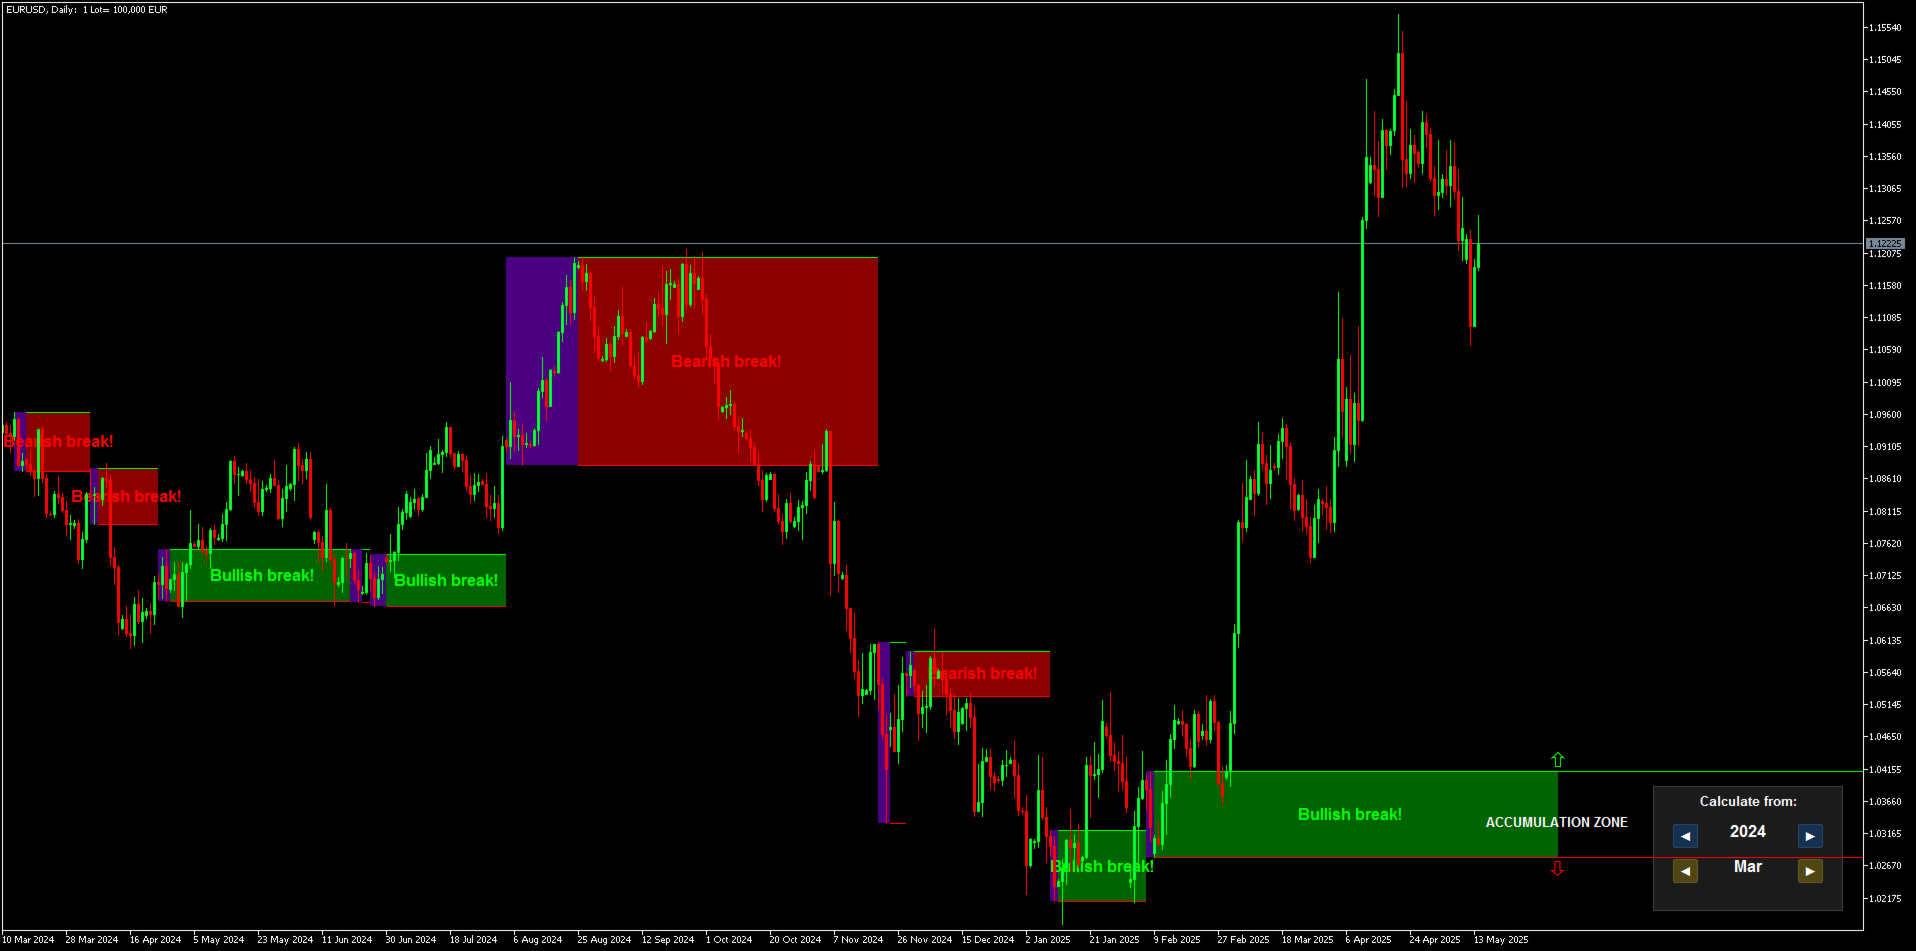
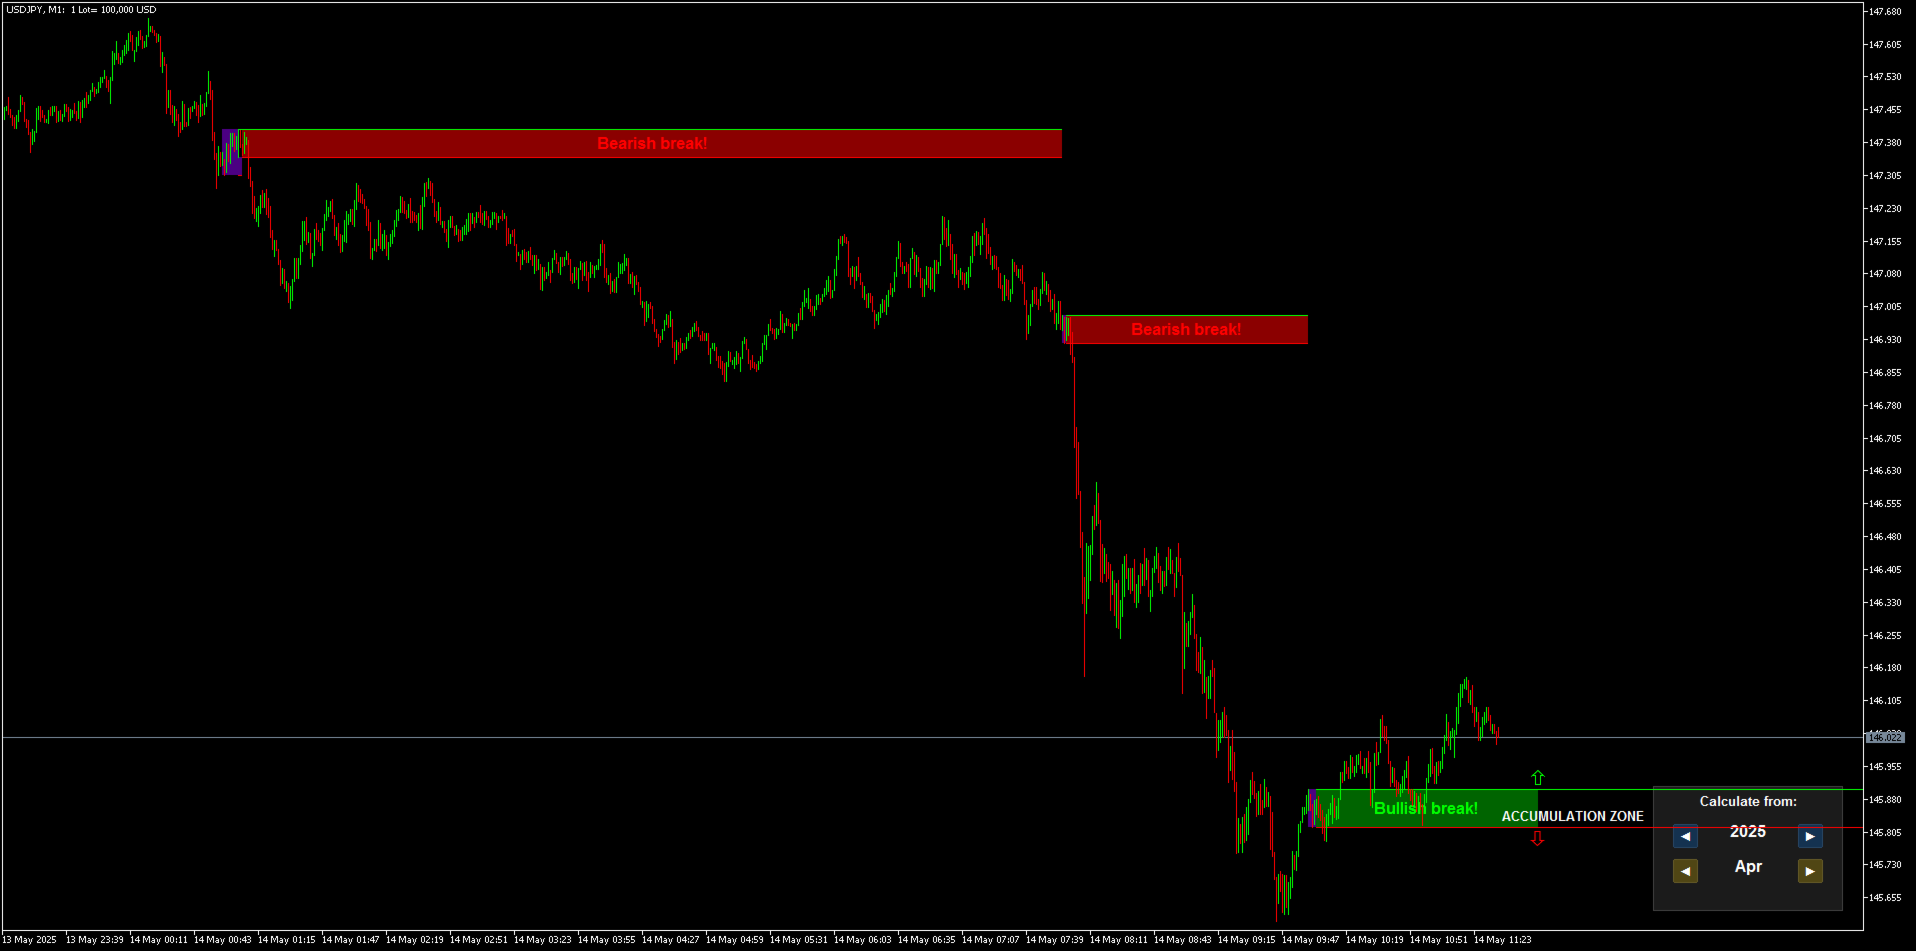
시장에 명확한 관심이 드러나면, 보라색 사각형으로 강조 표시됩니다.
그 후에 **주문 누적 존(Order Accumulation Zone)**이 생성됩니다.

  • 가격이 이 존을 상방 돌파하면, 상승 추세로 간주되며, 존은 녹색으로 바뀝니다.

  • 가격이 하방 돌파하면, 하락 추세로 간주되고, 존은 빨간색으로 표시됩니다.

캔들이 존 바깥에서 완전히 형성되고, 경계선을 건드리지 않으면,
**진짜 돌파(Breakout)**로 판단합니다.

캔들이 완전히 존 외부에서 형성되면, 이는 돌파 신호이며 시장의 방향을 알려줍니다.
트렌드는 반대 방향으로 돌파가 발생하거나,
새로운 관심 존이 나타날 때까지 유지됩니다.

당신은 "존에서 존까지" 전략으로 매매할 수 있습니다:

예시 1:
주문 누적 존이 돌파되면, 시장의 방향으로 진입하세요.

예시 2:
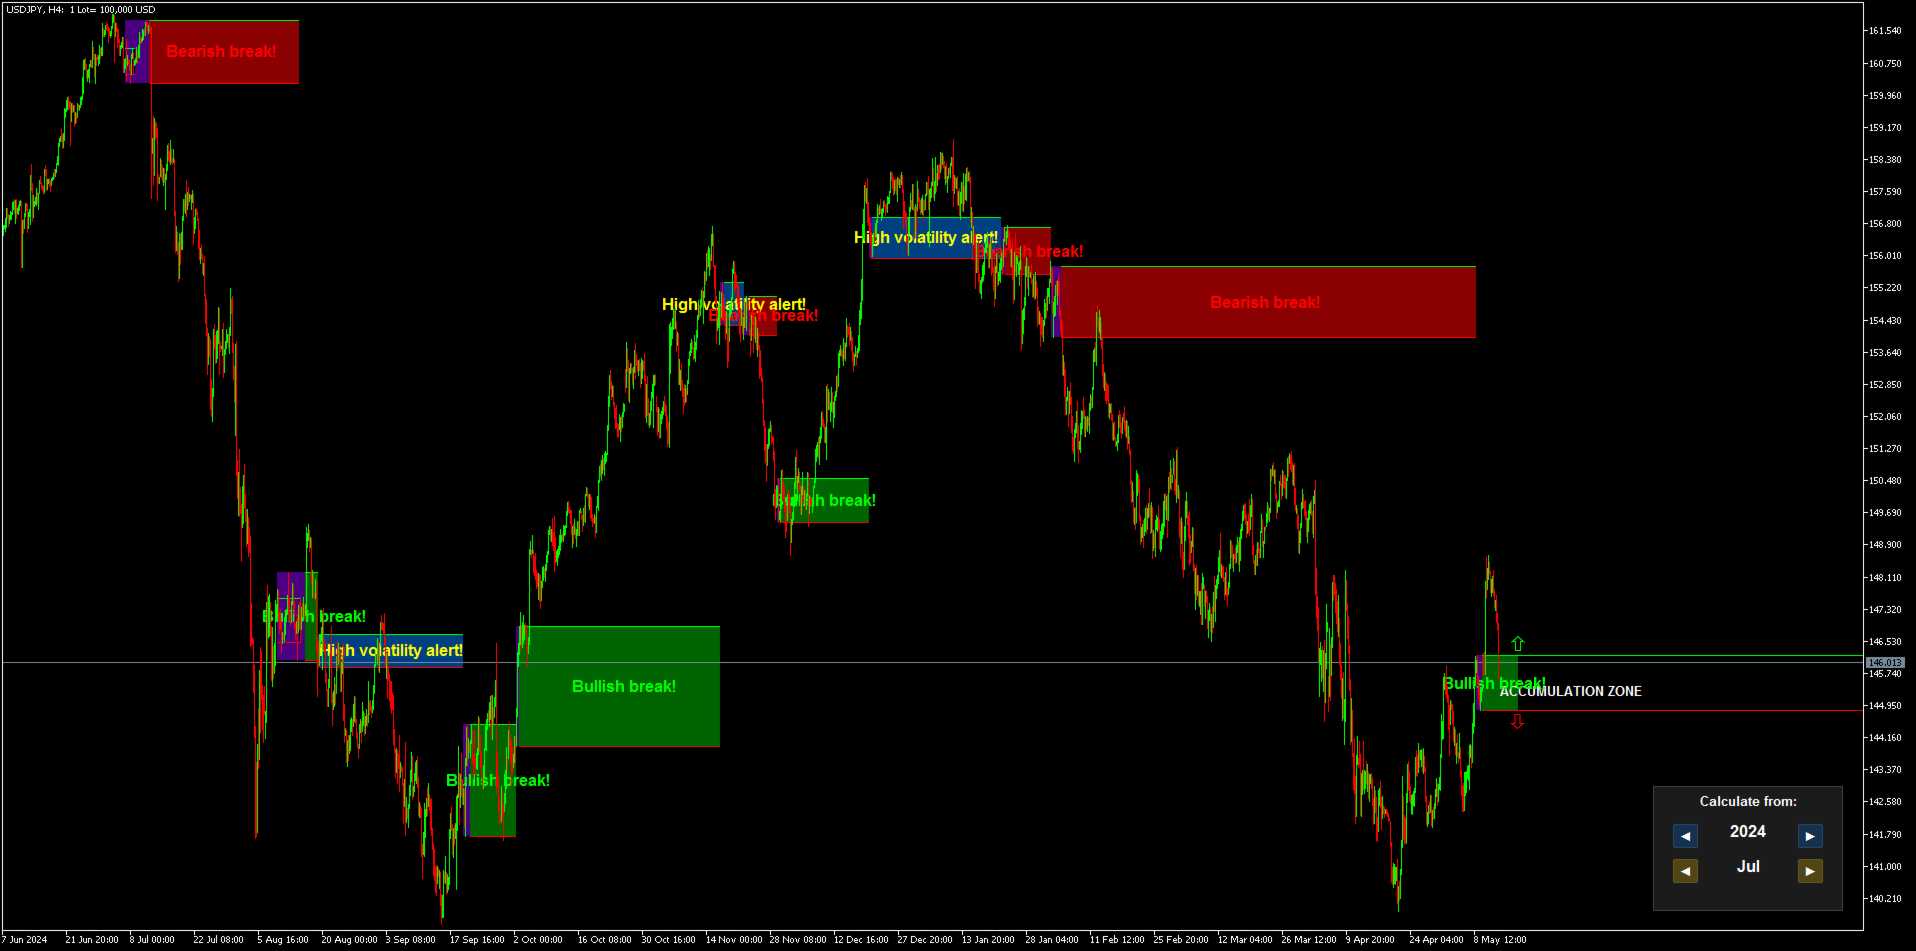
4시간 차트에서 상방 돌파가 발생하고 시장이 상승합니다.
그 후 1시간 차트에서 새로운 존이 생기면,
포지션을 종료하고 1시간 존이 새로운 방향을 제시할 때까지 기다릴 수 있습니다.

예시 3:
당신이 존 안에 있을 때는, 윗쪽에서 매도, 아랫쪽에서 매수를 시도할 수 있습니다.
이는 레인지 트레이딩이지만 위험도가 높습니다.
절대로 인디케이터 방향에 반대하여 매매하지 마세요! 절대 안 됩니다!

존이 양방향으로 동시에 돌파되면,
**고변동성 경고(High Volatility Alert)**가 표시됩니다.

이것이 바로 자금의 흔적입니다.
그리고 이것은 눈으로 볼 수 없는 것들입니다.
왜냐하면 우리는 FX에서 틱 볼륨만 보기 때문인데,
이것은 시장에서 가장 큰 오해 중 하나입니다.

거래 속도 인디케이터는 틱 볼륨을 실제 시장 활동으로 변환해줍니다.

이것은 고급 분석을 위해 설계된 매우 진지한 도구입니다.

추천 설정:

  • 통화쌍: 높은 틱 볼륨이 있는 종목만 (예: EUR/USD, USD/JPY, GBP/USD 등)

  • 시간 프레임: 모든 시간대

  • 최소 예치금: 없음

  • 계좌 유형: 제한 없음

  • 브로커: 제한 없음, 그러나 대형 브로커가 거래량이 많아 더 적합

순수한 과학입니다.


리뷰 3
zeke21t2
306
zeke21t2 2026.02.15 13:00 
 

This is an amazing indicator that gives you a quick glimpse into the big picture, the most important aspect of trading: whether you should wait for a buying opportunity, a selling opportunity, or wait for the market to settle down. Simply avoiding false breakouts will dramatically improve your trading performance. For specific buying and selling opportunities, I highly recommend using it in conjunction with Meravith, another of the author's outstanding works. Pullback reversals and reversals from the top or bottom, which are entered based on chart highs and lows or volume changes, will become more effective. Honestly, I recommend this so much that I don't want anyone else to know about it :)

Max2233
554
Max2233 2025.07.08 10:33 
 

I would like to compliment this work of art composed by IVAN, a very precise indicator and in combination with his other jewels created by him, trading has simply become simpler and more intuitive. A round of applause to IVAN.

Mase
1739
Mase 2025.05.29 14:17 
 

Simply perfect! In combination with Ivan's other technical indicators, it is a powerful tool. Warning: highly addictive, as the indicators bring so much joy and success. Highly recommended.

추천 제품
Trade smarter, not harder: Empower your trading with Harmonacci Patterns This is arguably the most complete harmonic price formation auto-recognition indicator you can find for the MetaTrader Platform. It detects 19 different patterns, takes fibonacci projections as seriously as you do, displays the Potential Reversal Zone (PRZ) and finds suitable stop-loss and take-profit levels. [ Installation Guide | Update Guide | Troubleshooting | FAQ | All Products ] It detects 19 different harmonic pri
Owl Smart Levels MT5
Sergey Ermolov
4.03 (32)
MT4 버전  |  FAQ Owl Smart Levels Indicator 는 Bill Williams 의 고급 프랙탈, 시장의 올바른 파동 구조를 구축하는 Valable ZigZag, 정확한 진입 수준을 표시하는 피보나치 수준과 같은 인기 있는 시장 분석 도구를 포함하는 하나의 지표 내에서 완전한 거래 시스템입니다. 시장과 이익을 취하는 장소로. 전략에 대한 자세한 설명 표시기 작업에 대한 지침 고문-거래 올빼미 도우미의 조수 개인 사용자 채팅 ->구입 후 나에게 쓰기,나는 개인 채팅에 당신을 추가하고 거기에 모든 보너스를 다운로드 할 수 있습니다 힘은 단순함에 있습니다! Owl Smart Levels 거래 시스템은 사용하기 매우 쉽기 때문에 전문가와 이제 막 시장을 연구하고 스스로 거래 전략을 선택하기 시작한 사람들 모두에게 적합합니다. 전략 및 지표에는 눈에 보이지 않는 비밀 공식 및 계산 방법이 없으며 모든 전략 지표는 공개되어 있습니다. Owl Smart Levels를 사
Gartley Projections D
Oleksandr Medviediev
3 (2)
The indicator identifies the harmonic patterns (XABCD) according to developments of H.M.Gartley ( "Profits in the Stock Market" , 1935г). It projects D-point as a point in the perspective projection (specify ProjectionD_Mode = true in the settings). Does not redraw. When a bar of the working timeframe closes, if the identified pattern point has not moved during Patterns_Fractal_Bars bars, an arrow appears on the chart (in the direction of the expected price movement). From this moment on, the ar
Overview Harmonic Patterns MT5 is a technical analysis indicator designed for the MetaTrader 5 platform. It identifies and displays harmonic price patterns, such as Butterfly, Cypher, Crab, Bat, Shark, and Gartley, in both bullish and bearish directions. The indicator calculates key price levels, including entry, stop loss, and three take-profit levels, to assist traders in analyzing market movements. Visual elements and customizable alerts enhance usability on the chart. Features Detects six ha
Matreshka
Dimitr Trifonov
5 (2)
Matreshka self-testing and self-optimizing indicator: 1. Is an interpretation of the Elliott Wave Analysis Theory. 2. Based on the principle of the indicator type ZigZag, and the waves are based on the principle of interpretation of the theory of DeMark. 3. Filters waves in length and height. 4. Draws up to six levels of ZigZag at the same time, tracking waves of different orders. 5. Marks Pulsed and Recoil Waves. 6. Draws arrows to open positions 7. Draws three channels. 8. Notes support and re
MercariaPattern1-2-3 відстежує рух ціни, знаходить трьоххвильові структури 1-2-3 та підсвічує момент, коли сценарій підтверджується пробоєм ключового рівня. MercariaPattern1-2-3 tracks price movement, detects three-leg 1-2-3 structures and highlights the moment when the scenario is confirmed by a key level breakout. Індикатор збирає локальні свінги в компактну фігуру 0–1–2–3 , чекає підтвердженого пробою та будує стрілку входу з готовими рівнями SL/TP. The indicator combines local swings into a
The RSI Divergence + FVG Signal indicator combines Relative Strength Index (RSI) Divergence with Fair Value Gap (FVG) detection to generate high-probability buy and sell signals based on both momentum shifts and institutional imbalance zones. Core Features: RSI Divergence Detection : Identifies both regular and hidden bullish/bearish divergences between price and RSI. Divergences indicate potential trend reversals or continuation. FVG Zone Recognition : Detects Fair Value Gaps (imbalances caused
Noize Absorption Index
Ekaterina Saltykova
Noize Absorption Index - is the manual trading system that measures the difference of pressure between bears forces and bulls forces. Green line - is a noize free index that showing curent situation. Zero value of index shows totally choppy/flat market.Values above zero level shows how powerfull bullish wave is and values below zero measures bearish forces.Up arrow appears on bearish market when it's ready to reverse, dn arrow appears on weak bullish market, as a result of reverse expectation.
Premium level Pro
Dmitriy Kashevich
Premium level is a unique indicator with more than 80% accuracy of correct predictions! This indicator has been tested for more than two months by the best Trading Specialists! The author's indicator you will not find anywhere else! From the screenshots you can see for yourself the accuracy of this tool! 1 is great for trading binary options with an expiration time of 1 candle. 2 works on all currency pairs, stocks, commodities, cryptocurrencies Instructions: As soon as the red arrow app
ATrend
Zaha Feiz
4.82 (17)
ATREND: 작동 방식 및 사용 방법 ### 작동 방식 MT5 플랫폼을 위한 "ATREND" 지표는 기술 분석 방법론의 조합을 활용하여 트레이더에게 강력한 매수 및 매도 신호를 제공하도록 설계되었습니다. 이 지표는 주로 변동성 측정을 위해 평균 진폭 범위(ATR)를 활용하며, 잠재적인 시장 움직임을 식별하기 위한 트렌드 탐지 알고리즘과 함께 사용됩니다. 구매 후 메시지를 남기면 특별 보너스 선물을 받게 됩니다. ### 주요 특징: - 동적 트렌드 탐지: 이 지표는 시장 트렌드를 평가하고 신호를 조정하여 트레이더가 현재 시장 상황에 맞춰 전략을 조정할 수 있도록 돕습니다. - 변동성 측정: ATR을 사용하여 시장의 변동성을 측정하며, 이는 최적의 손절매(SL) 및 이익 실현(TP) 수준을 결정하는 데 중요합니다. - 신호 시각화: 이 지표는 차트에 매수 및 매도 신호를 시각적으로 표시하여 트레이더의 의사 결정을 향상시킵니다. ### 운영 단계 #### 입력 및 설정 - TimeFr
"Impulses and Corrections 5" is created to help traders navigate the market situation. The indicator shows multi-time frame upward and downward "Impulses" of price movements. These impulses are the basis for determining the "Base" , which is composed of zones of corrections of price movements, as well as "Potential" zones for possible scenarios of price movement. Up and down impulses are determined based on a modified formula of Bill Williams' "Fractals" indicator. The last impulse is always "U
The indicator detects and displays М. Gartley's Butterfly pattern. The pattern is plotted by the extreme values of the ZigZag indicator (included in the resources, no need to install). After detecting the pattern, the indicator notifies of that by the pop-up window, a mobile notification and an email. The pattern and wave parameters are displayed on the screenshots. The default parameters are used for demonstration purposes only in order to increase the amount of detected patterns. Parameters z
Manyal trading system, CovEchoTrend Robot, focuses on reliability and flexibility. By employing statistical analysis methods to study the relationships between the base indicator and market patterns, the system enables a deeper understanding of market processes. Intelligent pattern analysis: The application of statistical data processing helps identify key trend reversal points more accurately, signaling significant market shifts. Informed decision-making is based on the intersection of indicato
SMC Venom Model BPR 지표는 Smart Money(SMC) 개념 내에서 일하는 트레이더를 위한 전문 도구입니다. 가격 차트에서 두 가지 주요 패턴을 자동으로 식별합니다. FVG (공정 가치 갭)는 3개의 캔들의 조합으로, 첫 번째와 세 번째 캔들 사이에 갭이 있습니다. 이는 볼륨 지원이 없는 레벨 사이에 구역을 형성하여 종종 가격 수정으로 이어집니다. BPR (균형 가격 범위)은 두 개의 FVG 패턴의 조합으로, "브리지"를 형성합니다. 이는 가격이 낮은 볼륨 활동으로 움직일 때 브레이크아웃과 레벨로의 복귀 구역으로, 캔들 사이에 갭을 생성합니다. 이러한 패턴은 거래자가 차트에서 거래량과 가격 역학을 분석하여 주요 지지/저항 수준, 돌파 구역 및 진입 지점을 식별하는 데 도움이 되며, 여기서 대형 시장 참여자와 일반 참여자 간의 상호 작용이 발생합니다. 이 지표는 사각형과 화살표 형태로 패턴을 시각화하며 유연한 경고 설정도 지원합니다. 주요 특징: 패턴 표시 모드
Maximum Trend Arrows OT MT5
Mulweli Valdaz Makulana
STRICTLY FOR BOOM INDEX ONLY!!!!! Here I bring the Maximum Trend Arrows OT1.0 MT5 indicator. This indicator is made up of a combination of different trend indicators for entries and exits, for entries an orange arrow will paint on the chart below the current market and a red flag for closing of trades and it produces buy arrows only. When the orange arrow appears, it will appear along with it's sound to notify you. The 1H timeframe is recommended, don't use it anywhere else than on the 1H timefr
Price Magnet — Price Density and Attraction Levels Indicator Price Magnet is a professional analytical tool designed to identify key support and resistance levels based on statistical Price Density. The indicator analyzes a specified historical period and detects price levels where the market spent the most time. These zones act as “magnets,” attracting price action or forming a structural base for potential reversals. Unlike traditional Volume Profile tools, Price Magnet focuses on price-time d
PREngulfing
Slobodan Manovski
PR EA - Engulfing Pattern Trading System Automated Engulfing Pattern Detection with MA Confirmation The PR EA is a Meta Trader 5 expert advisor that identifies and trades bullish/bearish engulfing candlestick patterns when confirmed by a moving average filter. Designed for swing trading on 30-minute charts with compatibility for M15 and H1 time frames. Key Features: Pattern Recognition - Detects valid bullish/bearish engulfing candle formations Trend Confirmation - 238-period SMA filter
# DRAWDOWN INDICATOR V4.0 - The Essential Tool to Master Your Trading ## Transform Your Trading with a Complete Real-Time Performance Overview In the demanding world of Forex and CFD trading, **knowing your real-time performance** isn't a luxury—it's an **absolute necessity**. The **Drawdown Indicator V4.0** is much more than a simple indicator: it's your **professional dashboard** that gives you a clear, precise, and instant view of your trading account status. --- ## Why This Indicator
The   Fibonacci Confluence Toolkit   is a technical analysis tool designed to help traders identify potential price reversal zones by combining key market signals and patterns. It highlights areas of interest where significant price action or reactions are anticipated, automatically applies Fibonacci retracement levels to outline potential pullback zones, and detects engulfing candle patterns. Its unique strength lies in its reliance solely on price patterns, eliminating the need for user-define
##   ONLY GOLD ##   Тiльки Золото ## **Mercaria Professional Trading Zones - Complete Guide** ## **Mercaria Professional Trading Zones - Повний посібник** ### **How Mercaria Zones Work / Як працюють зони Mercaria** **English:** Mercaria Zones is an advanced trading indicator that identifies high-probability support and resistance areas using ZigZag extremes combined with mathematical zone calculations. The indicator works on multiple timeframes simultaneously, providing a comprehensive view
Time And Sales Delta
Evgeny Shevtsov
5 (2)
The indicator displays the delta and the cumulative delta based on the "Time & Sales" deals list data. In addition to the standard timeframes, the indicator displays data regarding the seconds timeframes (S5, S10, S15, S20, S30) to choose from. Using the rectangle, user can select an arbitrary area in the indicator subwindow to view the ratio of the volumes of deals of buyers and sellers within this area. Indicator features: The indicator works correctly only on those trading symbols for which
Trend Forecaster
Alexey Minkov
5 (7)
The Trend Forecaster indicator utilizes a unique proprietary algorithm to determine entry points for a breakout trading strategy. The indicator identifies price clusters, analyzes price movement near levels, and provides a signal when the price breaks through a level. The Trend Forecaster indicator is suitable for all financial assets, including currencies (Forex), metals, stocks, indices, and cryptocurrencies. You can also adjust the indicator to work on any time frames, although it is recommen
우선적으로, 이 거래 도구는 전문적인 거래에 이상적인 비-다시 그리기 및 지연되지 않는 지표입니다.  온라인 강좌, 사용자 매뉴얼 및 데모. 스마트 가격 액션 컨셉트 인디케이터는 신규 및 경험 많은 트레이더 모두에게 매우 강력한 도구입니다. Inner Circle Trader Analysis 및 Smart Money Concepts Trading Strategies와 같은 고급 거래 아이디어를 결합하여 20가지 이상의 유용한 지표를 하나로 결합합니다. 이 인디케이터는 스마트 머니 컨셉트에 중점을 두어 대형 기관의 거래 방식을 제공하고 이동을 예측하는 데 도움을 줍니다.  특히 유동성 분석에 뛰어나 기관이 어떻게 거래하는지 이해하는 데 도움을 줍니다. 시장 트렌드를 예측하고 가격 변동을 신중하게 분석하는 데 탁월합니다. 귀하의 거래를 기관 전략에 맞추어 시장의 동향에 대해 더 정확한 예측을 할 수 있습니다. 이 인디케이터는 시장 구조를 분석하고 중요한 주문 블록을 식별하고 다양
Universal Soul Reaper
Pieter Gerhardus Van Zyl
Universal Soul Reaper is an atmospheric market-flow oscillator designed to interpret price behavior as a cycle of spiritual energy. Instead of reacting to raw price alone, it visualizes the state of the market’s soul —revealing when momentum is awakening, stabilizing, or fading. The indicator operates in a separate window and presents three interwoven entities: the Ectoplasmic Veil , the Spirit Boundary , and the Soul Core . Together, they form a living framework that helps traders sense pressu
ENGLISH DESCRIPTION (MQL5 Standard Optimized) Product Name: Obsidian Forest Automaton AI (MT5) [Subtitle: Forest Structure | Obsidian Blade TEMA | Shield Safety] Introduction Obsidian Forest Automaton AI is a structural trend-following construct designed to navigate the market with the cold precision of an automaton. It builds a "Forest Structure" using Ichimoku Cloud , cuts through noise with the Obsidian Blade (TEMA) , and validates density with Standard Deviation . This creates a system that
Terra Infinity
Ivan Simonika
Terra Infinity is a flat indicator. This improved version of the CalcFlat indicator has three additional lines that significantly increase its effectiveness. Unlike its predecessor with two static levels, Terra Infinity adds three dynamic lines above the main histogram, which are interpreted as follows: base signal line, minimum signal line, maximum signal line. These lines are formed using the additional parameter Avg, which is the average value of the histogram. Averaging produces a line cl
The  SuperTrend Advance Trading  is a widely-used technical indicator based on  SuperTrend Strategy + Price Action + EMA . How it works: -  Buy/Sell Signals  can be generated when the trend reverses, the conditions of Price action, TrendLine and EMA are met. - After the  Signal  appears, be patient and wait until the candle closes, at that time place the order as soon as possible. You may have time to review your entry, consider whether it is a good entry or not. - Carefully review the entry, up
Gioteen Volatility Index (GVI) - your ultimate solution to overcoming market unpredictability and maximizing trading opportunities. This revolutionary indicator helps you in lowering your losing trades due to choppy market movements. The GVI is designed to measure market volatility, providing you with valuable insights to identify the most favorable trading prospects. Its intuitive interface consists of a dynamic red line representing the volatility index, accompanied by blue line that indicate
Double HMA MTF for MT5
Pavel Zamoshnikov
4 (4)
This is an advanced multi-timeframe version of the popular Hull Moving Average (HMA) Features Two lines of the Hull indicator of different timeframes on the same chart. The HMA line of the higher timeframe defines the trend, and the HMA line of the current timeframe defines the short-term price movements. A graphical panel with HMA indicator data from all timeframes at the same time . If the HMA switched its direction on any timeframe, the panel displays a question or exclamation mark with a tex
Engulfing with EMAs Indicator Unlock the power of advanced candlestick pattern detection with the Engulfing with EMAs Indicator , a cutting-edge tool designed for MetaTrader 5. This futuristic indicator combines the precision of engulfing pattern analysis with the trend-following strength of Exponential Moving Averages (EMA 21 and EMA 50), empowering traders to identify high-probability setups across all currency pairs and timeframes. Key Features: Comprehensive Engulfing Detection : Detects b
이 제품의 구매자들이 또한 구매함
ARICoins
Temirlan Kdyrkhan
ARICoin is a powerful trading companion designed to generate high-probability entry signals with dynamic TP/SL/DP levels based on volatility. Built-in performance tracking shows win/loss stats, PP1/PP2 hits, and success rates all updated live. Key Features: Buy/Sell signals with adaptive volatility bands Real-time TP/SL/DP levels based on ATR Built-in MA Filter with optional ATR/StdDev volatility Performance stats panel (Success, Profit/Loss, PP1/PP2) Alerts via popup, sound, push, or email Cust
AriX
Temirlan Kdyrkhan
1 (4)
AriX Indicator for MT5 A powerful trend-following and signal-evaluation tool AriX is a custom MT5 indicator that combines Moving Averages and ATR-based risk/reward logic to generate clear buy/sell signals. It visualizes dynamic SL/TP levels, evaluates past trade outcomes, and displays win/loss statistics in a clean on-chart panel. Key features include: Buy/Sell signals based on MA crossovers ATR-based SL/TP1/TP2/TP3 levels with visual lines and labels Signal outcome tracking with real-time stat
Market Flow Pro
Gabriele Sabatino
4 (1)
Market Flow Pro Market Flow Pro is an intelligent trading advisor for the MetaTrader 5 platform, designed for automatic trading on financial markets using algorithmic analysis and strict risk management. -Key features: - Fully automatic trading 24/5 - Adaptive trend and momentum entry algorithm -  Built-in risk management - Flexible lot settings (fixed/auto-calculation) - Support for major currency pairs and indices - Optimised for operation on various timeframes  How it works Market
ARIPoint
Temirlan Kdyrkhan
ARIPoint is a powerful trading companion designed to generate high-probability entry signals with dynamic TP/SL/DP levels based on volatility. Built-in performance tracking shows win/loss stats, PP1/PP2 hits, and success rates all updated live. Key Features: Buy/Sell signals with adaptive volatility bands Real-time TP/SL/DP levels based on ATR Built-in MA Filter with optional ATR/StdDev volatility Performance stats panel (Success, Profit/Loss, PP1/PP2) Alerts via popup, sound, push, or email Cu
CGE Trading Suite
Carl Gustav Johan Ekstrom
5 (1)
CGE Trading Suite delivers the analytical edge typically reserved for professional trading desks. The platform integrates a full suite of analytical tools into one seamless workflow: dynamic grid mapping, liquidity behavior analysis, ECM, trend lines, MIDAS, trade cycles, and directional channel projections. Together, these provide a unified view of market structure and momentum. Directional clarity is further enhanced by the capital flow index, which measures currency basket strength to identif
ARIScalping
Temirlan Kdyrkhan
ARIScalp is a powerful trading companion designed to generate high-probability entry signals with dynamic TP/SL/DP levels based on volatility. Built-in performance tracking shows win/loss stats, PP1/PP2 hits, and success rates all updated live. Key Features: Buy/Sell signals with adaptive volatility bands Real-time TP/SL/DP levels based on ATR Built-in MA Filter with optional ATR/StdDev volatility Performance stats panel (Success, Profit/Loss, PP1/PP2) Alerts via popup, sound, push, or email Cus
Scalping Winning Signals Pro SWS
Muhammad Usman Siddique
5 (1)
UZFX SWS {스캘핑 승리 신호} 프로 v1.0은 빠르게 움직이는 시장에서 정확한 진입 신호를 찾는 스캘퍼, 데이 트레이더, 스윙 트레이더를 위해 Usman Zabir(UZFX LABS)가 특별히 개발한 강력하고 재도색되지 않는 지표입니다. 지연이나 잘못된 재도색 없이 신뢰할 수 있는 실시간 신호를 요구하는 트레이더에게 이상적입니다. 추천* 최적 시간대: 30분 이상. {1시간}이 가장 선호하며, 결과는 놀라울 정도입니다...! 주요 기능: 최근 및 과거 신호를 명확한 시각적 화살표로 표시(오래된 신호는 점으로 표시 옵션 포함). 자동 계산 및 그리기 기능: 진입선, 손절선(최근 스윙 저점/고점 기준), 다중 이익실현선(RRR 1:1, 2:1, 3.5:1 – 완전 커스터마이징 가능). 최신 신호 세부사항, 진입가, 손절선, 이익실현선을 표시하는 차트 내 정보 패널. 종합 알림: 팝업, 소리, 푸시 알림, 이메일. 차트 커스터마이징 옵션(색상, 배경, 캔들 스타일). 안전한
Institutional Secret Method
Tshidiso Sydwell Moiloa
The Institutional Secret Method  represents a paradigm shift in market analysis, moving away from lagging indicators and into the realm of Topological Finance . It is engineered to decode the hidden geometry of price movement by calculating the most efficient path—the Geodesic —between current price action and institutional liquidity targets. The system views the market as a physical landscape where price is naturally drawn toward massive pools of liquidity (Stops). It uses two primary calculati
UZFX {SSS} 스캘핑 스마트 시그널 MT5는 빠르게 움직이는 시장에서 정확한 실시간 신호를 요구하는 스캘퍼, 데이 트레이더, 스윙 트레이더를 위해 설계된 리페인팅 없는 고성능 트레이딩 지표입니다. (UZFX-LABS)에서 개발한 이 지표는 가격 행동 분석, 추세 확인, 스마트 필터링을 결합하여 모든 통화 쌍과 시간대에서 높은 확률의 매수 및 매도 신호를 생성합니다. 주요 기능 스마트 신호 감지 – 강력한 추세 반전 및 지속 패턴을 정밀하게 식별합니다. 다중 시간대 스캘핑 – 모든 시간대에서 완벽하게 작동합니다. 사용자 지정 알림 – 모든 신호에 대해 팝업, 이메일 및 모바일 알림을 받습니다(구성 가능). 명확한 시각적 화살표 – 차트에서 쉽게 식별할 수 있는 파란색(매수) 및 빨간색(매도) 화살표. 신호 강도 조정 – 단기, 중기, 장기 거래에 맞춰 신호 강도 조절 가능. 사용자 친화적 인터페이스 – 재그리기나 지연 없는 깔끔한 차트 표시. 작동 원리 UZFX SSS 지표는
TrendMaestro5
Stefano Frisetti
note: this indicator is for METATRADER4, if you want the version for METATRADER5 this is the link:  https://www.mql5.com/it/market/product/108106 TRENDMAESTRO ver 2.5 TRENDMAESTRO recognizes a new TREND from the start, he never makes mistakes. The certainty of identifying a new TREND is priceless. DESCRIPTION TRENDMAESTRO identifies a new TREND in the bud, this indicator examines the volatility, volumes and momentum to identify the moment in which there is an explosion of one or more of these da
LTL Long Trend Locator
Muhammad Usman Siddique
LTL 장기 추세 탐지기 v2.0 - 전문 추세 거래 지표 LTL 장기 추세 탐지기는 강력하고 지속적인 추세를 식별하여 트레이더가 시장에 진입하고 퇴출할 최적의 시점을 찾는 데 도움을 줍니다. 추세가 시작되고 끝나는 시점에 명확한 신호를 제공하여 올바른 방향으로 적시에 거래할 수 있도록 지원합니다. 강력한 시장 추세를 발견하고 명확한 진입점, 손절매 수준, 목표수익 수준을 통해 거래를 배치할 정확한 위치를 보여줍니다. 주요 기능: 명확한 매수/매도 신호: 시장이 상승 또는 하락할 준비가 되었을 때 화살표 표시 거래 라인 표시: 차트에 모든 수준이 명확히 표시된 완전한 거래 설정을 그립니다 추세 구역: 차트를 강세(녹색) 또는 약세(분홍색) 기간으로 색상 구분 통계 표시: 각 추세가 지속된 바 수와 포인트 수 표시 정보 패널: 현재 추세 상태 및 마지막 신호 시간 표시 알림 시스템: 새로운 신호 발생 시 팝업, 이메일 또는 소리 알림 수신 신호당 한 번만 알림(성가신 반복
Rtc ML Ai Predictor
Muhammad Faisal Sagala
Rtc ML Ai | Predictor CORE MACHINE LEARNING ENGINE Adaptive ML Market Predictor – Multi-Bar Trend & Candle Forecast What This Indicator Does This indicator is a  real-time market prediction engine  designed to analyze price behavior and estimate  future market tendencies . Unlike conventional indicators, this system  does not rely on static parameters or historical curve-fitting , but adapts its internal state dynamically during live market operation. Instead of using static rules, the indic
Jita Indicator Pro
Jimmy Mwaba
1 (1)
Jita Indicator Pro MT5 | All Timeframes Professional Trend Agreement System – Premium Edition ($500) What Is Jita Indicator Pro? Jita Indicator Pro is a structured trend-confirmation system designed for serious traders who value precision, alignment, and controlled signal behavior. It combines: Advanced band-based trend direction logic ATR-driven structural trigger engine Dual-confirmation agreement system Locked history update design This indicator prints signals only when multiple conditions
Recommended TimeFrame >= H1. 100% Non Repainted at any moment.  Use it carefully, only with Trend Direction. Trading Usage: 2 Variants: as Range System or as BreakOut System (Both Only With Trend Direction)::: (Always use StopLoss for minimise Risk); [1] as Range System: (Recommended) in UP TREND:  - BUY in Blue Line , then if price goes down by 50 points (on H1) open Second BUY.   Close in any Profit you wish: TrailingStop(45 points) or Close when Price touches upper Gold Line. in DOWN TREND
Max Ribbon Mt5
Stefano Frisetti
WARNING: This indicator is distributed EXCLUSIVELY on MQL5.com MT4 version:   https://www.mql5.com/it/market/product/160363 MT5 version:   https://www.mql5.com/it/market/product/160410 ============================================================================================= MAX RIBBON ver 1.00 The indicator that shows you the TREND clearly and unambiguously! ============================================================================================= DESCRIPTION MAX RIBBON is an advanced tre
Silver Trade
Metin Erkamoglu
MATADOR SILVER – XAGUSD MT5 M5 Timeframe Scalp Signals MATADOR SILVER is a professional signal and decision-support indicator developed specifically for XAGUSD (Silver) scalping on the M5 timeframe , designed for real market conditions and disciplined execution. This indicator does NOT open, manage, or close trades automatically . It provides structured BUY & SELL signals , intelligent filtering, and alerts, allowing traders to execute trades using their own strategy and risk management rules .
+++++++++++++++++++++++++++++++++++++++++++++++++++++++++++++++++++++++++++++++++++++++++++++++++ +++ Link to EURUSD Only Free Version -->  https://www.mql5.com/en/market/product/156904?source=Unknown +++++++++++++++++++++++++++++++++++++++++++++++++++++++++++++++++++++++++++++++++++++++++++++++++ Hallo Trader, This is a traditional GANN & FIBONACCI strategy based on detection of an impulsive move in the opposite direction. This is called a Breakout. At the moment of Breakout, the indicator draw
Big Player Range
Thalles Nascimento De Carvalho
5 (3)
BigPlayerRange – MT5 최고의 지표 BigPlayerRange 는 MetaTrader 5에서 미니 인덱스와 미니 달러를 위한 최고의 지표 로 평가받고 있습니다. 이 도구는 주요 기관 투자자들의 전략적 영역을 강조하여 높은 정확도의 기관 기술 분석을 제공합니다. BigPlayerRange 사용법: 이 지표는 매수 구간(녹색선)과 매도 구간(빨간선)을 표시합니다. 가격이 이 구간 밖에서 마감되면 추세 움직임이 예상됩니다. 녹색선 위에서 마감: 강한 매수세와 상승 추세 가능성. 빨간선 아래에서 마감: 매도 압력과 하락 가능성. 범위 내에서 마감: 횡보 시장, 돌파 신호 대기. 주요 혜택: 기관 투자자 영역 매핑: 주요 투자자들의 활동 구간을 식별합니다. 자동 목표 지점 산출: 거래 종료에 적합한 목표 지점을 제공합니다. 풀백 분석: 리스크 관리를 위한 가격 반등 가능성 평가. 활용 방법: BigPlayerRange와 함께 Imba
IVISTscalp5
Vadym Zhukovskyi
5 (6)
당신에게 소개하는 iVISTscalp5 지표는 독특하면서도 거래 작업에서 효과적입니다. 이 지표는 시간 데이터를 기반으로 하며 금융 시장의 많은 경험과 깊은 분석의 결과입니다. iVISTscalp5 지표는 수동 거래에 뛰어난 도구입니다. 편리성, 간단함 및 시각화 - 모든 복잡성은 숨겨져 있습니다. 우리는 iVISTscalp5 지표의 설정과 사용을 최대한 단순화했습니다. 이 지표는 MT5 터미널에서 가지고 있는 모든 금융 상품에 적합합니다. 시간 기준으로 작동하는 시간은 4am에서 8pm (UTC+3)입니다. iVISTscalp5 지표 메뉴 (스크린샷 1 참조): History - 표시할 주간 수 계산 dT_min - 시간 설정 간격 선택 (분) TFline - 수평 볼륨 생성 (타임프레임) BARSline - 수평 볼륨 생성 (바 수) TFtrend1 - 매일 채널 생성 (타임프레임) BARStrend1 - 매일 채널 생성 (바 수) TFtrend2 - 주간 채널 생성 (타임프레임
Frontier Pivots
Nestor Jose Mendez Boza
FRONTIER PIVOTS - Geometric Levels Indicator This indicator plots support and resistance levels/ranges on the chart using mathematical calculations. It helps traders identify potential price reaction zones based on geometric patterns. Main Features: Automatically calculates and displays key price levels Plots both support and resistance lines Uses daily price data for level calculation Clean visual presentation with different colors for different level types No repainting - levels remain static
Pantera Indicator
Temirlan Kdyrkhan
5 (1)
A tool for on-chart strategy backtesting and performance analysis. A utility for developing, debugging, and testing custom trading ideas and indicator functions. An indicator designed to quickly test trading concepts and visualize the effectiveness of different input parameters. An all-in-one sandbox for testing everything from simple crossovers to complex, multi-condition trading systems.
VTrende Pro
Andrii Diachenko
5 (1)
VTrende Pro - MTF indicator for trend trading with a display panel for MT5 *** Videos can be translated into any language using subtitles (video language - Russian) Although the signals of the VTrende Pro indicator can be used as signals of a full-fledged trading system, it is recommended to use them in conjunction with the Bill Williams TS. VTrende Pro is an extended version of the VTrende indicator. Difference between Pro version and VTrende: - Time zones - Signal V - signal 1-2 waves -    S
FXLAND Smart Reversal Indicator (MT5) FXLAND Smart Reversal Indicator is a professional technical analysis tool designed to help traders identify potential price reversal zones and key market turning points with clarity and precision. The best reversal indicator and price return by choosing only one ceiling or floor in each time frame A masterpiece of combining mathematics and Gann, fractal matrix, Fibonacci, movement angle and time. Completely intelligent Key Features Detects potenti
WanaScalper
Isaac Wanasolo
1 (1)
A scalping indicator based on mathematical patterns, which on average gives signals with relatively small SL, and also occasionally helps to catch big moves in the markets (more information in the video) This indicator has three main types of notifications: The first type warns of a possible/upcoming signal on the next bar The second type indicates the presence of a ready signal to enter the market/open a position The third type is for SL and TP levels - you will be notified every time price re
MATADOR GOLD – XAUUSD MT5 M5 Timeframe Scalp Signals MATADOR GOLD is a professional signal indicator designed for XAUUSD (Gold) scalping on the M5 timeframe , with optional higher-timeframe confirmation. This indicator does not open or manage trades automatically . It provides structured buy and sell signals, intelligent filtering, and alerts, allowing traders to execute trades using their own strategy and risk management rules. Core Concept (Multi-Concept Architecture) MATADOR GOLD is built
Pan PrizMA CD Phase
Aleksey Panfilov
The Expert Advisor and the video are attached in the Discussion tab . The robot applies only one order and strictly follows the signals to evaluate the indicator efficiency. Pan PrizMA CD Phase is an option based on the Pan PrizMA indicator. Details (in Russian). Averaging by a quadric-quartic polynomial increases the smoothness of lines, adds momentum and rhythm. Extrapolation by the sinusoid function near a constant allows adjusting the delay or lead of signals. The value of the phase - wave s
Классификатор силы тренда. Показания на истории не меняет. Изменяется классификация только незакрытого бара. По идее подобен полной системе ASCTrend, сигнальный модуль которой, точнее его аппроксимация в несколько "урезанном" виде, есть в свободном доступе, а также в терминале как сигнальный индикатор SilverTrend . Точной копией системы ASCTrend не является. Работает на всех инструментах и всех временных диапазонах. Индикатор использует несколько некоррелируемых между собой алгоритмов для класси
FFx Universal Strength Meter PRO is more than a basic strength meter. Instead of limiting the calculation to price, it can be based on any of the 19 integrated strength modes + 9 timeframes. With the FFx USM, you are able to define any period for any combination of timeframes. For example, you can set the dashboard for the last 10 candles for M15-H1-H4… Full flexibility! Very easy to interpret... It gives a great idea about which currency is weak and which is strong, so you can find the best pai
The FFx Universal MTF alerter shows on a single chart all the timeframes (M1 to Monthly) with their own status for the chosen indicator. 9 indicators mode (MACD-RSI-Stochastic-MA-ADX-Ichimoku-Candles-CCI-PSAR). Each can be applied multiple times on the same chart with different settings. Very easy to interpret. Confirm your BUY entries when most of the timeframes are showing green color. And confirm your SELL entries when most of the timeframes are showing red color. 2 Alert Options : input to s
FFx Watcher Pro MT5
Eric Venturi-Bloxs
The FFx Watcher PRO is a dashboard displaying on a single chart the current direction of up to 15 standard indicators and up to 21 timeframes. It has 2 different modes: Watcher mode: Multi Indicators User is able to select up to 15 indicators to be displayed User is able to select up to 21 timeframes to be displayed Watcher mode: Multi Pairs User is able to select any number of pairs/symbols User is able to select up to 21 timeframes to be displayed This mode uses one of the standard indicators
제작자의 제품 더 보기
Meravith
Ivan Stefanov
5 (3)
마켓 메이커를 위한 도구. Meravith는 다음과 같은 기능을 제공합니다: 모든 타임프레임을 분석하고 현재 유효한 추세를 표시합니다. 강세와 약세 거래량이 동일한 유동성 구간(거래량 균형 구간)을 강조 표시합니다. 서로 다른 타임프레임의 모든 유동성 레벨을 차트에 직접 표시합니다. 텍스트 기반 시장 분석을 생성하여 참고용으로 제공합니다. 현재 추세를 기반으로 목표가, 지지선 및 손절가를 계산합니다. 거래의 위험 대비 보상 비율(Risk/Reward)을 계산합니다. 계좌 잔고에 따라 포지션 크기를 산출하고 잠재 수익을 추정합니다. 시장에 중대한 변화가 발생할 경우 경고도 제공합니다. 지표의 주요 라인: 강세/약세 거래량 소진 라인 — 목표가로 사용됩니다. 시장 추세를 나타내는 라인. 시장이 강세인지 약세인지에 따라 색상이 변경되며 추세 지지선 역할을 합니다. 색상은 주로 시장 심리를 보여줍니다. 거래량 균형선(Eq). Eq(Volume Equilibrium) 라인은 시스템의 핵심입니
MERAVITH SCANNER는 MetaTrader 5용 전문 금융 시장 지표로, 여러 분석 도구를 하나의 통합 시스템으로 결합합니다. 독점적인 거래량 가중 평균 가격(VWAP) 방법론을 사용하여 모든 계산을 자동으로 수행하며, 주관적인 해석을 완전히 배제합니다. 이 지표는 모든 자산 클래스(Forex, 주식, 지수, 상품, 암호화폐)와 M1부터 월간 차트까지 모든 시간 프레임에서 작동합니다. 기본 원리는 “가격은 거래량을 따른다”입니다. MERAVITH는 기관 거래량이 집중되는 위치를 식별하고, 그 집중에서 수학적으로 정확한 가격 수준을 도출합니다. 예측이나 투기를 하지 않으며, 계산만 수행합니다. MERAVITH SCANNER를 사용하면 28개의 주요 Forex 통화쌍을 모든 시간 프레임에서 단 2~3분 만에 스캔할 수 있습니다. 또한 원하는 시장을 스캔할 수도 있으며, 예를 들어 약 100개의 주식을 약 10분 안에 스캔할 수 있습니다. 지표는 소진 레벨, 균형선, 편차, 통계
RSI Divergence Pulse는 다이버전스 감지, 다중 타임프레임 분석, 시각 도구를 하나의 가벼운 애플리케이션에 통합한 포괄적인 RSI 지표입니다. Regular 및 Hidden 다이버전스를 자동으로 식별하고, 실시간 Multi-Timeframe RSI 패널을 표시하며, OB/OS 영역을 시각적으로 인식하기 쉽게 채우고, 가격 차트와 RSI 하위 창 모두에 다이버전스 선을 그려주며, Buy/Sell 화살표를 배치하고 실시간 알림을 제공합니다. Features Color-Coded RSI Line RSI 선은 현재 영역에 따라 색상이 변경됩니다. 파랑은 중립 영역(30~70)을 나타냅니다. 초록은 과매수 영역(70 이상)을 나타냅니다. 빨강은 과매도 영역(30 이하)을 나타냅니다. RSI Signal Line RSI의 SMA(기본 기간 9)가 신호선으로 작동합니다. RSI와 신호선의 교차는 타이밍 정보를 추가로 제공합니다. 차이값(Diff)은 대시보드에 표시됩니다. Auto
MACD divergency
Ivan Stefanov
4.6 (5)
이 지표는 지수이동평균(EMA) 기간을 5(빠름)와 34(느림), 신호선 기간을 5로 설정하여 가격 움직임과 MACD 히스토그램 간의 강세 및 약세 다이버전스를 정확하게 식별합니다. 지표는 모멘텀이 약화되는 지점을 강조 표시하여 잠재적 추세 반전을 알립니다. 올바른 다이버전스 식별 규칙: 강세 다이버전스는 가격이 더 낮은 저점을 형성하면서 MACD 히스토그램이 동시에 0선 위에서 더 높은 저점을 형성할 때 유효합니다. 약세 다이버전스는 가격이 더 높은 고점을 형성하면서 MACD 히스토그램이 동시에 0선 아래에서 더 낮은 고점을 형성할 때 유효합니다. 히스토그램의 극값과 가격의 극값이 0선의 같은 쪽에 있지 않으면 다이버전스 신호는 무효로 간주되며, 이는 잘못된 신호를 초래할 수 있습니다. 이 접근법은 MACD 다이버전스 분석을 적용하는 가장 정확하고 신뢰할 수 있는 방법을 제시합니다. 지표 특징: 확인된 강세 및 약세 다이버전스를 명확하게 표시합니다. 신뢰성을 높이기 위해 MACD
FREE
Horizont
Ivan Stefanov
Horizont는 진입 지점, 목표 1, 목표 2, 손절가를 포함한 완전한 트레이딩 세트업을 제공하는 트레이딩 시스템입니다. 모든 값은 자동으로 계산됩니다. 시스템은 시장의 고점과 저점을 자동으로 감지하고 이를 연결하여 현재 추세를 정의합니다. 사용자는 거래할 추세를 선택하며, Horizont는 이에 따른 진입, 목표 및 손절 수준을 생성합니다. 시스템에는 자동 리스크 관리 기능이 포함되어 있습니다. 계좌 잔액을 확인하고 리스크를 계산한 뒤, 적절한 포지션 크기를 제안합니다. 리스크 대비 보상 비율(R:R)은 첫 번째 목표에 대해서만 표시됩니다. 모든 계산은 즉시 수행됩니다. 다른 기회를 탐색하고 싶다면 통화 패널을 클릭하여 종목을 전환하고 더 나은 R:R 비율을 찾을 수 있습니다. 이 시스템은 주로 외환(Forex)에 초점을 맞추고 있지만, 금속, 지수, 암호화폐 거래도 지원합니다(현재 베타 단계로, 모든 브로커에서 지원되지 않을 수 있습니다). 시스템은 각 세트업에 대해 등급이
Imbalance Pro
Ivan Stefanov
5 (4)
이 인디케이터는 선택한 기간 동안 상승과 하락 사이의 불균형을 측정하고 두 지점 사이의 직선을 표시합니다. 상승세가 하락세보다 거래량이 많으면 선이 녹색으로 바뀝니다.  하락세가 더 많으면 빨간색으로 표시됩니다. 이 선은 거래량의 백분율 차이도 표시합니다. 표시기는 별도의 창에 동일한 데이터를 표시합니다. 분할된 볼륨도 볼 수 있습니다. 표시기에는 두 가지 모드가 있습니다. 이를 위해 왼쪽 상단에 버튼이 있습니다,  - 누르지 않으면 시장의 임의의 지점과 현재 가격 사이의 불균형을 측정합니다.  - 버튼을 누르면 선택한 시장의 두 지점 사이의 잔액을 측정할 수 있습니다. 이 인디케이터는 선택한 기간 동안 상승과 하락 사이의 불균형을 측정하고 두 지점 사이의 직선을 표시합니다. 상승세가 하락세보다 거래량이 많으면 선이 녹색으로 바뀝니다.  하락세가 더 많으면 빨간색으로 표시됩니다. 이 선은 거래량의 백분율 차이도 표시합니다. 표시기는 별도의 창에 동일한 데이터를 표
이 인디케이터는 MetaTrader 4 및 5용 인터랙티브 엘리엇 파동 라벨링 도구입니다. 차트에 표시된 메뉴에서 라벨 크기, 색상, 파동 유형(ABC 조정파, 5파동 임펄스 또는 WXY 구조)을 선택하여 차트에 직접 파동 라벨을 수동으로 배치할 수 있습니다. 차트를 한 번 클릭하면 선택한 가격과 시간 위치에 맞는 파동 라벨이 순차적으로 배치되어, 트레이더가 엘리엇 파동 구조를 시각적으로 표시하고 정리하는 데 도움을 줍니다. 마음에 드신다면 평가해 주세요! 이 인디케이터는 MetaTrader 4 및 5용 인터랙티브 엘리엇 파동 라벨링 도구입니다. 차트에 표시된 메뉴에서 라벨 크기, 색상, 파동 유형(ABC 조정파, 5파동 임펄스 또는 WXY 구조)을 선택하여 차트에 직접 파동 라벨을 수동으로 배치할 수 있습니다. 차트를 한 번 클릭하면 선택한 가격과 시간 위치에 맞는 파동 라벨이 순차적으로 배치되어, 트레이더가 엘리엇 파동 구조를 시각적으로 표시하고 정리하는 데 도움을 줍니다. 마음
FREE
Meravith AUTO
Ivan Stefanov
5 (1)
Meravith Auto는 Meravith 거래 시스템의 자동화 버전입니다. 이 지표는 색상이 변하는 추세선으로 구성되어 있습니다. 상승 추세일 때는 녹색, 하락 추세일 때는 빨간색입니다. 이것이 추세 지지선입니다. 상승 거래량과 하락 거래량이 같은 유동성 라인. 세 배 상승 편차 라인. 세 배 하락 편차 라인. 높은 거래량을 나타내는 보라색 및 파란색 점. 보라색 점은 평균 거래량보다 2편차 큰 거래량을 나타내며, 파란색 점은 2편차를 나타냅니다. 사용 방법은? 상승 추세선과 추세선 위의 유동성은 상승 추세를 나타냅니다. 시장이 상승할 것으로 예상됩니다. 롱 포지션을 엽니다. 하락 추세선과 추세선 아래의 유동성은 하락 추세를 나타냅니다. 시장이 하락할 것으로 예상됩니다. 숏 포지션을 엽니다. 다른 지표와 자유롭게 조합하여 사용할 수 있습니다. 모든 통화쌍과 모든 시간대에서 사용할 수 있습니다. 브로커마다 표시하는 거래량이 다르기 때문에 결과가 다를 수 있습니다. 거래량이 많은 대형
이 인디케이터는 MetaTrader 4 및 5용 인터랙티브 엘리엇 파동 라벨링 도구입니다. 차트에 표시된 메뉴에서 라벨 크기, 색상, 파동 유형(ABC 조정파, 5파동 임펄스 또는 WXY 구조)을 선택하여 차트에 직접 파동 라벨을 수동으로 배치할 수 있습니다. 차트를 한 번 클릭하면 선택한 가격과 시간 위치에 맞는 파동 라벨이 순차적으로 배치되어, 트레이더가 엘리엇 파동 구조를 시각적으로 표시하고 정리하는 데 도움을 줍니다. 마음에 드신다면 평가해 주세요! 이 인디케이터는 MetaTrader 4 및 5용 인터랙티브 엘리엇 파동 라벨링 도구입니다. 차트에 표시된 메뉴에서 라벨 크기, 색상, 파동 유형(ABC 조정파, 5파동 임펄스 또는 WXY 구조)을 선택하여 차트에 직접 파동 라벨을 수동으로 배치할 수 있습니다. 차트를 한 번 클릭하면 선택한 가격과 시간 위치에 맞는 파동 라벨이 순차적으로 배치되어, 트레이더가 엘리엇 파동 구조를 시각적으로 표시하고 정리하는 데 도움을 줍니다. 마음
FREE
시장 변동성에 따라 계산 기간을 자동으로 조정하여 과매수 및 과매도 신호를 보다 정확하게 제공하는 고급 모멘텀 오실레이터입니다. 작동 방식 이 지표는 적응형 기간 계산을 사용하며, 변동성이 높을 때는 기간을 짧게 하고 변동성이 낮을 때는 기간을 길게 합니다. 이러한 동적 조정은 추세 시장에서는 더 빠른 신호를 제공하고, 횡보 시장에서는 거짓 신호를 줄여줍니다. RSI 값은 이 가변 기간을 기반으로 계산되므로 현재 시장 상황에 더욱 민감하게 반응합니다. 전통적인 30(과매도)과 70(과매수) 수준을 사용하지만, 적응형 특성으로 인해 이러한 수준에 도달할 때의 신뢰도가 더 높아집니다. 주요 특징: 시장 변동성에 따라 계산 기간 자동 조정 매수 / 매도 시점을 표시하는 차트 화살표 컬러 오실레이터: 50 이상은 녹색, 50 이하는 빨간색 추세 시장에서 더 빠른 반응 횡보 시장에서 거짓 신호 감소 리페인트 없음 지표 — 캔들 마감 후 값이 고정됨 모든 타임프레임과 모든 시장에서 작동
FREE
Meravith Auto는 Meravith 거래 시스템의 자동화 버전입니다. 이 지표는 색상이 변하는 추세선으로 구성되어 있습니다. 상승 추세일 때는 녹색, 하락 추세일 때는 빨간색입니다. 이것이 추세 지지선입니다. 상승 거래량과 하락 거래량이 같은 유동성 라인. 세 배 상승 편차 라인. 세 배 하락 편차 라인. 높은 거래량을 나타내는 보라색 및 파란색 점. 보라색 점은 평균 거래량보다 2편차 큰 거래량을 나타내며, 파란색 점은 2편차를 나타냅니다. 사용 방법은? 상승 추세선과 추세선 위의 유동성은 상승 추세를 나타냅니다. 시장이 상승할 것으로 예상됩니다. 롱 포지션을 엽니다. 하락 추세선과 추세선 아래의 유동성은 하락 추세를 나타냅니다. 시장이 하락할 것으로 예상됩니다. 숏 포지션을 엽니다. 다른 지표와 자유롭게 조합하여 사용할 수 있습니다. 모든 통화쌍과 모든 시간대에서 사용할 수 있습니다. 브로커마다 표시하는 거래량이 다르기 때문에 결과가 다를 수 있습니다. 거래량이 많은 대
Meravith MT5
Ivan Stefanov
마켓 메이커를 위한 도구. Meravith는 다음과 같은 기능을 제공합니다: 모든 타임프레임을 분석하고 현재 유효한 추세를 표시합니다. 강세와 약세 거래량이 동일한 유동성 구간(거래량 균형 구간)을 강조 표시합니다. 서로 다른 타임프레임의 모든 유동성 레벨을 차트에 직접 표시합니다. 텍스트 기반 시장 분석을 생성하여 참고용으로 제공합니다. 현재 추세를 기반으로 목표가, 지지선 및 손절가를 계산합니다. 거래의 위험 대비 보상 비율(Risk/Reward)을 계산합니다. 계좌 잔고에 따라 포지션 크기를 산출하고 잠재 수익을 추정합니다. 시장에 중대한 변화가 발생할 경우 경고도 제공합니다. 지표의 주요 라인: 강세/약세 거래량 소진 라인 — 목표가로 사용됩니다. 시장 추세를 나타내는 라인. 시장이 강세인지 약세인지에 따라 색상이 변경되며 추세 지지선 역할을 합니다. 색상은 주로 시장 심리를 보여줍니다. 거래량 균형선(Eq). Eq(Volume Equilibrium) 라인은 시스템의 핵심입니
Fifty Pro MT5
Ivan Stefanov
가격만을 기준으로 레벨을 계산하는 몇 안 되는 인디케이터 중 하나입니다. 이 인디케이터는 시간 프레임, 추세 또는 시장 사이클의 영향을 받지 않습니다. 지금까지 만들어진 것 중 가장 논리적인 인디케이터 중 하나입니다. FIFTY 인디케이터는 이제 자동화 버전으로 제공되어 수동으로 레벨을 그릴 필요가 없습니다. 이 버전은 일간, 주간, 월간, 연간 레벨을 자동으로 차트에 표시하여 정확성을 높이고 시간을 절약해 줍니다. 또한, 이러한 레벨의 표시 여부를 전환할 수 있는 버튼이 제공되어 완전한 사용자 맞춤 설정이 가능합니다. 수동 방식을 선호하는 분들을 위해 무료 버전도 여전히 제공되며, 완전히 작동합니다. 사용자들은 자신의 트레이딩 스타일에 따라 수동 또는 자동 도구를 선택할 수 있습니다. 매우 신뢰할 수 있으며 강력히 추천드립니다! 수동 버전의 FIFTY 인디케이터를 지금 요청해 보세요!
Naturu
Ivan Stefanov
5 (1)
“Naturu”는 자연의 대칭성을 알고리즘으로 활용하는 수동 인디케이터입니다. 간단한 전략과 숨겨진 지혜로 시장을 제패하세요! 인디케이터를 로드하면 위(Top)와 아래(Bottom) 두 개의 라인이 표시됩니다. 라인을 한 번 클릭해 활성화한 후, 이동하고 싶은 캔들 위를 클릭하면 그 위치로 이동합니다. 사용자가 고점과 저점을 지정하면, 인디케이터가 자동으로 계산합니다: 마젠타 색 영역: 상승(불) 세력과 하락(곰) 세력의 관심이 가장 가까워져서 지지/저항이 될 가능성이 큰 구간 회색 영역: 다음 관심 구간 아쿠아 색 실선: 상승 세력의 목표가 골드 색 실선: 하락 세력의 목표가 수동 인디케이터는 실시간 시장 상황과 개인의 직관에 따라 레벨을 자유롭게 조정할 수 있는 완전한 제어력과 유연성을 제공합니다. 직접 가격 움직임을 분석함으로써 지지·저항과 패턴 형성을 본질적으로 이해할 수 있습니다. 인간의 판단을 통해 자동 시스템이 놓치거나 오해하기 쉬운 ‘노이즈’를 걸러내어 잘못된 신호를
Sense
Ivan Stefanov
5 (2)
SENSE는 선택된 GANN 방식과 프랙탈 계산을 결합한 자동화된 시스템입니다. 이 시스템은 거래를 개시하고 청산할 위치를 알려줍니다. 더 이상 복잡한 계산에 시간을 낭비할 필요가 없습니다. SENSE가 모든 것을 알아서 해줍니다. 인디케이터를 설치하기만 하면 됩니다. 기본 원칙: 가격이 흰색 선 위에 있으면 시장은 강세입니다. 흰색 선 위에서 매수, 아래에서 손절 녹색 선은 상승 목표 가격이 흰색 선 아래에 있으면 시장은 약세입니다. 흰색 선 아래에서 매도, 그 위에 스톱 빨간색 선은 하락 목표 녹색 또는 빨간색 이중선은 강세 구간을 나타냅니다. 왜 센스인가? 수익 목표: SENSE는 자동으로 이익 실현 목표를 설정하여 트레이딩 성공을 극대화할 수 있도록 도와줍니다. 자동 적응: 인디케이터는 모든 차트주기에 대해 자동으로 다시 계산하여 수동으로 조정할 필요 없이 정확하고 신뢰할 수 있는 신호를 제공합니다. 스캘핑에도 좋습니다. 데모를 확인해 보세요!
Two Snakes
Ivan Stefanov
5 (1)
2 SNAKES  is a first class scalping system. As the entries are quite precise, you are likely to become addicted to this system very quickly.  You have 2 snakes. When you see a candle above or below them that does not touch them - that is your scalping signal. Then buy or sell at the green line or close. If you use a larger time frame, scalping can become trend following. The snakes are calculated precisely in relation to the current state of the market. They ARE NOT moving averages.  You decide
Separated Volume
Ivan Stefanov
5 (1)
이 지표는 외환 시장의 틱 거래량을 강세와 약세 카테고리로 효과적으로 구분합니다. 또한 선택한 기간 동안 강세 및 약세 틱 거래량의 합계를 계산하여 표시하는 기능도 제공합니다. 차트에서 파란색 선 두 개를 움직여 기간을 쉽게 조정할 수 있으므로 거래 요구에 맞는 맞춤형 거래량 분석을 할 수 있습니다. 유용하게 사용하셨다면 리뷰를 남겨주시면 감사하겠습니다! 행복한 거래 되세요! 이 지표는 외환 시장의 틱 거래량을 강세와 약세 카테고리로 효과적으로 구분합니다. 또한 선택한 기간 동안 강세 및 약세 틱 거래량의 합계를 계산하여 표시하는 기능도 제공합니다. 차트에서 파란색 선 두 개를 움직여 기간을 쉽게 조정할 수 있으므로 거래 요구에 맞는 맞춤형 거래량 분석을 할 수 있습니다. 유용하게 사용하셨다면 리뷰를 남겨주시면 감사하겠습니다! 행복한 거래 되세요!
FREE
Most visited level PRO
Ivan Stefanov
5 (2)
이 지표는 실제 경험을 바탕으로 합니다.  최고/최저의 날짜/시간을 입력합니다. 고점/저점부터 현재 시점까지 가장 많이 방문한 레벨을 계산합니다. 새로운 캔들이 생길 때마다 자동으로 업데이트됩니다. 다양한 추세와 기간에 대해 여러 지표를 동시에 사용할 수 있습니다. 기간은 항상 생리 시작부터 현재까지의 기간으로 표시됩니다. 유용한 프로 도구. 이 지표는 실제 경험을 바탕으로 합니다.  최고/최저의 날짜/시간을 입력합니다. 고점/저점부터 현재 시점까지 가장 많이 방문한 레벨을 계산합니다. 새로운 캔들이 생길 때마다 자동으로 업데이트됩니다. 다양한 추세와 기간에 대해 여러 지표를 동시에 사용할 수 있습니다. 기간은 항상 생리 시작부터 현재까지의 기간으로 표시됩니다. 유용한 프로 도구. 이 지표는 실제 경험을 바탕으로 합니다.  최고/최저의 날짜/시간을 입력합니다. 고점/저점부터 현재 시점까지 가장 많이 방문한 레벨을 계산합니다. 새로운 캔들이 생길 때마다
FREE
Enigmera
Ivan Stefanov
5 (8)
ENIGMERA: 시장의 핵심 중요: MQL5.com의 데모는 Strategy Tester에서 실행되며 Enigmera의 기능을 완전히 반영하지 못할 수 있습니다. 설명, 스크린샷 및 비디오를 확인하여 자세한 내용을 확인하십시오. 질문이 있으면 언제든지 메시지를 보내주세요! 인디케이터의 코드는 완전히 다시 작성되었습니다. 버전 3.0은 새로운 기능을 추가하고 인디케이터가 처음 출시된 이후 누적된 버그를 수정했습니다. 소개 이 인디케이터 및 거래 시스템은 금융 시장에 대한 주목할 만한 접근 방식입니다. ENIGMERA는 프랙탈 주기를 사용하여 정확하게 지원 및 저항 수준을 계산합니다. 실제 축적 단계를 보여주고 방향과 목표를 제공합니다. 트렌드와 수정 모두에서 작동하는 시스템입니다. 작동 방식 인디케이터의 대부분의 기능은 차트 왼쪽에 있는 버튼을 통해 제어되며, 이를 통해 다양한 시장 상황에 빠르게 대응할 수 있습니다. 버튼 ON/OFF – 인디케이터 전체를 표시하거나 숨깁니다.
Levelss
Ivan Stefanov
5 (1)
레벨스 지표가 표시됩니다: - 일일 강세 및 약세 영역. 매일 00:00~23:59에 표시됩니다.  - 주간 강세 및 약세 영역. 매주 월요일 0:00부터 금요일 23:59까지 표시됩니다. - 특정 시간대에서 특별히 계산된 채널로 다른 모든 시간대에 표시됩니다. 기본적으로 4시간 주기로 표시되며 거래하고자 하는 다른 주기로 변경할 수 있습니다. 논스톱으로 계산됩니다. 화면 왼쪽 상단에는 강세, 약세 또는 중립 영역과 채널이 표시됩니다. 세 가지가 모두 강세인 경우 현재 캔들에 녹색 점이 나타납니다. 세 개가 모두 약세인 경우 분홍색 점이 나타납니다. 인디케이터에는 제한이 없습니다. 레벨스 지표가 표시됩니다: - 일일 강세 및 약세 영역. 매일 00:00~23:59에 표시됩니다.  - 주간 강세 및 약세 영역. 매주 월요일 0:00부터 금요일 23:59까지 표시됩니다. - 특정 시간대에서 특별히 계산된 채널로 다른 모든 시간대에 표시됩니다. 기본적으로 4시간 주기로 표시되며
GANN Master
Ivan Stefanov
5 (1)
GANN의 정확한 목표는 그의 오랜 방법론에 따라 계산되어 눈앞에 제시됩니다. 이 도구는 거래를 더욱 쉽고 직관적으로 만들어줍니다. 흰 선을 위로 또는 녹색 선을 아래로 움직이면 GANN의 기법이 여전히 거래 세계에서 영향력 있는 이유를 즉시 알 수 있습니다. GANN의 전략은 시장 움직임을 높은 정확도로 예측하는 데 중점을 두며, 이 도구는 그 힘을 여러분의 손끝에 전달합니다. 숙련된 트레이더든 초보자든, 선을 조작하면 그의 접근 방식이 왜 오랜 세월 동안 신뢰받았는지 깊이 이해할 수 있게 될 것입니다. GANN의 정확한 목표는 그의 오랜 방법론에 따라 계산되어 눈앞에 제시됩니다. 이 도구는 거래를 더욱 쉽고 직관적으로 만들어줍니다. 흰 선을 위로 또는 녹색 선을 아래로 움직이면 GANN의 기법이 여전히 거래 세계에서 영향력 있는 이유를 즉시 알 수 있습니다. GANN의 전략은 시장 움직임을 높은 정확도로 예측하는 데 중점을 두며, 이 도구는 그 힘을 여러분의 손끝에 전달합니다.
Stefanov
Ivan Stefanov
The indicator displays support and resistance zones defined logically using the MACD. The entire concept is explained in the video, with specific examples shown. The indicator works on any instruments and timeframes. It does not repaint. After placing it on the chart, please go through all the timeframes sequentially, from monthly to 1-minute, so that all lines load correctly. After that, you can start using it. The concept is unique and has not been seen in other systems or indicators.
Fifty Pro
Ivan Stefanov
5 (1)
FIFTY 인디케이터는 이제 자동화된 버전으로 제공되어 수동으로 레벨을 그릴 필요가 없습니다. 이 버전은 일간, 주간, 월간 및 연간 레벨을 자동으로 차트에 표시하여 정확성을 보장하고 시간을 절약합니다. 또한, 이러한 레벨의 표시 여부를 전환할 수 있는 버튼이 제공되어 완전한 사용자 맞춤 설정이 가능합니다. 수동 조작을 선호하는 사용자들을 위해 무료 버전도 계속 제공되며, 완전한 기능을 갖추고 있습니다. 트레이더는 자신의 거래 스타일에 맞춰 수동 또는 자동 도구를 선택할 수 있습니다. 가장 논리적인 인디케이터 중 하나. 높은 신뢰성. FIFTY 인디케이터는 이제 자동화된 버전으로 제공되어 수동으로 레벨을 그릴 필요가 없습니다. 이 버전은 일간, 주간, 월간 및 연간 레벨을 자동으로 차트에 표시하여 정확성을 보장하고 시간을 절약합니다. 또한, 이러한 레벨의 표시 여부를 전환할 수 있는 버튼이 제공되어 완전한 사용자 맞춤 설정이 가능합니다. 수동 조작을 선호하는 사용자들을 위해 무료 버
Naturu MT4
Ivan Stefanov
“Naturu”는 자연의 대칭성을 알고리즘으로 활용하는 수동 인디케이터입니다. 간단한 전략과 숨겨진 지혜로 시장을 제패하세요! 인디케이터를 로드하면 위(Top)와 아래(Bottom) 두 개의 라인이 표시됩니다. 라인을 한 번 클릭해 활성화한 후, 이동하고 싶은 캔들 위를 클릭하면 그 위치로 이동합니다. 사용자가 고점과 저점을 지정하면, 인디케이터가 자동으로 계산합니다: 마젠타 색 영역: 상승(불) 세력과 하락(곰) 세력의 관심이 가장 가까워져서 지지/저항이 될 가능성이 큰 구간 회색 영역: 다음 관심 구간 아쿠아 색 실선: 상승 세력의 목표가 골드 색 실선: 하락 세력의 목표가 수동 인디케이터는 실시간 시장 상황과 개인의 직관에 따라 레벨을 자유롭게 조정할 수 있는 완전한 제어력과 유연성을 제공합니다. 직접 가격 움직임을 분석함으로써 지지·저항과 패턴 형성을 본질적으로 이해할 수 있습니다. 인간의 판단을 통해 자동 시스템이 놓치거나 오해하기 쉬운 ‘노이즈’를 걸러내어 잘못된 신호를
Balance Levels
Ivan Stefanov
Balance Levels는 명확한 매수 및 매도 신호와 동적인 가격 레벨을 제공하는 사용하기 쉬운 트레이딩 인디케이터로, 트레이더가 보다 자신 있게 진입과 청산을 계획할 수 있도록 도와줍니다. 이 도구는 매우 유연하여 독립적인 전략 으로 사용할 수도 있고 기존의 트레이딩 시스템에 통합할 수도 있습니다. 모든 시간 프레임과 모든 시장 에서 작동합니다: 외환, 금, 지수, 암호화폐, 주식 등. Balance Levels는 스캘핑 , 단타 매매 , 스윙 트레이딩 , 장기 투자까지 모든 트레이딩 스타일에 적합합니다. 시각적 신호와 밸런스 존을 통해 차트를 더욱 명확하게 하고 불필요한 “노이즈”를 제거합니다. 구매 후에는 이 도구를 최대한 활용하고 자신의 트레이딩 스타일에 성공적으로 통합할 수 있도록 가이드와 추가 자료 를 받을 수 있습니다. 초보자든 경험 많은 트레이더든, Balance Levels는 시장에서의 의사결정을 개선할 수 있는 실용적이고 저렴한 솔루션입니다. 구매 전에 무료 데
MACD Divergence Pulse — 4색 히스토그램, 알림 및 대시보드와 함께하는 스마트 다이버전스 스캐너 짧은 설명 자동 일반 및 숨겨진 다이버전스 감지, 4색 동적 히스토그램, 매수/매도 화살표, 신호 라벨, 실시간 대시보드, 다채널 알림을 갖춘 전문 MACD 지표. 모든 심볼 및 시간대에서 작동. 전체 설명 MACD Divergence Pulse는 클래식 MACD 오실레이터를 다음 레벨로 끌어올립니다. 일반 및 숨겨진 다이버전스를 자동으로 감지하고 표시하며, 가격 차트와 MACD 하위 창에 선을 그리며, 화살표를 배치하고, 신호 라벨을 표시하며, 라이브 대시보드를 제공합니다 — 모두 하나의 가벼운 지표에서. 트레이더가 MACD Divergence Pulse
RSI Divergence Pulse — Smart Divergence Scanner with MTF Panel, Zone Fill, Alerts & Dashboard SHORT DESCRIPTION Professional RSI indicator with automatic Regular & Hidden divergence detection, color-coded RSI line, Multi-Timeframe panel, OB/OS zone fills, Buy/Sell arrows, signal labels, real-time dashboard, and multi-channel alerts. Works on any symbol and timeframe. FULL DESCRIPTION
Enigmera MT5
Ivan Stefanov
3.67 (3)
ENIGMERA: 시장의 핵심 (이 지표는 수동형 인디케이터이며, 현재 MetaTrader 테스트 환경에서 일부 기능이 지원되지 않을 수 있습니다) 소개 이 인디케이터와 트레이딩 시스템은 금융시장을 다루는 독창적인 접근 방식을 제시합니다. ENIGMERA는 프랙탈 사이클을 이용하여 지지선과 저항선을 정밀하게 계산합니다. 실제 매집 구간을 표시하며, 시장의 방향성과 목표를 제시합니다. 추세장이든 조정장이든 관계없이 작동하는 시스템입니다. 작동 방식 대부분의 기능은 차트 왼쪽에 있는 버튼을 통해 제어되며, 다양한 시장 상황에 빠르게 대응할 수 있습니다. 버튼 설명 ON/OFF – 전체 인디케이터를 표시하거나 숨깁니다. Support – 주요 추세 지지선입니다. Ch – 지지 채널을 활성화하여 허용 가능한 편차 범위를 표시합니다. Dev1 (1차 편차) – 지지선 내 가격 움직임을 표시하며, 시장의 조정 또는 에너지 축적을 시사합니다. Dev2 (2차 편차) – 편차 사이의 가격 움직임을
전설적인 윌리엄 갠(William Gann) 수준을 완전 자동화하여 표시하는 MT5 인디케이터. GANN Master는 일간, 주간, 월간 데이터를 바탕으로 가격이 전환하거나 추세를 이어갈 가능성이 높은 핵심 구역을 정확히 포착합니다. 주요 기능 원클릭 기간 선택 버튼 : Daily, Weekly, Monthly 버튼 클릭 한 번으로 해당 일, 주, 월의 구역을 즉시 표시 자동 및 수동 모드 자동 모드: GANN Master가 모든 레벨을 자동으로 계산, 수동 입력 불필요 수동 모드: 차트에서 Top 및 Bottom 라인을 드래그하여 스윙 포인트를 설정하면, 모든 Gann 레벨이 즉시 재계산 매수 및 매도 레벨 : 강세(매수)·약세(매도) 레벨을 모두 표시, 레벨이 모일수록 강력한 지지/저항 구역 표시 다양한 자산 지원 : Forex, 귀금속(Gold 등), 지수, 암호화폐 등 고가 자산 모두 지원 — 설정에서 자산 클래스를 변경하면 자동으로 스케일 및 승수 조정 직관적 인터페이스
Speculator MT5
Ivan Stefanov
SPEKULATOR는 주요 지원 영역과 시장 방향을 식별하는 데 도움이 되는 수동 거래 시스템 및 지표입니다. 간단한 전략과 숨겨진 지혜로 시장을 마스터하세요. 차트에서 원하는 최고점(TOP)과 최저점(BOTTOM)을 선택하면 지표는 다음을 그립니다: 당신의 트렌드를 위한 지원 영역. 상승 추세에서는 녹색 영역이, 하락 추세에서는 빨간색 영역이 나타납니다. 지원 영역의 민감도는 지표 설정에서 조정할 수 있습니다. 이 영역은 선택한 추세를 기반으로 지원이 나타날 가능성이 있는 위치를 나타냅니다. 높은 편차선과 낮은 편차선 W.D. Gann의 9의 제곱에 따라 계산된 각도선 거래에 진입할 때: 높은 편차선이 위로 돌파되면 롱 포지션을 취합니다. 낮은 편차선이 아래로 돌파되면 숏 포지션을 취합니다. 시장이 편차선 사이에 있을 경우, 해당 구간 내에서 매수와 매도를 하며 지원 영역을 존중합니다. Gann의 각도선은 이익 실현 구간으로 가이드를 제공합니다. 핵심 수준은 360도 선입니다: 가
필터:
zeke21t2
306
zeke21t2 2026.02.15 13:00 
 

This is an amazing indicator that gives you a quick glimpse into the big picture, the most important aspect of trading: whether you should wait for a buying opportunity, a selling opportunity, or wait for the market to settle down. Simply avoiding false breakouts will dramatically improve your trading performance. For specific buying and selling opportunities, I highly recommend using it in conjunction with Meravith, another of the author's outstanding works. Pullback reversals and reversals from the top or bottom, which are entered based on chart highs and lows or volume changes, will become more effective. Honestly, I recommend this so much that I don't want anyone else to know about it :)

Max2233
554
Max2233 2025.07.08 10:33 
 

I would like to compliment this work of art composed by IVAN, a very precise indicator and in combination with his other jewels created by him, trading has simply become simpler and more intuitive. A round of applause to IVAN.

Mase
1739
Mase 2025.05.29 14:17 
 

Simply perfect! In combination with Ivan's other technical indicators, it is a powerful tool. Warning: highly addictive, as the indicators bring so much joy and success. Highly recommended.

리뷰 답변