Transaction Speed MT5

5

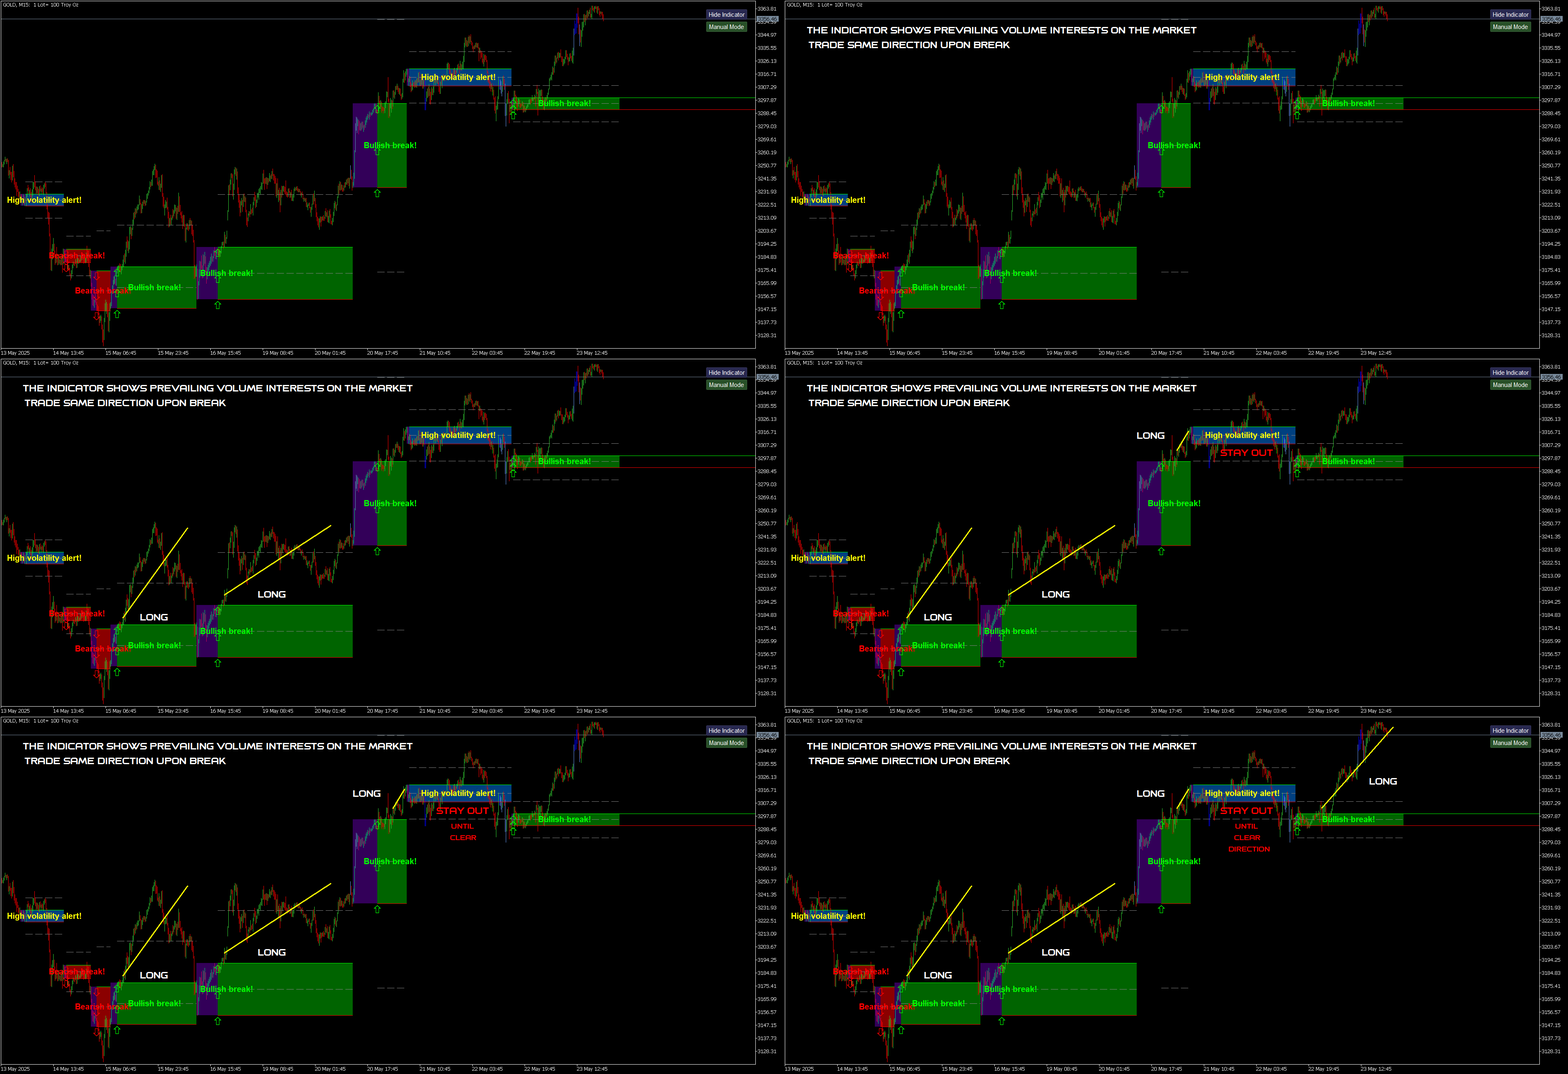
L’indicateur met en évidence les zones où un intérêt est déclaré sur le marché, puis montre la zone d’accumulation des ordres.
Il fonctionne comme un carnet d’ordres à grande échelle.
C’est l’indicateur destiné aux grands capitaux. Ses performances sont exceptionnelles.
Quel que soit l’intérêt présent sur le marché, vous le verrez clairement.

(Il s’agit d’une version entièrement réécrite et automatisée – l’analyse manuelle n’est plus nécessaire.)
La vitesse de transaction est un indicateur basé sur un concept nouveau : elle montre où et quand les gros ordres s’accumulent sur le marché et quels avantages cela offre.
Elle détecte les changements de tendance très tôt.
En Forex, le volume est souvent mal compris : il ne s’agit pas du volume réel, mais du changement de prix par unité de temps. Le terme correct est donc vitesse de transaction.
Tout dépend de notre manière de penser, d’agir et d’analyser.
Changer de paradigme est fondamental.
Cet indicateur redéfinit complètement le concept de volume en Forex, en l’appliquant de manière logique. Il devient ainsi un outil unique et précis.

Comment l’utiliser :

Par défaut, l’indicateur fonctionne en mode automatique, ce qui permet son utilisation sur n’importe quelle unité de temps.
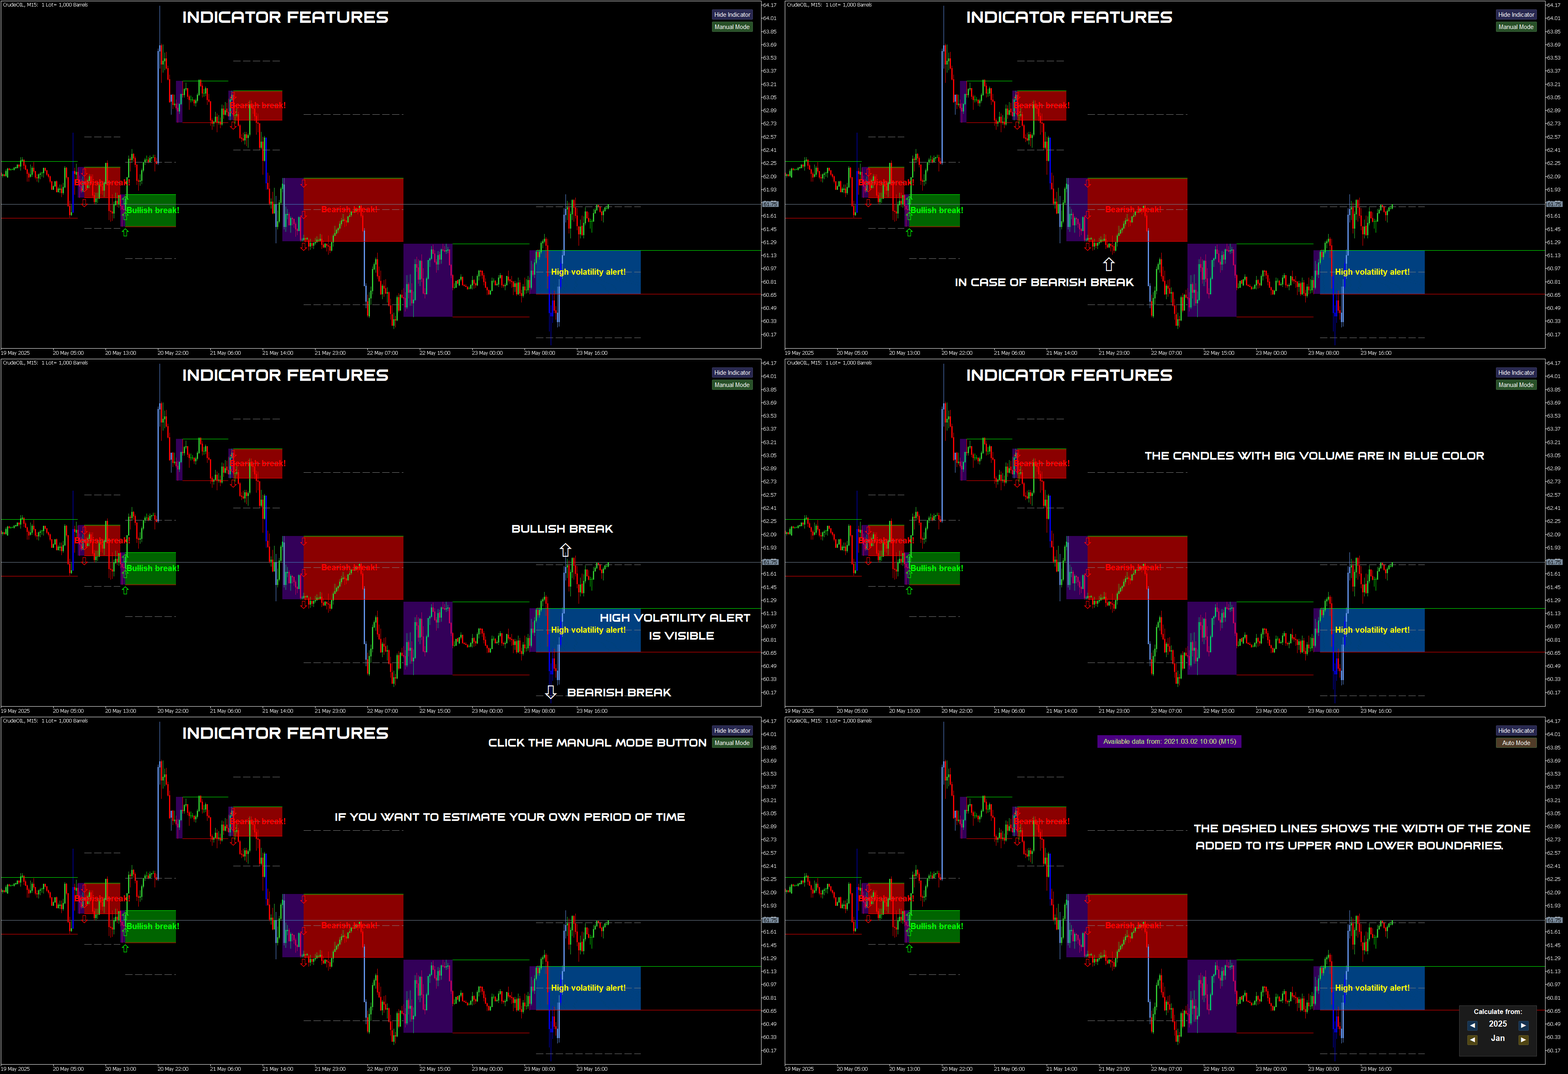
Pour passer en mode manuel, il suffit de cliquer sur le bouton Auto / Manual Mode.

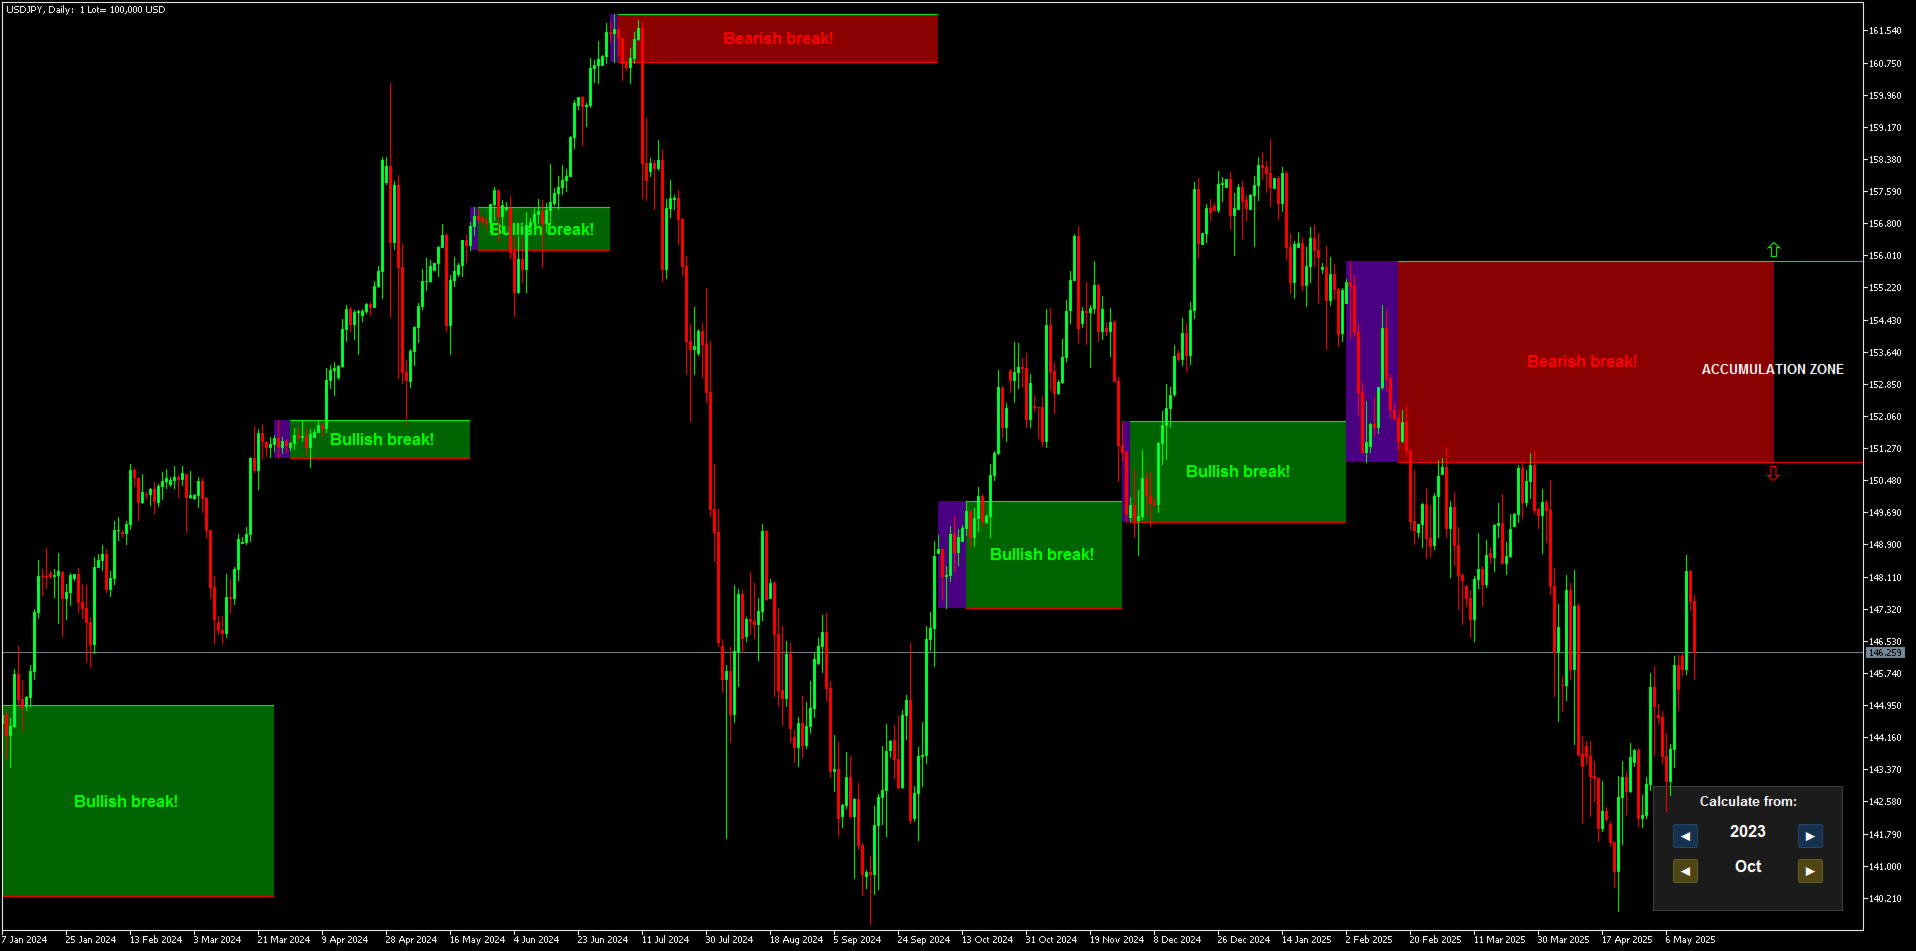
En mode manuel, tous les calculs commencent à partir du 1er janvier 2025.
Vous pouvez modifier cette date pour observer différents résultats.
La période de données optimale est de quatre à six mois.
Cela permet de capturer plusieurs cycles de marché et d’avoir des résultats solides.
Plus la période est longue, moins il y aura de zones affichées.

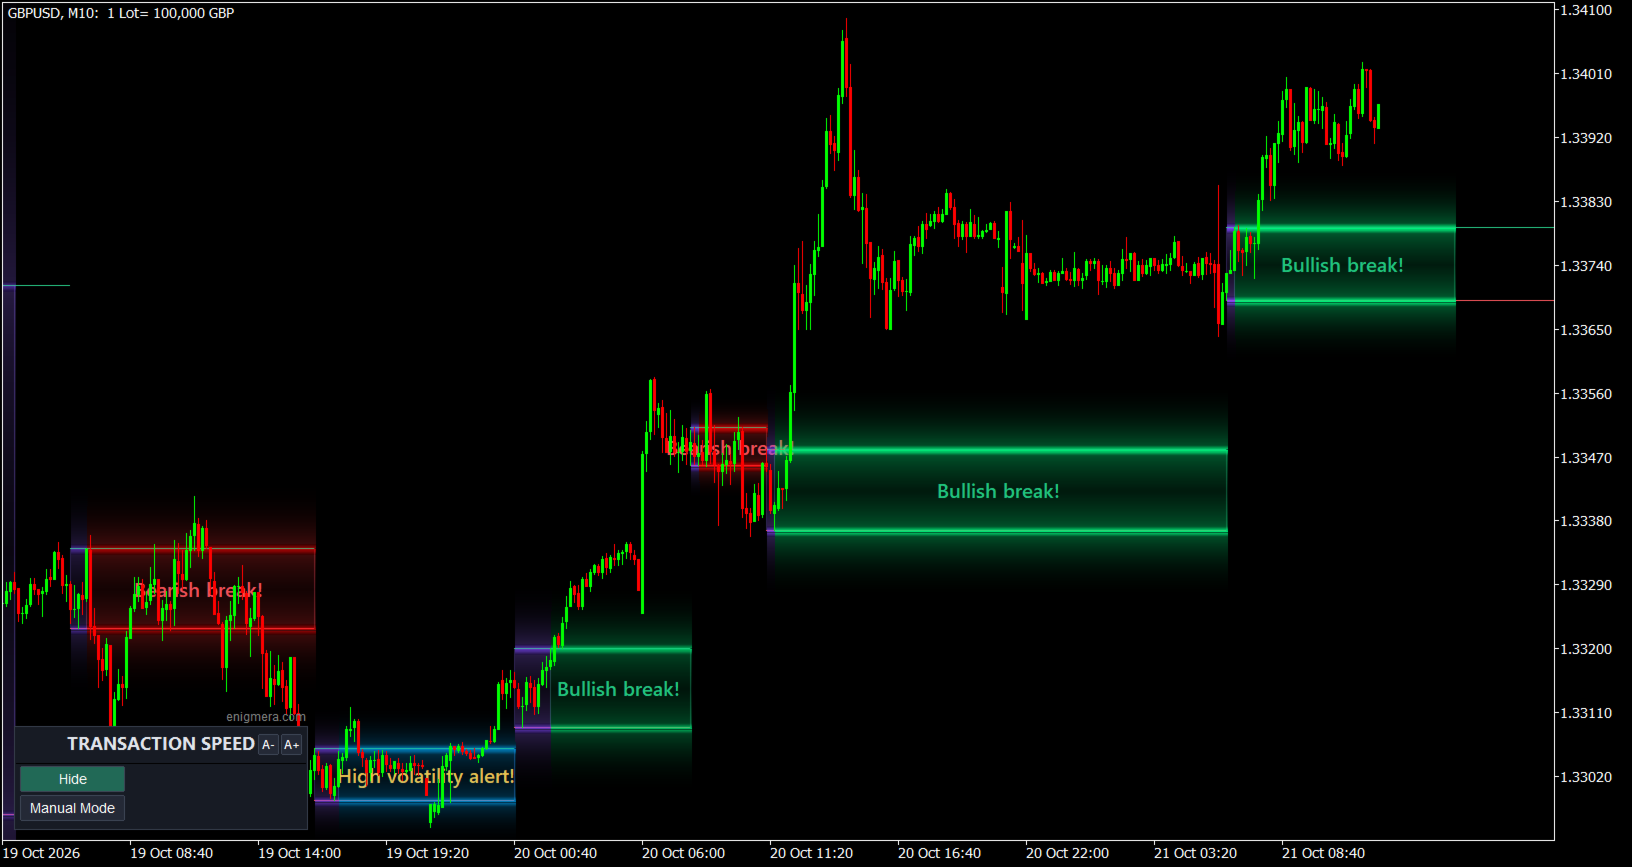
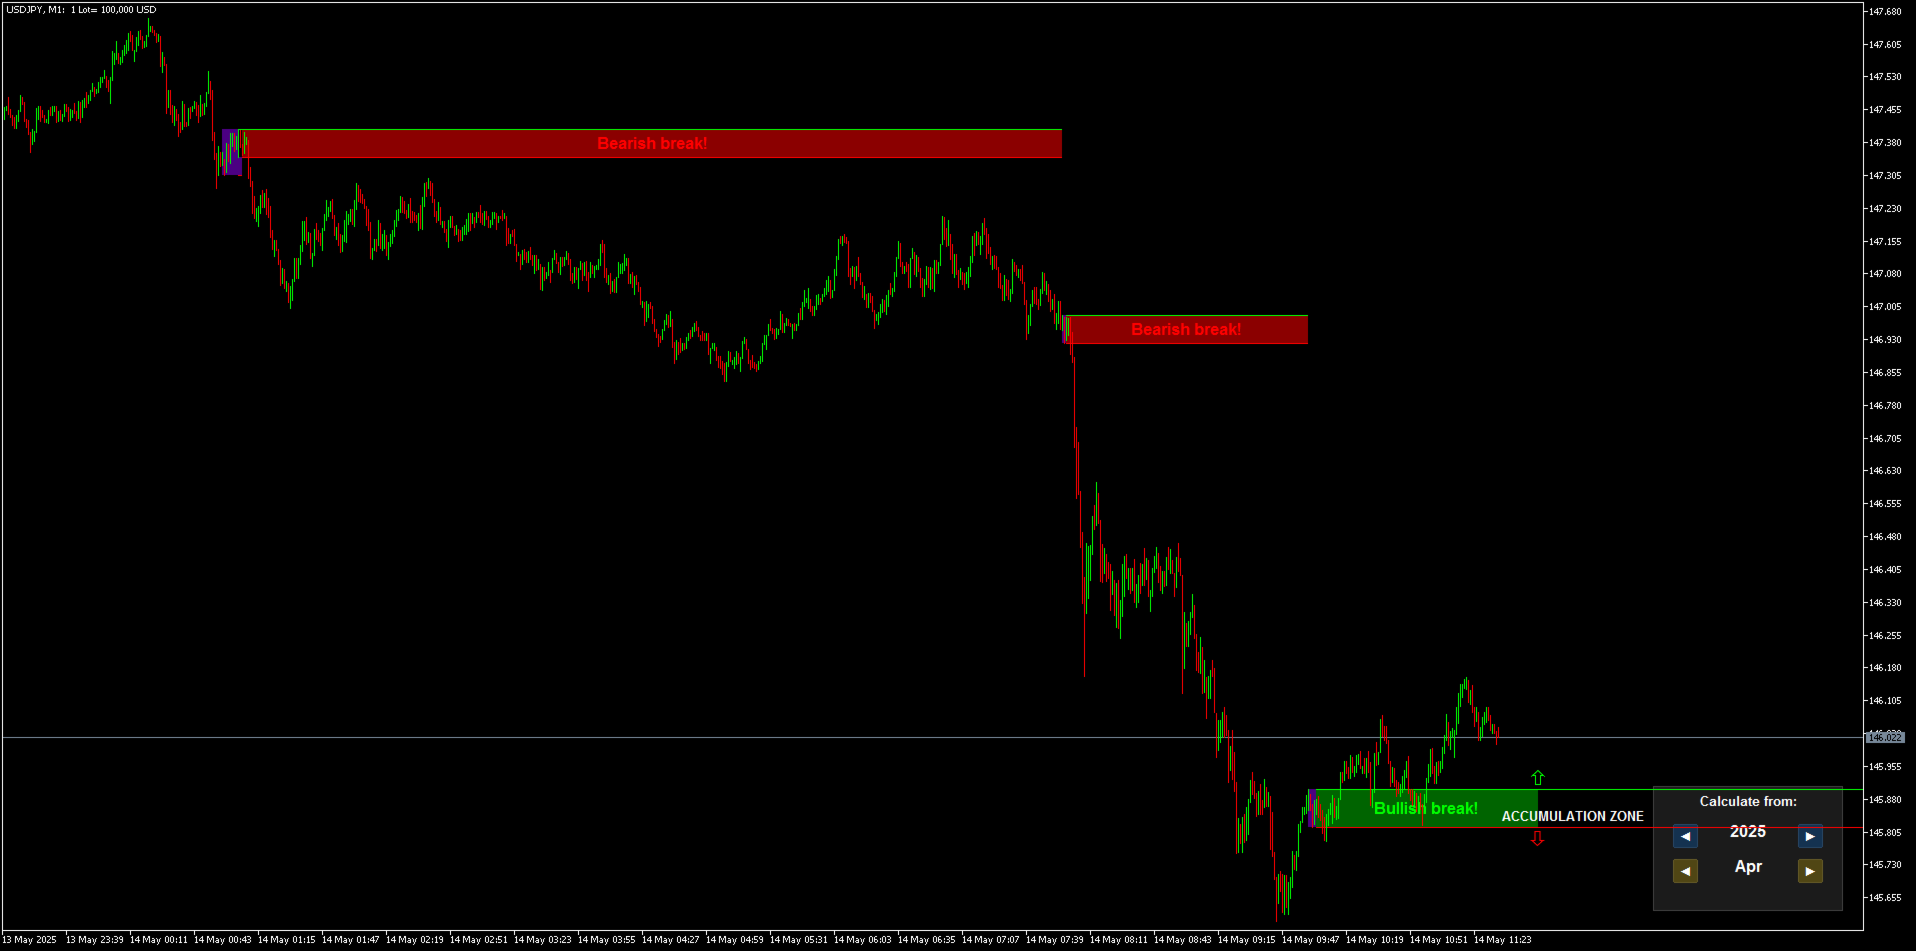
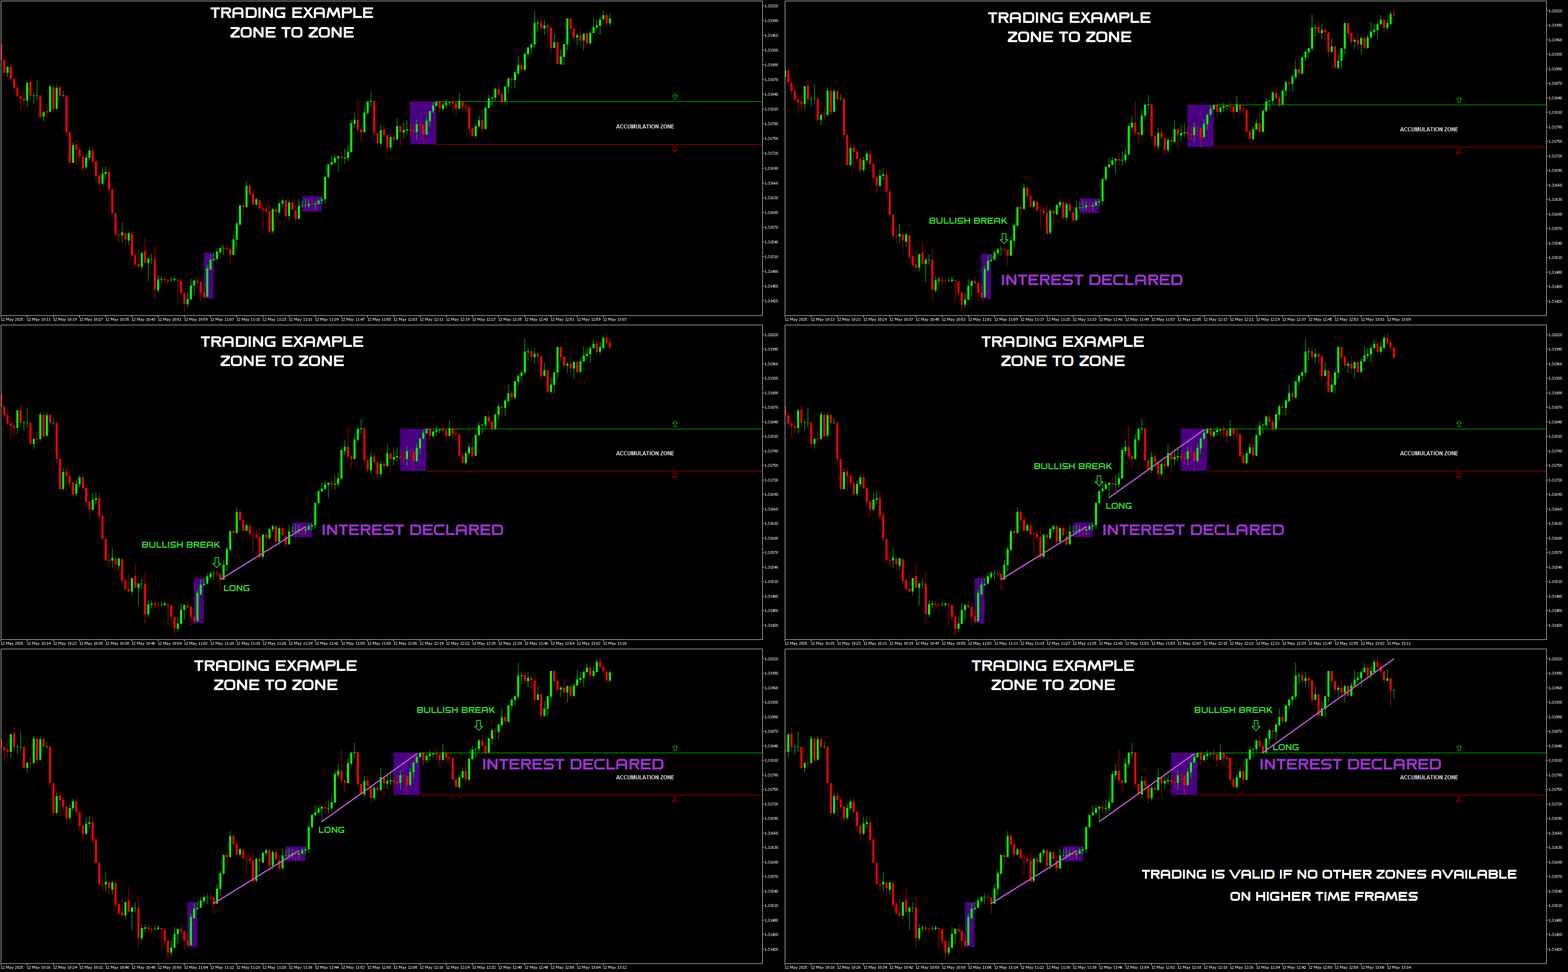
La zone où le marché montre un intérêt déclaré est représentée par un rectangle violet.
Ensuite, vous verrez apparaître la zone d’accumulation des ordres.

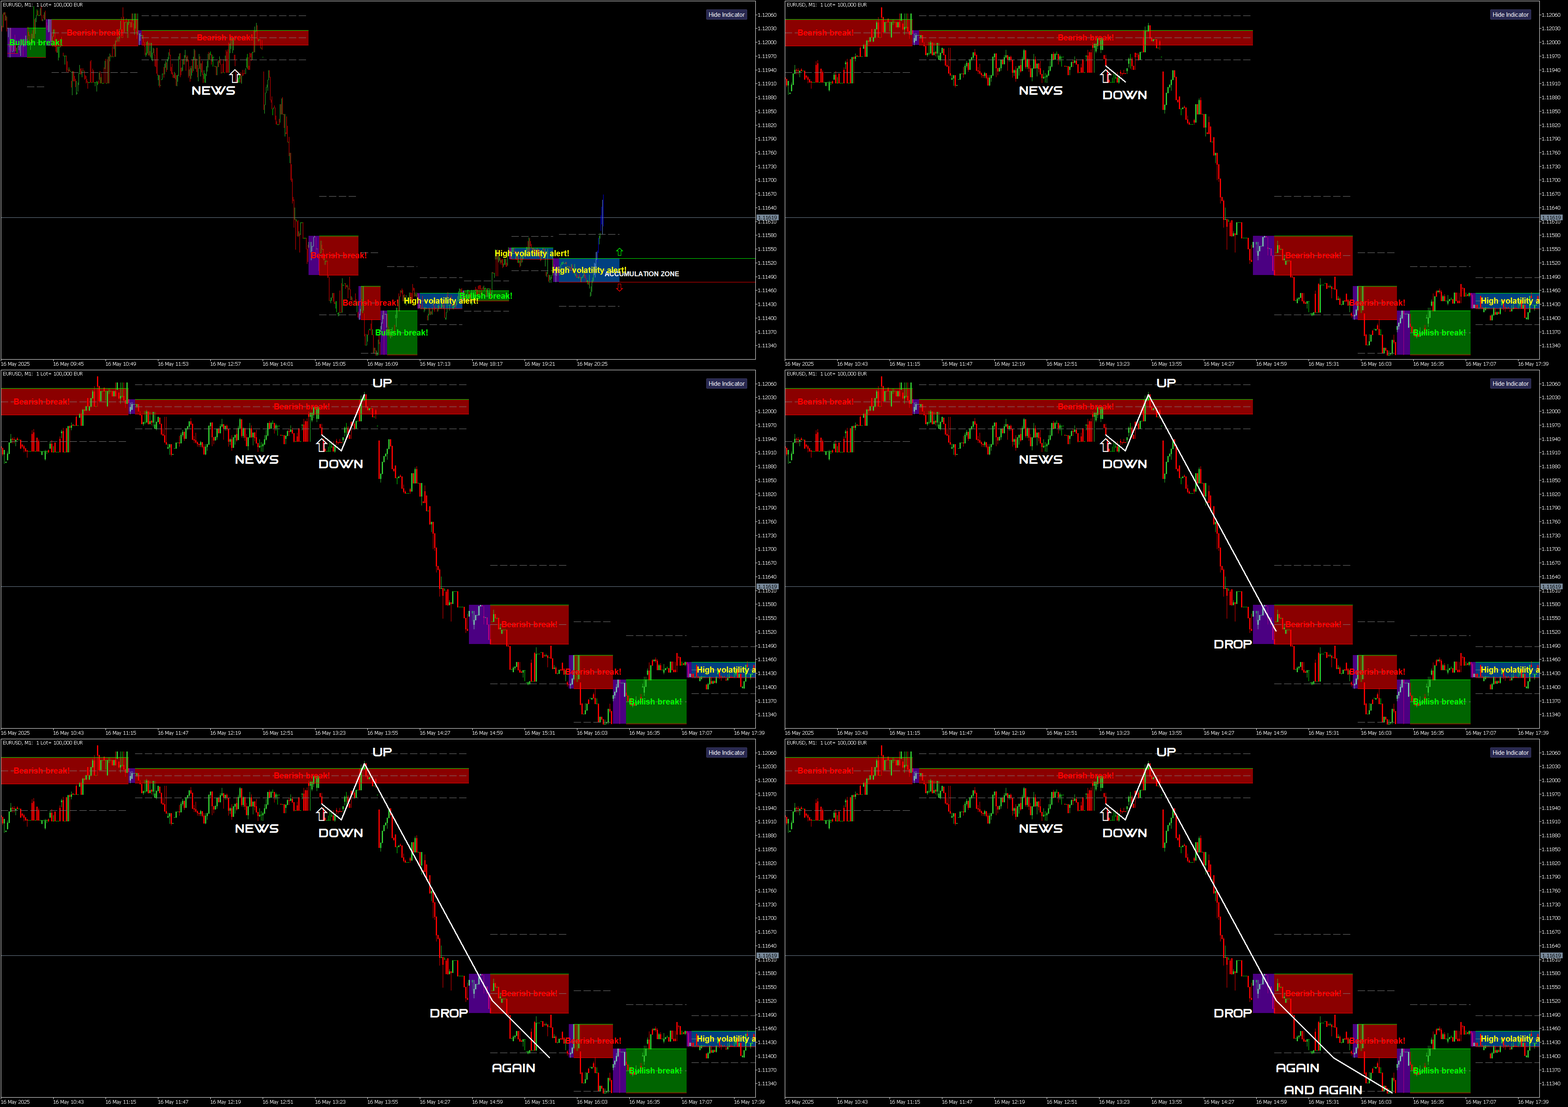
  • Si le marché casse au-dessus de cette zone, la tendance est haussière et la zone devient verte ;

  • S’il casse en dessous, la tendance est baissière et la zone devient rouge.

Une bougie qui se ferme entièrement en dehors de la zone, sans toucher ses bords, est considérée comme un véritable breakout.

Lorsqu’une bougie est entièrement formée en dehors de la zone d’accumulation, cela signale une cassure et indique la direction du marché.
La tendance reste valable jusqu’à ce qu’une cassure opposée se produise ou qu’une nouvelle zone d’intérêt apparaisse.

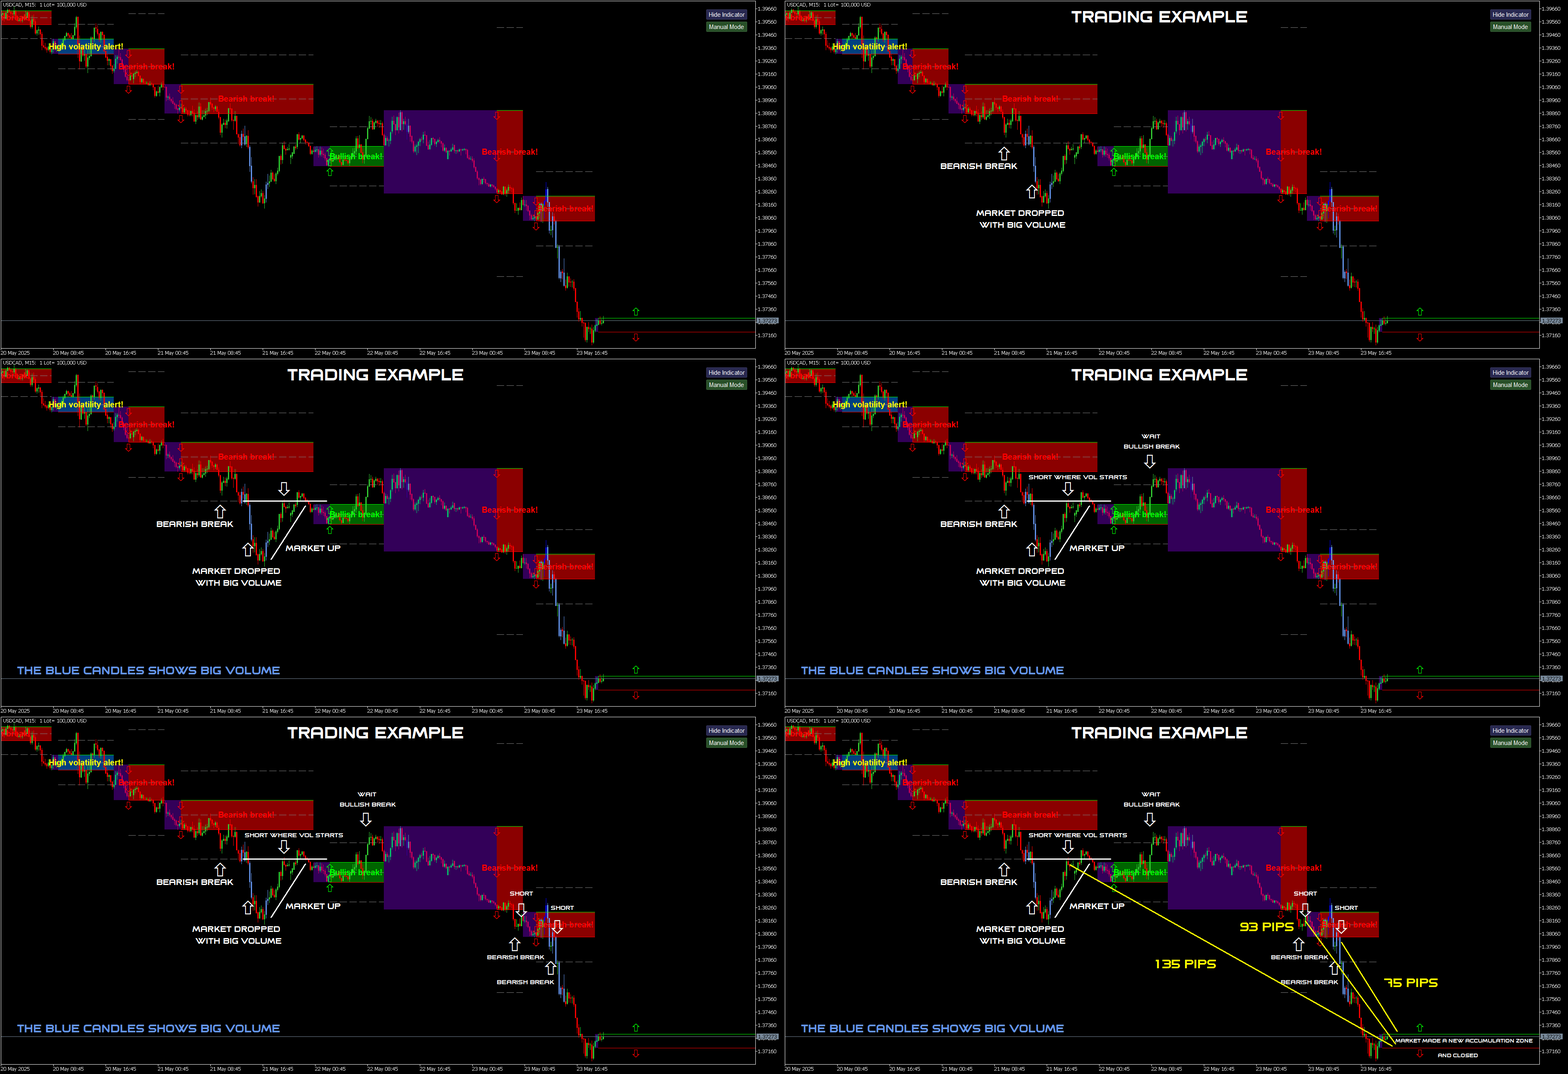
Vous pouvez trader en mode « zone à zone » :

Exemple 1 :
Lorsqu’une zone d’accumulation est cassée, ouvrez une position dans le sens du marché.

Exemple 2 :
Sur un graphique 4H, une cassure haussière se produit et le marché monte. Plus tard, une zone H1 apparaît.
Vous pouvez clôturer votre position et attendre que la zone H1 donne une nouvelle direction.

Exemple 3 :
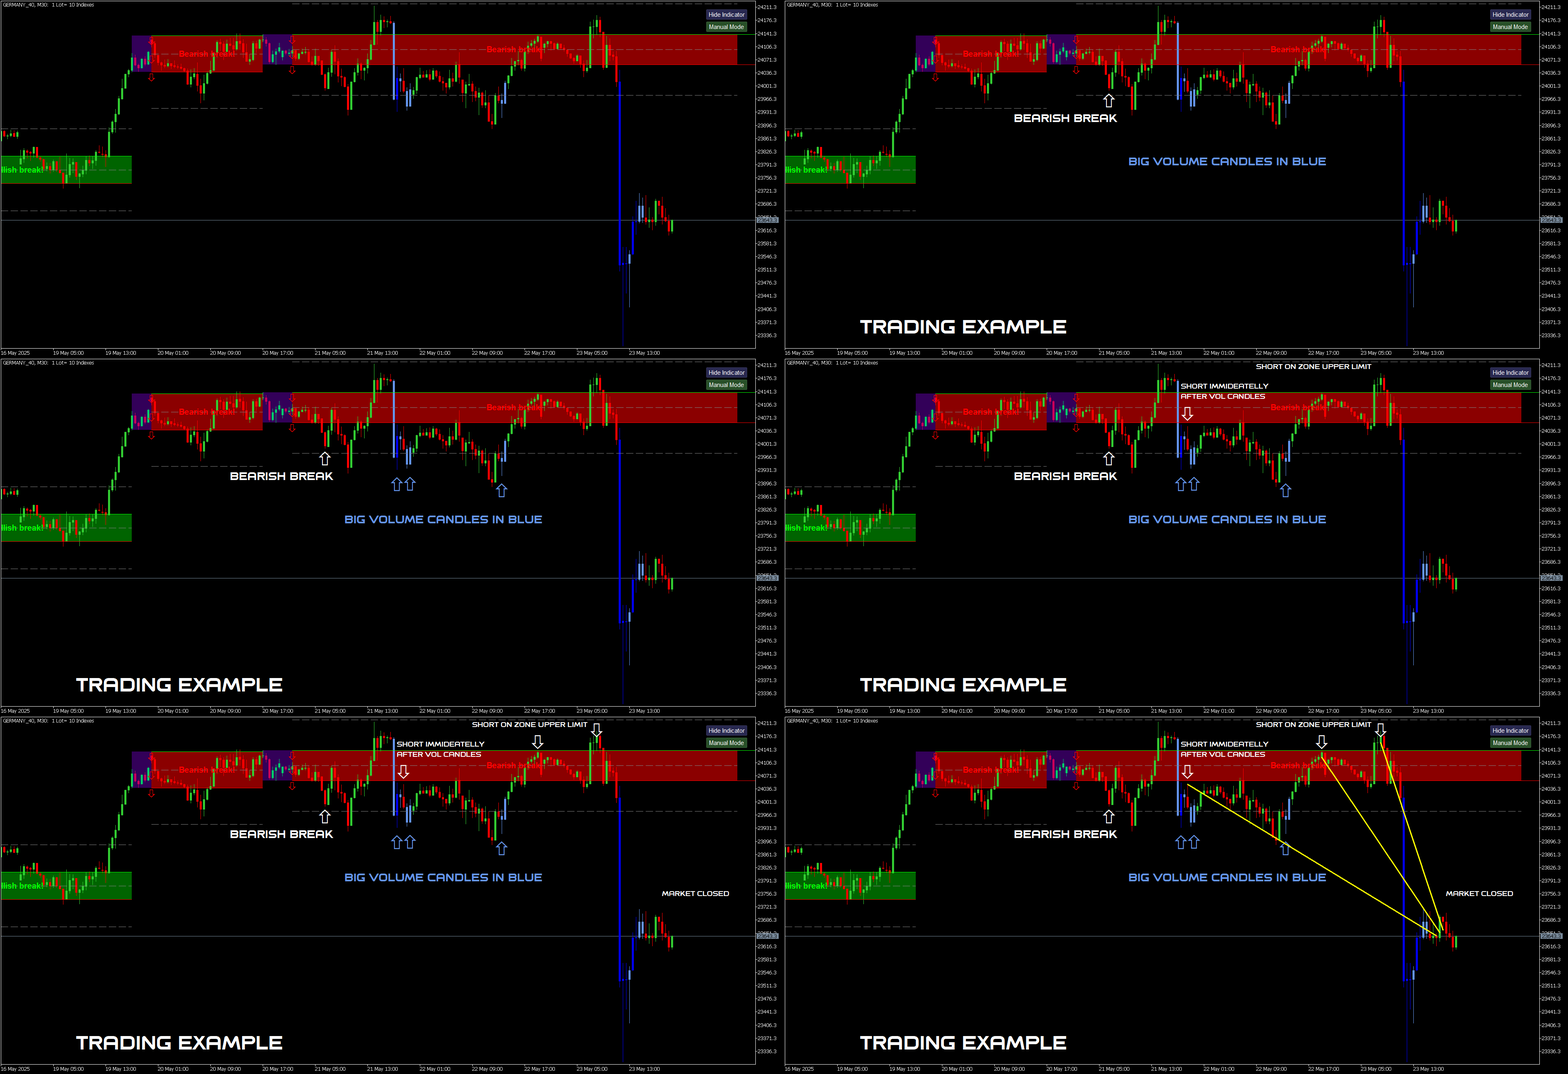
Si vous êtes à l’intérieur d’une zone, vous pouvez vendre depuis le haut ou acheter depuis le bas, jusqu’à la cassure.
C’est du trading en range, mais plus risqué.
Ne tradez jamais contre l’indicateur ! Jamais !

Si une zone est cassée des deux côtés, vous recevrez une alerte de forte volatilité (High Volatility Alert).

Ce sont les traces de l’argent.
Et tout cela est invisible à l’œil nu, car en Forex, nous n’avons que le volume en ticks, ce qui est l’un des plus grands malentendus du marché.
Cet indicateur de vitesse de transaction convertit le volume en ticks en activité réelle du marché.

C’est un outil très sérieux, conçu pour une analyse avancée.

Recommandations :

  • Paires de devises : uniquement celles avec un volume de ticks élevé — EUR/USD, USD/JPY, GBP/USD, etc.

  • Unités de temps : toutes

  • Dépôt minimum : aucun

  • Type de compte : sans restriction

  • Courtiers : sans restriction, mais préférez les gros courtiers pour leur volume plus élevé

Science pure.
Avis 4
John
133
John 2026.07.06 23:06 

love this developer .. friendly and engaging and very active on his telegram channel .. as for the indicator, its awesome add kama for an extra 50 bucks, and its a weapon

zeke21t2
813
zeke21t2 2026.02.15 13:00 

This is an amazing indicator that gives you a quick glimpse into the big picture, the most important aspect of trading: whether you should wait for a buying opportunity, a selling opportunity, or wait for the market to settle down. Simply avoiding false breakouts will dramatically improve your trading performance. For specific buying and selling opportunities, I highly recommend using it in conjunction with Meravith, another of the author's outstanding works. Pullback reversals and reversals from the top or bottom, which are entered based on chart highs and lows or volume changes, will become more effective. Honestly, I recommend this so much that I don't want anyone else to know about it :)

Max2233
807
Max2233 2025.07.08 10:33 

I would like to compliment this work of art composed by IVAN, a very precise indicator and in combination with his other jewels created by him, trading has simply become simpler and more intuitive. A round of applause to IVAN.

Produits recommandés
Blahtech VWAP MT5
Blahtech Limited
5 (1)
Blahtech VWAP - Volume Weighted Average Price (VWAP) is the ratio of price to total volume. It provides an average price over a specified time interval.  Links [  Install  |  Update  |  Documentation   ] Feature Highlights Configurable VWAP Line Sessions, intervals, anchored or continuous Previous day settlement line Standard Deviation bands Alerts at bar close or real time Automatic Broker or Tick volumes Significantly reduced CPU usage Input Parameters Expert Advisor Mode  - Reserved for iCu
FREE
Delta Profile Volume
Teresinha Moraes Correia
Technical Description of the Indicator – Delta Profile for MetaTrader 5 The Delta Profile is an indicator developed for MetaTrader 5 focused on detailed analysis of volume flow within a defined range of candles. It organizes and displays information about the imbalance of positive volumes (associated with upward movements) and negative volumes (associated with downward movements) at different price levels. The result is a clear view of the chart points where the highest concentration of trades o
ModGod Scalp Pullback - Precision Trend & Reversion Engine LAUNCH PROMOTION: Only $49 for the first 10 copies! The official price will be $490. Buy before the price goes up! The   ModGod Scalp Pullback   is an advanced, all-in-one indicator designed for professional scalpers and day traders. It combines the extreme smoothness of Triangular Moving Averages (TMA) with Heikin-Ashi trend filtering to provide highly accurate pullback entries and extreme exhaustion reversals. By mapping the natu
Value Chart Candlesticks
Flavio Javier Jarabeck
4.57 (14)
The idea of a Value Chart indicator was presented in the very good book I read back in 2020 , " Dynamic Trading Indicators: Winning with Value Charts and Price Action Profile ", from the authors Mark Helweg and David Stendahl. The idea is simple and the result is pure genius: Present candlestick Price analysis in a detrended way! HOW TO READ THIS INDICATOR Look for Overbought and Oversold levels. Of course, you will need to test the settings a lot to find the "correct" one for your approach. It
FREE
Frato Vwap Bands
Francisco Felipe Alves Da Silva Rocha
Bandes VWAP de Frato — Prix moyen pondéré par le volume avec écart type Les Bandes VWAP de Frato sont un indicateur qui combine le VWAP traditionnel avec des bandes de volatilité dynamiques. Il offre une vue multi-périodes du prix moyen pondéré par le volume. Fonctionnalités principales : L’indicateur calcule le VWAP (Prix moyen pondéré par le volume) et trace jusqu’à 3 bandes supérieures et inférieures en fonction de l’écart type. Le calcul est réinitialisé au début de chaque nouvelle pério
FREE
This z-score indicator shows the correct z-score of an asset, as it uses the normalized price data for calculation, which is the only correct way. Z-score is only applicable for normal distributed data, therefore not the actual price is considered, but the normalised returns, which were assumed to follow a normal distribution. Returns are mean reverting and assumed to follow a normal distribution, therefore z-score calculation of returns is more reliable than z-score on price, as price is NOT m
Volume Profile FREE — Multi-Session Heatmap (POC · VAH · VAL) See where trading activity actually occurs—not just where price moves. This indicator builds a clear, color-coded Volume Profile Heatmap directly on your chart and highlights the market's most important price levels: the Point of Control (POC) and the Value Area (VAH/VAL) , where price is most likely to react.
FREE
MW Volume
Martin Bittencourt
3.8 (5)
The Martinware Volume indicator plots a colored moving average over volume bars. The coloring uses three colors and can be done in different ways choosable by the user and is applied both to the average as to the volume bars. Three types of coloring are possible: None: no coloring is done Increasing or decreasing: changes the color depending on the current value being bigger or lesser than the previous one Volume relative to average: colors vary if the current volume is bigger or lesser then
FREE
La Master Edition est un outil d'analyse de qualité professionnelle conçu pour visualiser la structure du marché à travers le prisme du volume et du flux monétaire. Contrairement aux indicateurs de volume standard, cet outil affiche un Profil de Volume Quotidien directement sur votre graphique, vous permettant de voir exactement où la découverte des prix a eu lieu et où est positionné "l'argent intelligent". Cette Master Edition est conçue pour la clarté et la rapidité, dotée d'un système unique
Angus Orderflow Heatmap
Mr Monthon Chaipreechapat
Volume Footprint & Heatmap Indicator This indicator combines Volume Footprint and Heatmap visualization, inspired by the Order Flow and Heatmap concepts found in Bookmap. Unlike futures markets, the Forex market does not provide real exchange-traded volume data. Instead, it only offers Tick Volume . This indicator is designed to simulate Bookmap-style market visualization as closely as possible using the available Tick Volume data. Because the indicator relies on Tick Volume, the quality and acc
Smart Trendline Detector Smart Trendline Detector is an automatic multi-timeframe trendline analysis indicator for MetaTrader 5 that detects and ranks rising support and falling resistance structures using market swing points. Instead of filling the chart with every possible trendline, the indicator evaluates qualifying structures and displays only a controlled number of the strongest candidates according to configurable ranking criteria. The result is a cleaner chart with relevant trendline str
FREE
Aggression Volume
Flavio Javier Jarabeck
4.29 (17)
Aggression Volume Indicator is the kind of indicator that is rarely found in the MQL5 community because it is not based on the standard Volume data provided by the Metatrader 5 platform. It requires the scrutiny of all traffic Ticks requested on the platform... That said, Aggression Volume indicator requests all Tick Data from your Broker and processes it to build a very special version of a Volume Indicator, where Buyers and Sellers aggressions are plotted in a form of Histogram. Additionally,
FREE
Easy VWAP
Luca Spinello
VWAP Indicator, the short form of Volume Weighted Average Price, is similar to a moving average but takes into consideration the tick volume of the candles. The indicator calculates the moving average multiplying the price of each candle for the tick volume in the candle. Said calculation weighs with more significance price where more transactions were made. Features: Visual styling customizable Period customizable Ease of use

FREE
Visual Heatmap Book Analyzer
Alexandre Moraes De Souza Lima
Visual Heatmap Book Analyser This indicator monitors the market liquidity and generates colors based on order patterns, quantities, and renewal activities in the book. This allows you to visualize the order flow and identify areas of high and low liquidity and activity. The indicator uses machine learning techniques to analyze the order behavior in the book, enabling it to detect patterns and trends in orders, allowing you to make informed decisions about your trading operations. The color pale
Ultimate Clock – Candle & Session Indicator Ultimate Clock is an all-in-one MT5 trading indicator that combines a professional multi-session clock , real-time candle countdown timer , and session-based candle coloring into a single, lightweight tool. It helps traders instantly identify active trading sessions, monitor candle expiration, and stay synchronized with the world's major financial markets. Designed for scalpers, day traders, and swing traders, Ultimate Clock enhances market awareness
Haven Volume Profile
Maksim Tarutin
4.64 (14)
Haven Volume Profile est un indicateur multifonctionnel pour l'analyse du profil de volume qui aide à identifier les niveaux de prix clés basés sur la répartition du volume de négociation. Il a été conçu pour les traders professionnels qui souhaitent mieux comprendre le marché et identifier les points d'entrée et de sortie importants pour leurs transactions. Autres produits ->  ICI Fonctionnalités principales : Calcul du Point of Control (POC) - le niveau d'activité commerciale maximal, ce qui a
FREE
QuantumAlert RSI Navigator is a free indicator available for MT4/MT5 platforms, its work is to provide "alerts" when the market is inside "overbought and oversold" regions in the form of "buy or sell" signals. This indicator comes with many customization options mentioned in the parameter section below, user can customise these parameters as needful. Join our MQL5 group , where we share important news and updates. You are also welcome to join our private channel as well, contact me for the priva
FREE
Ospe POC Volume Profile
Nur Azureen Binti Ab Aziz
A volume-at-price heatmap with POC, value area, estimated buy/sell pressure, confirmed signals and alerts. POC Volume Profile Heatmap is a MetaTrader 5 indicator that organizes historical volume across price levels. It identifies the Point of Control, displays the selected value area, and estimates buying and selling pressure at the POC. The indicator is intended for traders who use volume-at-price structure to study acceptance, rejection and interaction around high-activity price levels. It c
FREE
Simple QM Pattern MT5
Suvashish Halder
3.75 (4)
Simple QM Pattern   is a powerful and intuitive trading indicator designed to simplify the identification of the Quasimodo (QM) trading pattern. The QM pattern is widely recognized among traders for effectively signaling potential   reversals   by highlighting key market structures and price action formations. This indicator helps traders easily visualize the QM pattern directly on their charts, making it straightforward even for those who are new to pattern trading. Simple QM Pattern includes d
FREE
Aggression Volume Profile
Edson Cavalca Junior
4.55 (11)
This indicator plots the volume profile by Price on the chart There are 5 ways to view it: By Total Volume Traded (Premium Version); Volume Ticks(Forex) Separated by Buyers and Sellers (Premium Version); Buyers Only (Premium Version); Sellers Only (Premium Version); Business balance (Buyers - Sellers) (Premium Version); . It is possible to select how many days the profiles will be calculated.( Premium Version) On the current day it recalculates the histogram data for each new candlestick.
FREE
Trend Following EURJPY
Sergio Tiscar Ortega
This EA employs a robust, data-driven approach to capitalize on the specific volatility and trend dynamics of the Euro/Yen cross. Core Strategy Features: Timeframe & Data: Optimized for the H2 (2-hour) timeframe, backtested using high-quality Dukascopy tick data with M1 precision. Intelligent Trade Management: The system utilizes advanced exit mechanisms to protect capital and lock in profits, including dynamic Trailing Stops , technical Take Profit (PT) , and strict Stop Loss (SL) risk controls
Renko bricks drawn as time-anchored boxes on your ordinary chart, so brick structure and real time stay visible together. A renko brick prints when price moves a set distance, ignoring how long that takes. That strips out the sideways noise a time chart is full of. The usual way to see them is a separate offline chart, which loses the clock. This draws the same bricks over your normal candles instead, so you keep the time axis, your other indicators, and your orders. How the bricks are built Onl
FREE
The indicator highlights the points that a professional trader sees in ordinary indicators. VisualVol visually displays different volatility indicators on a single scale and a common align. Highlights the excess of volume indicators in color. At the same time, Tick and Real Volume, Actual range, ATR, candle size and return (open-close difference) can be displayed. Thanks to VisualVol, you will see the market periods and the right time for different trading operations. This version is intended f
FREE
TrendSync Risk Calculator
Juliano Guzlinki Pacheco
Stop guessing your lot size. Risk the same amount on every trade. Most traders blow accounts not because of bad entries, but because of inconsistent position sizing: fixed lots with variable stops means every trade risks a different — and unknown — amount of money. TrendSync Risk Calculator solves this in one drag. How it works Attach the indicator. It automatically anchors three draggable lines at the current price: Entry , SL at N×ATR and TP at your chosen R:R . Drag any line — or type a new A
FREE
This robot sends Telegram notifications based on the coloring rules of PLATINUM Candle indicator. Example message for selling assets: [SPX][M15] PLATINUM TO SELL 11:45. Example message for buying assets : [EURUSD][M15] PLATINUM TO BUY 11:45 AM. Before enable Telegram notifications  you need to create a Telegram bot, get the bot API Key and also get your personal Telegram chatId. It's not possible to send messages to groups or channels. You can only send messages to your user chatId. You should
FREE
PZ Penta O MT5
PZ TRADING SLU
3.8 (5)
The Penta-O is a 6-point retracement harmonacci pattern which usually precedes big market movements. Penta-O patterns can expand and repaint quite a bit. To make things easier this indicator implements a twist: it waits for a donchian breakout in the right direction before signaling the trade. The end result is an otherwise repainting indicator with a very reliable trading signal. The donchian breakout period is entered as an input. [ Installation Guide | Update Guide | Troubleshooting | FAQ | A
FREE
Session Profiles
Basharat Umar Khan
Short Description Draws rolling Time-Price-Opportunity (TPO) and footprint volume profiles for the Asia, London, and New York sessions with POC/VAH/VAL levels, delta volume bias, order flow overlays, liquidity heatmaps, developing rolling lines, Naked POC (NPOC) tracking, Initial Balance breakouts, multi-session confluence zones, and automatic broker GMT-offset detection. Full Description Plots separate market-profile and volume-profile style histograms for the three major trading sessions (Asi
FREE
Daily & Composite Volume Profile   This is a professional-grade market profile tool designed for MetaTrader 5. It utilizes a   Dual-Profile System   to visualize supply, demand, and liquidity concentrations. Key Features Left Side: Daily Session Profiles Automatically identifies the start and end of every trading day. Generates a unique Volume Profile for each individual day. Allows you to see how value migrated from yesterday to today (e.g., Is today's volume higher or lower than yesterday?).
TPO Profile MT5
Kyra Nickaline Watson-gordon
Definition : TPO is a Time Price Opportunity. Instead of using bars or candles with an Open, High, Low, and Close price, each "bar" in a Market Profile is represented by horizontal bars against the price It is called Market Profile terminology. In other words time-price-opportunity (TPO) profiles are histograms of how much time was spent at each price within the span of the profile. By using a TPO chart, you are able to analyze the amount of trading activity, based on time, for each price level
Friend of the Trend: Your Trend Tracker Master the market with Friend of the Trend , the indicator that simplifies trend analysis and helps you identify the best moments to buy, sell, or wait. With an intuitive and visually striking design, Friend of the Trend analyzes price movements and delivers signals through a colorful histogram: Green Bars : Signal an uptrend, indicating buying opportunities. Red Bars : Alert to a downtrend, suggesting potential selling points. Orange Bars : Represent cons
FREE
Les acheteurs de ce produit ont également acheté
Meravith Scanner
Ivan Stefanov
5 (3)
MERAVITH SCANNER est un indicateur professionnel pour les marchés financiers sur MetaTrader 5, qui regroupe plusieurs outils d’analyse en un seul système intégré. Il effectue tous les calculs automatiquement en utilisant une méthodologie propriétaire de prix moyen pondéré par le volume (VWAP), éliminant ainsi toute interprétation subjective. Cet indicateur fonctionne sur toutes les classes d’actifs (Forex, actions, indices, matières premières, cryptomonnaies) et sur toutes les périodes, de M1 au
Volume Arrow Signal Product Description Volume Arrow Signal is a smart trading indicator designed to help traders identify potential buy and sell opportunities using price action, volume behavior, and directional arrow signals. The indicator places clear arrows directly on the chart, making it easy to spot possible market reversals, trend continuations, and entry opportunities without spending hours analyzing charts manually. Whether you are trading Gold (XAUUSD) , Forex pairs, Indices, or Crypt
ORB Seeker MT5
Marcela Goncalves De Oliveira
Prix spécial pour limiter la disponibilité et maintenir la rareté du produit ! Seulement 599 $ ! Après votre achat, contactez-moi pour obtenir le bonus ORB Seeker EA et les fichiers de configuration optimisés personnalisés. Réussissez vos sessions de mixage en toute confiance ! ORB Seeker MT5 est un indicateur professionnel de cassure de la plage d'ouverture (ORB) conçu pour les traders qui recherchent précision, simplicité, flexibilité et une structure de graphique claire. Il trace automatiqu
KenKem Master Volume Profiler - Brief Introduction A Display-only volume-profile cockpit for XAUUSD, BTCUSD and other liquid symbols. Draws profile structure, multi-timeframe flow, EMA trend and study-only setup markers. Places no orders. Not a signal service.  It maps where the market has actually traded and reads recent order flow, so you can see structure and lean at a glance.  What it shows: Master and local volume profiles (POC and value-area high/low) - the price shelves that matter. A liv
En bref Cet indicateur combine deux experts — le RSI et le MACD — en un seul système. Au lieu de regarder deux graphiques séparés et de faire des suppositions, il prend la décision pour vous : lorsque les deux indicateurs sont d'accord, il dessine une flèche (achat ou vente). Le plus important : les flèches ne sont pas repeintes . Une fois apparues, elles restent là où elles sont. Vous pouvez backtester et trader en direct en toute confiance. Que signifie "Combo" Normalement, un trader regarde l
TrendMaestro5
Stefano Frisetti
note: this indicator is for METATRADER4, if you want the version for METATRADER5 this is the link:  https://www.mql5.com/it/market/product/108106 TRENDMAESTRO ver 2.5 TRENDMAESTRO recognizes a new TREND from the start, he never makes mistakes. The certainty of identifying a new TREND is priceless. DESCRIPTION TRENDMAESTRO identifies a new TREND in the bud, this indicator examines the volatility, volumes and momentum to identify the moment in which there is an explosion of one or more of these da
Indicateur MT5 Voyez ce que le marché fait vraiment.   Visualisez les 3 phases de marché en direct devant vous (Contraction, Expansion, Tendance) et prenez de meilleures entrées dès le   début de la phase de Tendance.      Arrêtez de deviner. Commencez à lire le marché comme le font les institutions et le smart money.   Apex Market Structure Pro pour MT5 est un outil d'analyse smart-money de précision qui élimine le bruit et vous révèle la   véritable structure sous chaque bougie : liquidité
Title:FX-AIEA Supply and Demand Zone Indicator (MT5) — Technical Overview Version: 2.51 | Platform: MetaTrader 5 Introduction Supply and demand zones are considered a core manifestation of institutional order flow, providing a more direct reflection of buying and selling pressure than traditional support/resistance levels. This indicator attempts to automate the identification of high-probability supply and demand zones using an adaptive ZigZag algorithm, reducing the subjectivity and time asso
VTrende Pro
Andrii Diachenko
5 (1)
VTrende Pro - MTF indicator for trend trading with a display panel for MT5 *** Videos can be translated into any language using subtitles (video language - Russian) Although the signals of the VTrende Pro indicator can be used as signals of a full-fledged trading system, it is recommended to use them in conjunction with the Bill Williams TS. VTrende Pro is an extended version of the VTrende indicator. Difference between Pro version and VTrende: - Time zones - Signal V - signal 1-2 waves -    S
SMC Institutional Suite v3.7 Professional Smart Money Concept Indicator for MetaTrader 5 What is New in Version 3.7 - Visual Stability Update This release focuses entirely on one goal: making every zone, label, and line on your chart rock-solid stable. There is no more flickering, no more zones disappearing on a new candle, and no more duplicate drawings. Order Block (OB) zones no longer flicker or disappear. Once drawn, they stay permanently on the chart. Equal Highs and Equal Lows (EQH / EQL)
PrimeScalping
Temirlan Kdyrkhan
PrimeScalping is a powerful trading companion designed to generate high-probability entry signals with dynamic TP/SL/DP levels based on volatility. Built-in performance tracking shows win/loss stats, PP1/PP2 hits, and success rates — all updated live. Key Features: Buy/Sell signals with adaptive volatility bands Real-time TP/SL/DP levels based on ATR Built-in MA Filter with optional ATR/StdDev volatility Performance stats panel (Success, Profit/Loss, PP1/PP2) Alerts via popup, sound, push, or e
MasterTrend
Temirlan Kdyrkhan
MasterTrend Indicator for MT5 A powerful trend-following and signal-evaluation tool MasterTrend   is a custom MT5 indicator that combines Moving Averages and ATR-based risk/reward logic to generate clear buy/sell signals. It visualizes dynamic SL/TP levels, evaluates past trade outcomes, and displays win/loss statistics in a clean on-chart panel. Key features include: Buy/Sell signals based on MA crossovers ATR-based SL/TP1/TP2/TP3 levels with visual lines and labels Signal outcome tracking wit
SMC Sweep Fvg MT5
Daniil Sleptsov
5 (1)
SMC Sweep Fvg MT5 — voyez le marché comme le smart money, directement sur votre graphique Vous connaissez ce sentiment : le prix prend votre stop, se retourne et part exactement là où vous l’attendiez. Vous aviez raison sur la direction. Vous n’avez eu tort que sur l’entrée. Cet indicateur existe pour que cela arrive moins souvent. Il prend en charge la partie la plus lourde de l’analyse — le marquage du graphique — et vous laisse l’essentiel : la décision. Ce que vous voyez sur le graphique
The Expert Advisor and the video are attached in the Discussion tab . The robot applies only one order and strictly follows the signals to evaluate the indicator efficiency. Pan PrizMA CD Phase is an option based on the Pan PrizMA indicator. Details (in Russian). Averaging by a quadric-quartic polynomial increases the smoothness of lines, adds momentum and rhythm. Extrapolation by the sinusoid function near a constant allows adjusting the delay or lead of signals. The value of the phase - wave s
Классификатор силы тренда. Показания на истории не меняет. Изменяется классификация только незакрытого бара. По идее подобен полной системе ASCTrend, сигнальный модуль которой, точнее его аппроксимация в несколько "урезанном" виде, есть в свободном доступе, а также в терминале как сигнальный индикатор SilverTrend . Точной копией системы ASCTrend не является. Работает на всех инструментах и всех временных диапазонах. Индикатор использует несколько некоррелируемых между собой алгоритмов для класси
FFx Universal Strength Meter PRO is more than a basic strength meter. Instead of limiting the calculation to price, it can be based on any of the 19 integrated strength modes + 9 timeframes. With the FFx USM, you are able to define any period for any combination of timeframes. For example, you can set the dashboard for the last 10 candles for M15-H1-H4… Full flexibility! Very easy to interpret... It gives a great idea about which currency is weak and which is strong, so you can find the best pai
The FFx Universal MTF alerter shows on a single chart all the timeframes (M1 to Monthly) with their own status for the chosen indicator. 9 indicators mode (MACD-RSI-Stochastic-MA-ADX-Ichimoku-Candles-CCI-PSAR). Each can be applied multiple times on the same chart with different settings. Very easy to interpret. Confirm your BUY entries when most of the timeframes are showing green color. And confirm your SELL entries when most of the timeframes are showing red color. 2 Alert Options : input to s
The FFx Watcher PRO is a dashboard displaying on a single chart the current direction of up to 15 standard indicators and up to 21 timeframes. It has 2 different modes: Watcher mode: Multi Indicators User is able to select up to 15 indicators to be displayed User is able to select up to 21 timeframes to be displayed Watcher mode: Multi Pairs User is able to select any number of pairs/symbols User is able to select up to 21 timeframes to be displayed This mode uses one of the standard indicators
FFx Patterns Alerter gives trade suggestions with Entry, Target 1, Target 2 and StopLoss .... for any of the selected patterns (PinBar, Engulfing, InsideBar, OutsideBar) Below are the different options available: Multiple instances can be applied on the same chart to monitor different patterns Entry suggestion - pips to be added over the break for the entry 3 different options to calculate the SL - by pips, by ATR multiplier or at the pattern High/Low 3 different options to calculate the 2 TPs -
MetaTrader 4 version available here : https://www.mql5.com/en/market/product/24881 FFx Basket Scanner is a global tool scanning all pairs and all timeframes over up to five indicators among the 16 available. You will clearly see which currencies to avoid trading and which ones to focus on. Once a currency goes into an extreme zone (e.g. 20/80%), you can trade the whole basket with great confidence. Another way to use it is to look at two currencies (weak vs strong) to find the best single pairs
MetaTrader 4 version available here: https://www.mql5.com/en/market/product/25793 FFx Pivot SR Suite PRO is a complete suite for support and resistance levels. Support and Resistance are the most used levels in all kinds of trading. Can be used to find reversal trend, to set targets and stop, etc. The indicator is fully flexible directly from the chart 4 periods to choose for the calculation: 4Hours, Daily, Weekly and Monthly 4 formulas to choose for the calculation: Classic, Camarilla, Fibonac
Le niveau Premium est un indicateur unique avec une précision de plus de 80 % des prédictions correctes ! Cet indicateur a été testé par les meilleurs Trading Specialists depuis plus de deux mois ! L'indicateur de l'auteur que vous ne trouverez nulle part ailleurs ! À partir des captures d'écran, vous pouvez constater par vous-même la précision de cet outil ! 1 est idéal pour le trading d'options binaires avec un délai d'expiration de 1 bougie. 2 fonctionne sur toutes les paires de devises
ClassicSBA
Umri Azkia Zulkarnaen
this indicator very simple and easy if you understand and agree with setup and rule basic teknical sba you can cek in link : please cek my youtube channel for detail chanel : an for detail info  contact me  basicly setup buy (long) for this indicator is Magenta- blue and green candle or magenta - green  and green candlestik and for setup sell (short) is Black - yellow - and red candle or black - red  and red candlestik
WanaScalper
Isaac Wanasolo
1 (1)
A scalping indicator based on mathematical patterns, which on average gives signals with relatively small SL, and also occasionally helps to catch big moves in the markets (more information in the video) This indicator has three main types of notifications: The first type warns of a possible/upcoming signal on the next bar The second type indicates the presence of a ready signal to enter the market/open a position The third type is for SL and TP levels - you will be notified every time price re
Индикатор Coefficient Of Determination (COD) представляет собой значение коэффициента детерминации или квадрат коэффициента корреляции между зависимой переменной — ценой и объясняющей переменной — тиковым объемом. Что это дает нам на практике? COD отлично распознает кульминацию трендовых движений, что позволяет подбирать оптимальные точки и ловить развороты рынка. Как использовать индикатор: Наиболее популярная торговая стратегия строится совместно с трендовым индикатором Moving Average (MA), пе
Recommended TimeFrame >= H1. 100% Non Repainted at any moment.  Use it carefully, only with Trend Direction. Trading Usage: 2 Variants: as Range System or as BreakOut System (Both Only With Trend Direction)::: (Always use StopLoss for minimise Risk); [1] as Range System: (Recommended) in UP TREND:  - BUY in Blue Line , then if price goes down by 50 points (on H1) open Second BUY.   Close in any Profit you wish: TrailingStop(45 points) or Close when Price touches upper Gold Line. in DOWN TREND
Spike Detector
Tete Adate Adjete
this indicator is a Spike detector indicator, it is specially designed to trade Boom 1000, Boom 500, Crash 1000 and Crash 500 We recommend using it on Deriv Boom and Crash indices only Its setting is intuitive, familiar, easy to use it has notification functions; audible notifications and push notifications. this tool is simple to use, easy to handle This update is based on different strategies for spikes
Limitless MT5
Dmitriy Kashevich
Limitless MT5 is a universal indicator suitable for every beginner and experienced trader. works on all currency pairs, cryptocurrencies, raw stocks Limitless MT5 - already configured and does not require additional configuration And now the main thing Why Limitless MT5? 1 complete lack of redrawing 2 two years of testing by the best specialists in trading 3 the accuracy of correct signals exceeds 80% 4 performed well in trading during news releases Trading rules 1 buy signal - the ap
Seconds Charts
Aleksandr Goryachev
Micro  ******************* Секундные графики MT5 ********************** Более точного инструмента для входа в сделку вы не найдёте. Входные параметры: Timeframe, sek - период построения графика, секунды Displayed bars - отображаемые бары Step of price levels, pp, 0-off - шаг отрисовки ценовых уровней, пункты Scale points per bar, 0-off - масштаб в пунктах на бар Show lines - отображение текущих уровней Show comment - отображение комментария Standard color scheme - стандартная цветовая сх
QXS Market Scanner
Netlux Digital Kft.
QuantXMarketScanner is a multi assets indicator for MT5 - Mathematical model based on 7 custom moving averages indicators  - Adaptable on Currencies, Stocks and Crypto - Automatic setup, self optimized About QuantXsystem Products: –         Simple installation & integration into MT5   –         Unlimited License after purchase (for one user) –         Automatic pattern recognition to identify the best timing and price levels. –         Trading indicators are displayed directly and automaticall
Plus de l'auteur
Meravith Scanner
Ivan Stefanov
5 (3)
MERAVITH SCANNER est un indicateur professionnel pour les marchés financiers sur MetaTrader 5, qui regroupe plusieurs outils d’analyse en un seul système intégré. Il effectue tous les calculs automatiquement en utilisant une méthodologie propriétaire de prix moyen pondéré par le volume (VWAP), éliminant ainsi toute interprétation subjective. Cet indicateur fonctionne sur toutes les classes d’actifs (Forex, actions, indices, matières premières, cryptomonnaies) et sur toutes les périodes, de M1 au
Meravith MT5
Ivan Stefanov
5 (3)
MERAVITH est un indicateur de volume et de liquidité multi-unités de temps pour MetaTrader 5 qui montre la tendance, les zones de support et de résistance, l'entrée, les objectifs et le stop loss sur chaque unité de temps. Il vous donne une carte complète de la liquidité du marché, un outil de liquidité dans le style des hedge funds, et il fait tous les calculs automatiquement avec une méthode propre de prix moyen pondéré par le volume, donc il n'y a pas d'interprétation subjective. Fonctionne s
Currency Strength Anchor – force relative adaptée aux sessions, ancrée sur les ouvertures quotidienne, hebdomadaire et mensuelle. Sans repaint. La plupart des indicateurs de force comparent les instruments sur une période fixe. Le sens du résultat change au fur et à mesure que la journée de trading passe d’une session à l’autre : un classement basé sur les données de la session asiatique dit peu de choses une fois que Londres et New York sont ouverts. Currency Strength Anchor utilise une référe
Fibowave
Ivan Stefanov
FIBOWAVE Comptage automatique des vagues d'Elliott sur sept unités de temps à la fois, du graphique mensuel jusqu'au M5, avec le retracement de Fibonacci de la correction en cours, l'objectif de Fibonacci des vagues 3, 5 et C, le niveau de prix où le comptage échoue, et une alerte au début d'une vague 3 ou 5. Compter les vagues d'Elliott à la main est lent, et deux analystes arrivent rarement au même comptage. FIBOWAVE compte selon des règles fixes, de la même manière à chaque fois, et inscrit
GANN Master trace les niveaux en racine carrée de W. D. Gann pour le jour, la semaine ou le mois en cours et marque les zones où les objectifs des acheteurs et des vendeurs se rejoignent. Les niveaux sont calculés à partir du plus haut et du plus bas de la période précédente, ils restent fixes pendant toute la période et ils ne se redessinent pas. Comment les niveaux sont construits Le plus haut de la période précédente devient la ligne TOP et son plus bas devient la ligne BOTTOM. À partir de TO
MACD divergency
Ivan Stefanov
4.7 (10)
Cet indicateur identifie avec précision les divergences haussières et baissières entre les mouvements de prix et l’histogramme MACD, en utilisant des moyennes mobiles exponentielles (EMA) de périodes 5 (rapide) et 34 (lente), ainsi qu’une ligne de signal de période 5. Il met en évidence les points où le momentum faiblit, signalant de possibles renversements de tendance. Règles pour une identification correcte des divergences La divergence haussière est valide lorsque le prix forme des creux plus
FREE
Primes Action trace sur le graphique les niveaux haut et bas du jour, de la semaine et du mois précédents, et signale quand le prix les casse. Chaque unité de temps a sa propre couleur, les trois références sont donc faciles à distinguer. Comment les niveaux sont trouvés Le plus haut ou le plus bas exact d'une période n'est souvent qu'une mèche courte. Primes Action examine le huitième supérieur et le huitième inférieur de la période précédente terminée. Dans chacun d'eux, il trace le niveau où
Ichimoku Nexus Pro
Ivan Stefanov
5 (1)
Ichimoku Nexus Pro Ichimoku Kinko Hyo avec les trois théories de Goichi Hosoda sur un même graphique : les cinq lignes, la théorie des vagues (vagues I, V, N, P, Y et W), la théorie du prix (les objectifs N, V, E et NT) et la théorie du temps (les comptes temporels kihon suchi et taito suchi). S'y ajoutent un nuage d'unité de temps supérieure qui ne se repeint pas, une Chikou Span mesurée, un filtre de range qui retient les signaux de croisement tant que la Kijun est plate, que la Kumo est mince
FREE
KAMA Confluence Engine Tradez dans le sens de la tendance — et connaissez votre Entrée, Stop et Objectifs dès l’instant où le marché se retourne. Le KAMA Confluence Engine est un indicateur de tendance tout‑en‑un basé sur la moyenne mobile adaptative de Kaufman (KAMA), enrichi par une pondération du volume en ticks, une confirmation multi‑unités de temps et des niveaux de trading automatiques. Il s’adapte au marché : rapide et réactif en tendance, stable et filtré en période de range — pour vous
Order Block Scorecard marque les zones d'offre et de demande sur votre graphique et tient, pour chaque zone, un relevé mesuré sur votre propre historique : combien de fois le prix y est entré, combien de ces tests elle a tenu, et jusqu'où le prix est allé ensuite. Ces trois chiffres décrivent ce qui s'est déjà produit sur le symbole et l'unité de temps que vous avez sous les yeux. C'est un relevé du comportement passé, pas une prévision. La règle de la zone Une seule règle, écrite en entier, pou
FREE
Meravith
Ivan Stefanov
5 (3)
Outil des market makers. Meravith va : Analyser toutes les unités de temps et afficher la tendance actuellement en vigueur. Mettre en évidence les zones de liquidité (équilibre des volumes) où le volume haussier et baissier est égal. Afficher tous les niveaux de liquidité provenant de différentes unités de temps directement sur votre graphique. Générer et présenter une analyse de marché sous forme de texte pour votre référence. Calculer les objectifs, les niveaux de support et les points de stop
RSI Divergence Pulse est un indicateur RSI complet qui combine détection de divergences, analyse multi-timeframe et outils visuels dans une seule application légère. Il identifie automatiquement les divergences régulières et cachées, affiche un panneau RSI Multi-Timeframe en direct, remplit les zones OB/OS pour une reconnaissance visuelle, trace des lignes de divergence à la fois sur le graphique des prix et dans la sous-fenêtre RSI, place des flèches Buy/Sell et fournit des alertes en temps ré
Imbalance Pro
Ivan Stefanov
5 (4)
L'indicateur mesure le déséquilibre entre les haussiers et les baissiers sur une période donnée et affiche une ligne droite entre les deux points. Si les haussiers ont plus de volume que les baissiers, la ligne devient verte.  Si les baissiers ont plus de volume, elle est rouge. La ligne indique également le pourcentage de différence de volume. L'indicateur affiche les mêmes données dans une fenêtre séparée. Vous pouvez également voir le volume divisé. L'indicateur a deux modes. À cet effe
RSI Divergence Pulse is an RSI-based indicator for MetaTrader 4. It detects regular and hidden divergences, draws them on the price chart and in the RSI subwindow, shows RSI values from five timeframes in one panel, and reports the current RSI state in an information panel. Alerts can be sent when a divergence is confirmed. How it works The indicator calculates a standard RSI and a signal line, which is a simple moving average of the RSI. Significant RSI highs and lows are located with a frac
Enigmera
Ivan Stefanov
5 (9)
ENIGMERA : Le cœur du marché Important : La démo de MQL5.com fonctionne dans le Strategy Tester et peut ne pas refléter pleinement les fonctionnalités d'Enigmera. Consultez la description, les captures d'écran et la vidéo pour plus de détails. N'hésitez pas à m'envoyer un message si vous avez des questions ! Le code de l'indicateur a été entièrement réécrit. La version 3.0 ajoute de nouvelles fonctionnalités et corrige les bugs accumulés depuis le lancement de l'indicateur. Introduction Cet in
Sense
Ivan Stefanov
5 (2)
SENSE est un système automatisé qui combine des méthodes GANN sélectionnées avec des calculs fractals. Le système nous indique où ouvrir et fermer les transactions. Plus besoin de perdre du temps avec des calculs complexes - SENSE fait tout pour vous. Il suffit d'installer l'indicateur. Principes de base : Le marché est haussier lorsque le prix se situe au-dessus des lignes blanches. Acheter au-dessus des lignes blanches, s'arrêter en dessous Les lignes vertes sont des objectifs de hausse L
Two Snakes
Ivan Stefanov
5 (1)
2 SNAKES est un système de scalping de première classe. Comme les entrées sont très précises, il est probable que vous deviendrez rapidement accro à ce système.  Vous avez 2 serpents. Lorsque vous voyez une bougie au-dessus ou au-dessous d'eux qui ne les touche pas - c'est votre signal de scalping. Si vous utilisez un cadre temporel plus large, le scalping peut devenir un suivi de tendance. Les serpents sont calculés précisément en fonction de l'état actuel du marché. Ils NE SONT PAS des
GANN Master
Ivan Stefanov
5 (1)
GANN Master trace les niveaux en racine carrée de W. D. Gann pour le jour, la semaine ou le mois en cours et marque les zones où les objectifs des acheteurs et des vendeurs se rejoignent. Les niveaux sont calculés à partir du plus haut et du plus bas de la période précédente, ils restent fixes pendant toute la période et ils ne se redessinent pas. Comment les niveaux sont construits Le plus haut de la période précédente devient la ligne TOP et son plus bas devient la ligne BOTTOM. À partir de TO
Fifty Pro
Ivan Stefanov
5 (1)
L'indicateur FIFTY est désormais disponible en version automatisée, éliminant le besoin de tracer manuellement les niveaux. Cette version affiche automatiquement les niveaux quotidiens, hebdomadaires, mensuels et annuels sur le graphique, garantissant une grande précision et un gain de temps. De plus, des boutons permettent d’activer ou de désactiver la visibilité de ces niveaux, offrant une personnalisation complète. Pour ceux qui le souhaitent, la version gratuite de l’indicateur reste disponi
L’un des rares indicateurs qui calcule les niveaux uniquement en fonction du prix. Il n’est pas affecté par les unités de temps, les tendances ou les cycles de marché. L’un des indicateurs les plus logiques jamais créés. L’indicateur FIFTY est désormais disponible en version automatisée, supprimant le besoin de tracer manuellement les niveaux. Cette version affiche automatiquement les niveaux journaliers, hebdomadaires, mensuels et annuels sur le graphique, garantissant précision et gain de temp
SPEKULATOR est un système de trading manuel et un indicateur qui vous aide à identifier les zones clés de support et la direction du marché. Maîtrisez le marché avec une stratégie simple et une sagesse cachée. Vous choisissez n'importe quel sommet (TOP) et bas (BOTTOM) sur le graphique, et l'indicateur trace : Une zone de support pour votre tendance. Pour une tendance haussière, une zone verte apparaît ; pour une tendance baissière, une zone rouge. La sensibilité de la zone de support peut être
Naturu
Ivan Stefanov
5 (1)
« “Naturu” est un indicateur manuel qui utilise la symétrie de la nature comme algorithme. Dominez le marché grâce à une stratégie simple et à une sagesse cachée ! Lorsque vous chargez l’indicateur, deux lignes apparaissent — Haut (Top) et Bas (Bottom). Cliquez une fois sur une ligne pour l’activer. Pour la déplacer, cliquez simplement sur la bougie où vous souhaitez la placer. Vous définissez un point haut et un point bas, et l’indicateur calcule automatiquement : une zone magenta montrant l’en
Chart AI Assistant – analyse par IA de votre graphique en direct, en un clic L'IA regarde l'image de votre graphique comme vous la regardez. Elle voit les chandeliers, les niveaux et les indicateurs sur votre écran, les lit et vous dit ce qui se passe. Chart AI Assistant analyse votre graphique comme le ferait un trader expérimenté et vous dit ce qu'il voit : structure, zones, liquidité, figures, volume et le mouvement probable à venir. Il fonctionne sur n'importe quel symbole et n'importe quel
Gann Gold Scalp Gann Gold Scalp est un indicateur de scalping sur l'or pour MetaTrader 5 qui montre où ouvrir, où prendre le profit et où se trouve le stop loss, sur les niveaux de Gann du jour, de la semaine et du mois. Des signaux BUY et SELL clairs, deux entrées, TARGET 1 et TARGET 2, le STOP, des alertes sur le graphique et des notifications push. Pas de repaint. Conçu pour XAUUSD en M5, et il fonctionne de la même façon sur le forex, les indices, les actions et les cryptos comme le Bitcoin,
Filtrer:
John
133
John 2026.07.06 23:06 

love this developer .. friendly and engaging and very active on his telegram channel .. as for the indicator, its awesome add kama for an extra 50 bucks, and its a weapon

Ivan Stefanov
9600
Réponse du développeur Ivan Stefanov 2026.07.07 07:36
Thank you very much for the good words!
zeke21t2
813
zeke21t2 2026.02.15 13:00 

This is an amazing indicator that gives you a quick glimpse into the big picture, the most important aspect of trading: whether you should wait for a buying opportunity, a selling opportunity, or wait for the market to settle down. Simply avoiding false breakouts will dramatically improve your trading performance. For specific buying and selling opportunities, I highly recommend using it in conjunction with Meravith, another of the author's outstanding works. Pullback reversals and reversals from the top or bottom, which are entered based on chart highs and lows or volume changes, will become more effective. Honestly, I recommend this so much that I don't want anyone else to know about it :)

Ivan Stefanov
9600
Réponse du développeur Ivan Stefanov 2026.07.07 07:39
Thank you so much for the feedback — I truly appreciate it.
As the author of this indicator, my goal has always been to give traders a clear, reliable view of the market’s real direction and help them avoid unnecessary losses caused by false breakouts. I’m glad to hear it’s doing exactly that for you. Meravith is indeed a great companion tool, especially for timing precise entries during pullbacks or reversals. When used together, both indicators complement each other and make decision‑making much more straightforward. Your support means a lot — and your last sentence made me smile. I’m really glad you find it valuable.
Max2233
807
Max2233 2025.07.08 10:33 

I would like to compliment this work of art composed by IVAN, a very precise indicator and in combination with his other jewels created by him, trading has simply become simpler and more intuitive. A round of applause to IVAN.

Ivan Stefanov
9600
Réponse du développeur Ivan Stefanov 2026.07.07 07:39
Thank you sincerely for your words — they mean a lot.
I’m truly glad to hear that my work helps make your trading simpler, clearer, and more intuitive. Every indicator I create is designed to complement the others, so hearing that the combination works so well for you is incredibly rewarding. Your appreciation and support are genuinely motivating.
Thank you for the applause — it’s received with gratitude.
Mase
1799
Mase 2025.05.29 14:17 

Simply perfect! In combination with Ivan's other technical indicators, it is a powerful tool. Warning: highly addictive, as the indicators bring so much joy and success. Highly recommended.

Ivan Stefanov
9600
Réponse du développeur Ivan Stefanov 2026.07.07 07:40
Thank you so much for your kind words — I truly appreciate it.
I’m really glad to hear that the indicators work powerfully together and bring both clarity and enjoyment to your trading. Creating tools that make the process intuitive and effective has always been my goal, so feedback like yours means a lot. And your “warning” made me smile — I’ll take that as a compliment.
Thank you for the recommendation and for the support.
Répondre à l'avis