Gravity Force
- Indicators
-
Salman A A A T Bakhash
 Accurate, Careful, Precise, Straightforward, Fast learner, Patient, Calm, Ambitious, Efficient and so on.
 - Version: 3.0
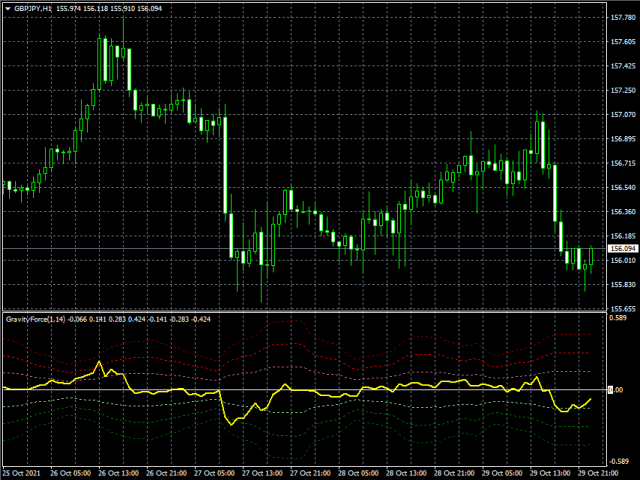
Description:
This indicator measures how far the price is away from Moving Average or multiple Moving Averages (from Lowest MA Period to Highest MA Period). also you can apply weighted factor that increase / decrease from lowest MA to highest MA period.
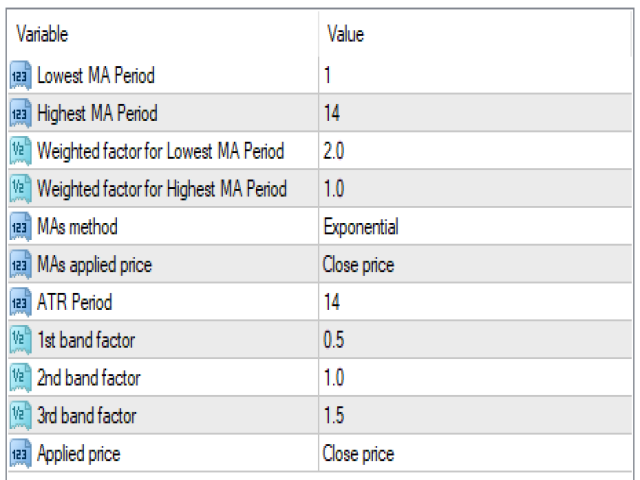
Inputs:
- Lowest MA Period
- Highest MA Period
- Weighted factor for Lowest MA Period
- Weighted factor for Highest MA Period
- MAs method
- MAs applied price
- ATR Period
- 1st band factor
- 2nd band factor
- 3rd band factor
- indicator Applied price