Super Matrix for EURUSD
- Indicators
- GEORGIOS VERGAKIS
- Version: 1.0
- Activations: 12
WARNING: This indicator is powerful, very high probability, not based on publically available algorithms. It's a matrix of 10 different entries, from 10 other pairs, determined by a machine learning algorithm and wave analysis (Fourier Series) over 2 years. it can detect major buy and sell signals, as well as trendless, narrow range, hours on the 30minute and H1 chart (for scalping strategies during the usually trendless Asian session), scalping breakout risk is eliminated. It tells you if EURUSD is OB, OS or neutral and more patterns.
It is for experienced traders only, as new traders lack focus, psychology and adaptation skills. It's down to you to develop a quick strategy based on the patterns illustrated by the indicator, and on the basic tips we provide. Traders with less than 5 years of experience don't really have these skills. We specifically see that new traders with small accounts tend to get carried away, trading too big a size, without proper money management. This is dangerous, especially on weekly signals, the market will very likely go in the direction of the signal, but the early countermovement is often intimidating.
On the other hand traders with little experience, big trading accounts, who follow basic discipline, can still use this indicator.
Our IM Matrix is signal is based on this indicator, we watch all signals on daily, weekly and monthly, some signals on the weekly and monthly show up for only one day, you won't see them in the charts again. Trading is still messy, but a lot of stress and uncertainty is removed, we know how far that open losing trade will go. We also use little swing trading theory, and avoid preholiday days.
This indicator, together with our basic training, helps remove a huge portion of stress from your trading, like no other indicator, by watching the market just once per day!
You can determine right away where to place stops, and whether or not to hold that open losing trade you worry about. That losing trade may or may not be in the direction of the underlying trend.
For experienced, well funded traders, this indicator can be incredibly profitable, assume trading at $10 per pip, it can make $100s every other day, plus one good weekly trade. Realistic assessment is that one can trade from $10K to well over $100K in one year. Of course one has to devote some time at midnight, to get the signals early. The core algorithm in this indicator took years to develop, and it looks at deep intermarket patterns.
This is an extension to our previous EURUSD IM Matrix, which gets data from 10 diferent forex pairs, and attempts to figure out buy and sell signals specifically for the next preiod, usually the next day. After a lot of research we found that this version of the algorithm is extremely accurate on the daily chart, it is accurate on other time frames too, but more so on the daily.
This matrix is extremely powerful and insightful, and worth a lot to traders with $10K+ accounts, so much that it can make the rental cost in a single day!
Moreover, basic training is provided to clients, so they can make the best of the indicator.
Forget all about classic indicators, it's possible to trade the markets, EURUSD or related, using this indicator alone!
There's no need for MACD, trendlines, Fibonacci and all these ridiculous tools, which in hindsight make the analysis of the gurus look right, no matter what the market does...
Moreover, this algorithm is an entire program still in development, clients can ask for modififications so as to have automated alerts and add-ons.
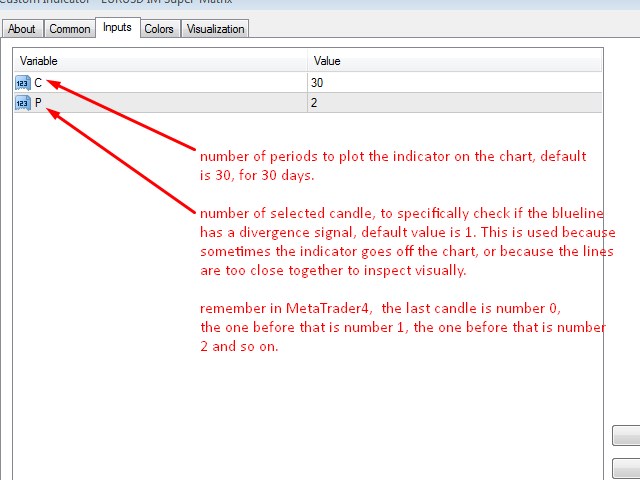
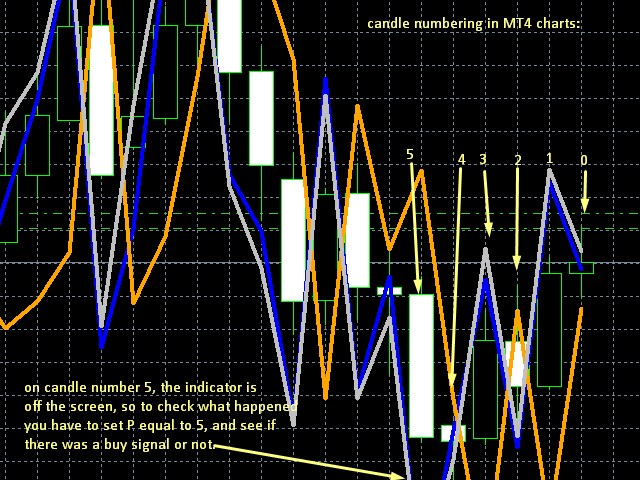
The number of the candle selected can be changed by the user, so as to check any previous candle which sometimes is not possible to inspect visually.
Basic training tips:
Beware of holidays, watch the US holiday calendar, markets tend to trade nonsensically on the days leading up to 3 day weekends, days just before Easter, and past the 15th of December each year. After the holidays markets resume their previous trends.
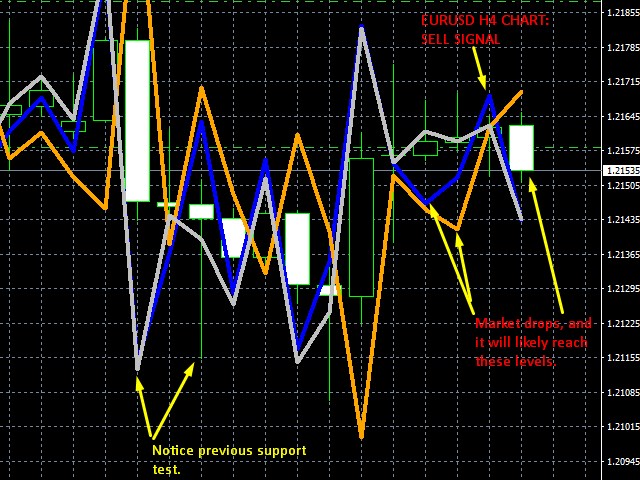
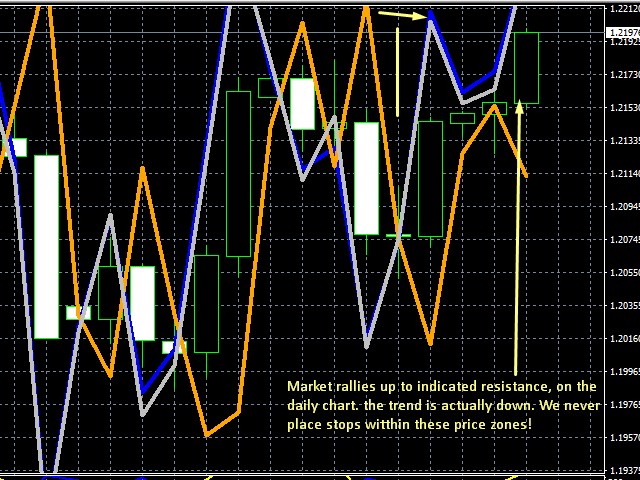
Ideal signals occur when all 3 lines are somewhat spaced apart from each other
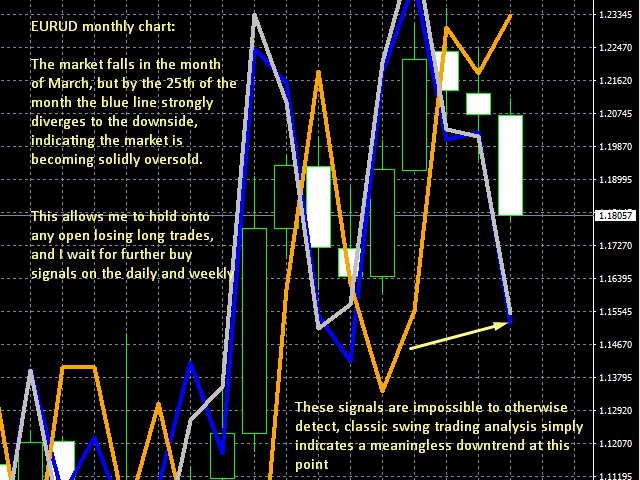
On the weekly chart there are many signals, some show up for few days or hours then disappear, when looking back in time you only see signals near the close.
EURUSD, intermarket indicator, market risk analysis, machine learning derived, lock algorithm