FE Fibo Expansion

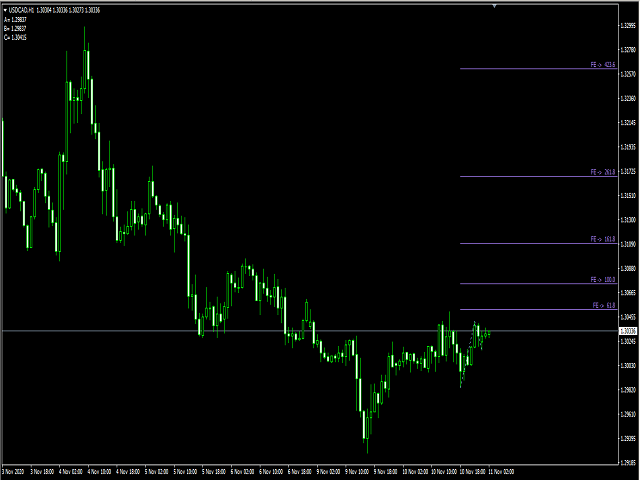
This is Fibo Expansion.

You can use it, as profit target at any level...

It use price Highs and Lows and price between...

It is simple and easy to use...

No Input menu, just drag it on your chart and it ready to use...

The blue and red dot color indicate it direction...

It also use as the same as fractal high and low price as the points to construct the levels...

No more analysis to choose the points..

推荐产品
UPD1 Fibo Levels
Vitaliy Kuznetsov
5 (3)
该指标分析指定数量的蜡烛并根据高低绘制斐波那契水平。 由于级别正在重新排列,我们对范围的右侧感兴趣。 价格会吸引水平并对触摸做出反应。 使用此工具在修正后找到趋势入口点。 如果在左边我们看到水平已经完美上升,那么我们可以假设我们已经在极值点找到了运动的终点。 所有线条都通过缓冲区或对象绘制(可选)。 输入参数 。 Bars Count - 计算范围 。 Visual Button - 按钮显示(启用/禁用) 。 Corner - 按钮锚定角度 。 X indent - 以像素为单位的水平填充 。 Y indent - 以像素为单位的垂直填充 。 Label Visual - 显示级别标签 。 Label Font Size   - 字体大小 。 Label Shift Bars   - 在酒吧的铭文的缩进 。 Label Tooltip   - 在关卡上方的光标下显示文本 。 Draw Lines   -  使用缓冲区或对象绘制 。 Box Visual   - 启用/禁用框视觉 。 Box Width   - 箱线粗细 。 Box Style   - 框线样式  。 Le
FREE
This indicator is based on Mr. Mark Fisher's ACD strategy, based on the book "The Logical Trader." - OR lines - A lines - C lines - Daily pivot range - N days pivot range - Customizable trading session - Drawing OR with the desired time Drawing levels A and C based on daily ATR or constant number - Possibility to display daily and last day pivots in color zone - Displaying the status of daily PMAs (layer 4) in the corner of the chart - Show the order of daily pivot placement with multi-day pi
FREE
The   Pivot Point indicator   automatically calculates and displays the pivot point line and support and resistance levels. Pivot can be calculated according to the Classic, Floor, Fibonacci, Woodie, Camarilla or DeMark formula. It is also possible to select the period for calculating the indicator. A trader can choose from daily, weekly, monthly, or user-defined periods. Types of pivots Classic Floor Fibonacci Woodie Camarilla DeMark Main features The indicator shows the current and historic
FREE
MP Demark Pivot Levels
Pierre Ksachikian
4 (1)
This indicator is stand alone version from  MP Pivot Levels  (All in one) containing Demark's Pivots. Calculations:     PP = X / 4     R1 = X / 2 - LOWprev     S1 = X / 2 - HIGHprev Uses: When the pair currency price may change the direction of movement. Possible constraints of support and resistance that creates plateaus for the currency pair prices. Tendency identification by comparing the present prices according to current day's pivot point and also the prior day's pivot points. ____________
FREE
Squeeze Indicator
Federico Quintieri
The one and only indicator that identifies Volatility Squeeze. A Squeeze is a compression of volatility in the market. If this compression of volatility reaches a certain percentage it means that the market could explode in moments. I highly recommend using the indicator in conjunction with the economic calendar. If there are important news and the indicator shows a  BLUE HISTOGRAM  on the exchange in question, a sign of a powerful compression of volatility. Then get ready to grasp the next
FREE
This is just a simple indicator that show Alert when the Current candle Close Above the Trendline. Previous candle do not affect the Alert.  The indicator is tied to the Trendline so if the Trendline is accidentally deleted, the Alert will not work. The indicator will draw another Trendline if the current Trendline is deleted.  Removing the indicator will removed the Trendline. There are 4 type of Alert to set: Popup Alert, Signal Alert, Push Notification, Comment.
FREE
Convenient drawing of parabolic channels by four points (two lower and two upper extremums). Additional control keys: N (New) - Start drawing a new channel. C (Clear) - Deletes the current channel. By default, the current channel is the last channel. But you can click on the line of any channel to make it current. Click on the gear in the upper right corner to set some parameters for all channels or the current channel. All work is visible from the animated Gif. Channels are saved when the time
FREE
ENGLISH DESCRIPTION (MQL5 Standard Optimized) Product Name: TempestLightning – Elliott Wave Pro (MT4) [Subtitle: ZigZag Wave 3 Hunter | Market Health Monitor | USD Risk Logic] Introduction TempestLightning is a professional trading system designed to automate the complex Elliott Wave theory. Instead of guessing wave counts, this EA uses a precision ZigZag algorithm to identify the classic 1-2-3 structure and targets the highly profitable Wave 3 impulse. Stacked with a multi-factor filter engine
FREE
-- 简单而有效。 反转指标 - 是什么? 一种结合超级趋势逻辑与指数曲线技术的趋势跟随叠加指标。它能识别趋势方向,在图表上绘制动态通道,并在趋势反转时发送实时警报。 工作原理 该指标通过ATR与超级趋势因子计算指数基准线。当价格收盘突破该基准线时,确认趋势反转。绿色箭头标记买入趋势启动,红色箭头标记卖出趋势启动。 功能特性: 基于ATR的指数趋势基准线与动态通道 绿色/红色趋势线及填充通道 趋势反转时的买入/卖出箭头信号 内置警报:弹窗、推送通知、邮件、声音 重复警报防护(每根K线仅触发一次警报) 完全可定制:颜色、线条粗细、箭头尺寸、通道宽度 无延迟的简洁图表叠加层 输入参数: 指数速率、超级趋势因子、ATR周期、通道宽度 开关控制:通道填充、箭头、各警报类型 所有视觉元素支持全色系定制 最佳适用场景:任意品种、任意周期。适用于外汇、指数、大宗商品及加密货币图表。
FREE
MQLTA Support Resistance Lines is an indicator that calculates the historical levels of Support and Resistance and display them as Lines on chart. It will also Alert you if the price is in a Safe or Dangerous zone to trade and show you the distance to the next level. The indicator is ideal to be used in other Expert Advisor through the iCustom function. This DEMO only works with AUDNZD, the full product can be found at https://www.mql5.com/en/market/product/26328 How does it work? The indicator
FREE
pivot points using by many traders and pivot levels most of the times are very helpfull . this indicator is a custom with internal parameters. it can show two times pivot (weekly and daily). you can choose periods total for each time showing pivots.( 1 week , 2 week ,...1day , 2day ,...) when use weekly and daily pivots , it can show you many support and resistance zones. if have proposal comment too me for upgrading indicator.
FREE
Pivot Classic, Woodie, Camarilla, Fibonacci and Demark Floor/Classic Pivot points, or simply pivots, are useful for identifying potential support/resistance levels, trading ranges, trend reversals, and market sentiment by examining an asset's high, low, and closing values. The Floor/Classic Pivot Points can be calculated as follows. Pivot Point (P) = (High + Low + Close)/3 S1 = P * 2 - High S2 = P - (High - Low) S3 = Low – 2*(High - P) R1 = P * 2 - Low R2 = P + (High - Low) R3 = High + 2*(P - L
FREE
Clever Trend Swing Levels
Carlos Forero
4.22 (9)
描述: 该指标通过之字形指标衡量趋势或修正水平。 它在图表中显示了检测到的每个低或高电平。 该指标有何用处? 该指标根据之字形参数确定趋势是开始,发展还是结束 该指标确定趋势的方向 组件 水平为正数或负数,取决于趋势的方向和回撤的数量。 其他建议指标 CEF计数水平旨在通过以下指标来工作和补充其信号: 一般指标 选择最佳货币进行交易(CEF点差货币点差) 趋势指标 确定趋势级别(CEF计数级别)(实际指标) 确定趋势强度(CEF趋势力) 信号工具 完整的策略信号指示器(CEF Scalper Pro) 查找订单块模式(CEF订单块信号) 查找市场市场格局(CEF TDI Pro信号) 其他非常有用的工具 确定范围扩展或收缩的概率(CEF范围预测器)
FREE
The SFT Fibo Smart Pivot indicator is a powerful trading tool based on the Fibonacci Golden Ratio, designed to identify key support and resistance levels in the forex market. This indicator has the ability to pinpoint significant price levels that can serve as entry and exit points for trades. It enables traders to analyze the market more effectively and make well-informed decisions. The indicator uses the Fibonacci Golden Ratio to accurately determine support and resistance levels. These levels
FREE
SRP (Strong Retracement/Reversal Points) is a powerful and unique support and resistance indicator. It displays the closest important levels which we expect the price retracement/reversal! If all level are broken from one side, it recalculates and draws new support and resistance levels, so the levels might be valid for several days depending on the market! Key Features You can use it in all time-frames smaller than daily! Displays closest significant support and resistance levels Update the le
FREE
AC Pivot Panel – Your Ultimate Pivot Trading Tool The   AC Pivot Panel   is a powerful yet user-friendly pivot point indicator designed to help traders identify key support and resistance levels with ease. Whether you’re a beginner or an experienced trader, this indicator simplifies pivot trading and enhances your decision-making process. Key Features : Interactive Selection Panel : Easily adjust pivot settings directly on the chart with a compact and intuitive panel. Multiple Pivot Methods : C
FREE
Forex trading support timer: - This is an indicator that supports a trader's trading process. - Before placing a BUY or SELL order, it is advisable to observe what the current time is like, to get the best position when trading. Function of indicator: - Display information about candle closing time of different timeframes (M1,M5,M15,H1), best used when Scalping. - Show market spreads. - Show TimeZone Trading. - Displays the remaining time of a session.
FREE
Wa Candle Timer MT4
Wachinou Lionnel Pyrrhus Sovi Guidi
5 (1)
Wa Candle Timer MT4 是一款强大且用户友好的指标,用于在 MT4 图表中显示当前蜡烛结束前的剩余时间。它帮助交易者把握蜡烛的关闭时间,以便更好地进行交易和决策。该工具现已更新,加入了用户自定义的百分比提醒功能,让交易更高效。 主要功能:   显示当前蜡烛的倒计时   剩余时间低于设置百分比时更改颜色   v3.00 新增:倒计时达到指定百分比时触发提醒   字体和颜色完全可自定义   提升交易中的时间管理和精准度   可自定义设置:   1️⃣ 高于阈值的颜色   2️⃣ 低于阈值的颜色   3️⃣ 字体大小   4️⃣ 字体样式   5️⃣ 提醒触发百分比(例如:80%、95% 等) 该指标适合所有依赖于蜡烛时间控制的交易者,帮助您把握每一个关键时机。
FREE
Grapic ByArrowTrend Pro
Truong Cong Truc
1 (1)
Indicator support for only: Entry Point to Trend Pro Link indicator  support   :   https://www.mql5.com/en/market/product/70867 Supports all currency pairs declared in the definition. Help investors do not need to open many charts. Notice the DEAL:  multiple time frames confluence   M15, H1, H4. Entry Point to Trend Pro The indicator helps investors to identify the earliest and perfect reversal point. Easy to make decision to trade with the trend   Price action trading. support resistance an
FREE
SR indicator
Alexander Chertnik
5 (2)
SR is a support and resistance indicator, it shows major highs and lows by different colors. The color of a level is changing if the last high or low are touching it. After the closing of a bar above or below level, it will delete it. extern inputs: loop for candles / colors / drawing time *This indicator signal is not perfect and have to be used with other market analysis and confirmations.
FREE
BeST_ Classic Pivot Points is an MT4 Indicator that is based on the widely known and definitely classic Pivot Point of a market prices activity. A pivot point is calculated as an average of significant prices (high,low,close) from the performance of a market in the prior trading period. If the market in the following period trades above the pivot point it is usually evaluated as a bullish sentiment, whereas trading below the pivot point is seen as bearish. A pivot point and the associated suppo
FREE
Shows Kaufman Efficiency Ratio value and smoothed by MA. Calculation is based on movement divided by volatility on a specified period. Levels are adjustable as well as visualization. Parameters: KERPeriod - period for ratio calculation. EMAPeriod - period for moving average. Shift - indicator shift. HigherLevel - low value of the higher zone. LowerLevel - high value of the lower zone. ShowHigherZone - allow higher zone drawing. HigherZoneColor - higher zone color. ShowLowerZone - allow lower zon
FREE
This indicators automatically draws the Support and resistances levels for you once you've dropped it on a chart.  It reduces the hustle of drawing and redrawing these levels every time you analysis prices on a chart. With it, all you have to do is dropped it on a chart, adjust the settings to your liking and let the indicator do the rest.  But wait, it gets better; the indicator is absolutely free!  Get the new and improved version here:  https://youtu.be/rTxbPOBu3nY Parameters Time-frame  -> T
FREE
.................................if you need pivot point s levels............................... ............................this is a daily pivot point level creator........................... ...it is for daily pivots and show levels at times period H4 , H1 , M30 , M15 ,M 5... .................................also shows levels for 3 last days.............................. ................can use it with other indicators and see important levels...............
FREE
Awesome Pivot Indicator
Komang Putra Riswanjaya
The Pivot Indicator is a vital tool for technical analysis used by traders in the financial markets. Designed to assist in identifying potential reversal points or trend changes, this indicator provides valuable insights into key levels in the market. Key features of the Pivot Indicator include: Automatic Calculations: The Pivot Indicator automatically calculates Pivot Point, Support, and Resistance levels based on the previous period's high, low, and close prices. This eliminates the complexity
FREE
Ava Ffx Signal
Nirundorn Promphao
The principle of this indicator is very simple: detecting the candlestick pattern in H1 timeframe, then monitoring the return point of graph by using the pullback of High-Low of H1 Candlestick and finally predicting BUY and SELL signal with arrows, alerts and notifications. The parameters are fixed and automatically calculated on each time frame. Example: If you install indicator on XAUUSD, timeframe H1: the indicator will detect the reversal, pullback, price action on this timeframe (for exam
FREE
Free automatic fibonacci
Tonny Obare
4.67 (49)
Free automatic Fibonacci is an indicator that automatically plots a Fibonacci retracement based on the number of bars you select on the BarsToScan setting in the indicator. The Fibonacci is automatically updated in real time as new highest and lowest values appears amongst the selected bars. You can select which level values to be displayed in the indicator settings. You can also select the color of the levels thus enabling the trader to be able to attach the indicator several times with differe
FREE
Chart High Low Levels
Igor Pereira Calil
The Chart High Low Indicator is an indicator for META TRADER 4, with the function of analyzing and showing the weekly MAXIMUM, weekly MINIMUM, monthly MAXIMUM and monthly MINIMUM levels. This can help a lot when creating TrendLine or even plotting your FIBONNACI line, as there is no need to access Internet sites to analyze the MAXIMUM/MINIMUM levels. In graphical analysis, it can assist in breaking HIGH/MIN levels, creating support and resistance breakOuts. There are "mark" functions on the in
FREE
Trend Rising SDEA MT4
Wan Mohd Safwan Bin Wan Daud
Trend Rising 是自定義 MT4 (Metatrader 4) 指標,最適合剝頭皮 TF M30 及以下,使用基於多個時間框架的 Bill William 指標分析趨勢和動量模式。結果,它確定了適用於大多數貨幣對的趨勢的開始和結束。 Trend Rising 指標是基於 Accelerator Oscillator 和 Awesome Indicator 開發的。 主要特徵  用顏色顯示趨勢的開始和結束。  使用 base-TF H1 輕鬆識別趨勢強度(強牛市和熊市)。 識別市場調整。 (當前圖表的弱勢和可能的逆轉)  當建議的條目發佈時,在圖表上繪製 SL 級別。  獲取圖表中發生的每一次趨勢變化的警報。 趨勢上升的優勢  使用所有貨幣對(外匯、加密貨幣、指數和商品) 使用所有時間範圍。 (推薦時段:M30及以下TF) 警報生成器。 (彈出警報、推送通知警報等) 未重新粉刷  100% 免費指標 接觸 如果您有任何疑問或需要幫助,請通過私信與我聯繫。 作者 Safwan Daud,馬來西亞貿易分析師。青年商品交易員(YCT)創始人
FREE
MQLTA Support Resistance Lines
MQL4 Trading Automation
4.33 (12)
MQLTA Support Resistance Lines is an indicator that calculates the historical levels of Support and Resistance and display them as Lines on chart. It will also Alert you if the price is in a Safe or Dangerous zone to trade and show you the distance to the next level. The indicator is ideal to be used in other Expert Advisor through the iCustom function. This indicator can be tested LIVE on AUDNZD with the following DEMO https://www.mql5.com/en/market/product/26572 How does it work? The indicato
FREE
该产品的买家也购买
Gann Made Easy
Oleg Rodin
4.83 (162)
Gann Made Easy 是一个专业且易于使用的外汇交易系统,它基于使用先生理论的最佳交易原则。 W.D.江恩。该指标提供准确的买入和卖出信号,包括止损和获利水平。您甚至可以使用推送通知在旅途中进行交易。 购买后请联系我,即可免费获得交易指导和超棒的额外指标! 您可能已经多次听说过江恩交易方法。通常 Gann 的理论不仅对于新手交易者而且对于那些已经有一定交易经验的人来说都是非常复杂的东西。这是因为江恩的交易方法在理论上并不那么容易应用。我花了几年时间来完善这些知识,并将最好的原则应用到我的外汇指标中。 该指标非常易于应用。您所需要的只是将其附加到您的图表并遵循简单的交易建议。该指标不断进行市场分析工作并寻找交易机会。当它检测到一个好的入口点时,它会为您提供一个箭头信号。该指标还显示止损和获利水平。 换句话说,当您像先生一样进行交易时,该指标会为您提供最佳江恩建议。江恩亲自告诉你此时此刻该做什么。但最好的部分是您不需要了解任何有关江恩交易原则的知识,因为该指标会为您完成整个市场分析工作。
M1 Sniper
Oleg Rodin
5 (22)
M1 SNIPER 是一款易于使用的交易指标系统。它是一个专为 M1 时间框架设计的箭头指标。该指标可以作为独立的系统在 M1 时间框架下进行剥头皮交易,也可以作为您现有交易系统的一部分使用。虽然该交易系统专为 M1 时间框架交易而设计,但它也可以用于其他时间框架。我最初设计此方法是为了交易 XAUUSD 和 BTCUSD。但我发现这种方法在其他市场交易中也同样有用。 指标信号既可以顺势交易,也可以逆势交易。我教授一种特殊的交易技巧,帮助您利用指标信号进行双向交易。该方法基于使用特殊的动态支撑位和阻力位区域。 购买后,您可以立即下载 M1 SNIPER 箭头指标。此外,我还为所有 M1 SNIPER 工具用户免费提供下方屏幕截图所示的 Apollo Dynamic SR 指标!这两个指标的组合可以帮助您更轻松、更准确地利用 M1 时间框架进行交易。 购买后请联系我,免费获取交易提示和奖励指标! 祝您交易成功!
PRO Renko System
Oleg Rodin
5 (30)
PRO Renko Arrow Based System for trading renko charts.  准确的信号交易任何外汇工具. 另外,我将免费提供系统的附加模块! PRO Renko系统是RENKO图表上高度准确的交易系统。该系统是通用的。 该交易系统可应用于各种交易工具。 该系统有效地中和了所谓的市场噪音,打开了获得准确反转信号的通道。 该指标易于使用,只有一个参数负责产生信号。 您可以很容易地使算法适应您感兴趣的交易工具和renko酒吧的大小。 我很乐意通过提供任何咨询支持来帮助所有客户有效地使用该指标。 祝您交易成功!购买后,立即写信给我! 我将与您分享我的建议和我的renko发电机。 另外,我将免费提供系统的附加模块!
Market Makers
Mohamed Hassan
5 (3)
After purchase, contact me privately to receive 1 month of free testing with EA Forex Proton! This advanced MT4 trading robot automatically executes signals from any MT4 indicator, including Market Makers. The latest version also includes AI integration, allowing each trade signal to be analyzed using Artificial Intelligence. Live Signal with EA Forex Proton: Click here Market Makers is a powerful price action trading system designed to identify high-probability Buy and Sell opportunities based
Trend Screener
STE S.S.COMPANY
4.79 (95)
趋势指标,趋势交易和过滤的突破性独特解决方案,所有重要趋势功能都内置在一个工具中! 它是 100% 非重绘多时间框架和多货币指标,可用于所有符号/工具:外汇、商品、加密货币、指数、股票。 限时优惠:支撑和阻力筛选指标仅售 65美元,终身有效。(原价 250 美元)(优惠延长) 趋势筛选器是有效的指标趋势跟踪指标,它在图表中提供带有点的箭头趋势信号。 趋势分析器指标中可用的功能: 1.趋势扫描仪。 2. 具有最大利润分析的趋势线。 3.趋势货币强度计。 4. 带有警报的趋势反转点。 5. 带有警报的强趋势点。 6. 趋势箭头 每日分析示例,每日信号表现...等与我们的趋势筛选指标,可以在这里找到: 点击这里 限时优惠:Trend Screener Indicator 仅售 150 美元且终身可用。原价 199$) 通过访问我们的 MQL5 博客,您可以找到我们所有的高级指标以及分析示例、每日信号表现...等。 : 点击这里 我们的趋势系统由 2 个指标组成: 1. Trend Screener Indicator:显示趋势仪表盘、图表中的趋势线、入场点...等。 2. Trend
GoldRush Trend Arrow Signal
Kirk Lee Holloway
5 (2)
GoldRush 趨勢箭頭信號 GoldRush 趨勢箭頭信號 指標為 XAU/USD 中的高速、短期短線交易者提供精確、實時的趨勢分析。 專為1分鐘時間框架設計,此工具顯示方向箭頭以明確顯示入場點,使短線交易者能在波動市場中自信操作。 該指標包含主要和次要警示箭頭。主要信號為白色和黑色方向箭頭,用於指示趨勢方向的轉變;次要信號為藍色和紅色箭頭,用於確認主要箭頭指示的方向並提示潛在交易入場點。 注意:當趨勢方向發生變化後僅出現一個主要警報箭頭時,請注意可能會出現多個次要藍/紅箭頭。次要信號將在滿足信號標準的任何蠟燭圖後出現,因此在長期趨勢移動中,螢幕上將顯示大量次要箭頭(如附帶的截圖所示)。您可在設置中開啟或關閉任一箭頭類型。 以下是我使用此指標進行交易的方式: - 對於買入入場,我會耐心等待白箭頭在蠟燭收盤時出現,並在下一根可用蠟燭收盤時出現藍箭頭時進行買入交易。 - 對於賣出入場,我會耐心等待黑箭頭在蠟燭收盤時出現,並在下一根可用蠟燭收盤時出現紅箭頭時進行賣出交易。 - 獲利了結/止損設置由使用者自行負責,但我個人使用最低R:R為1:2,並發現這在倫敦/紐約開盤等
NAM Divergences
NAM TECH GROUP, CORP.
5 (1)
MT4多時限發散和超買/超賣檢測指標。 特徵 -在圖表控制面板上完全可自定義,提供完整的交互。 -隨時隨地隱藏和顯示控制面板。 -有關非大寫差異的實時信息。 -有關超買/超賣情況的實時信息。 -有關規則差異的實時信息。 -有關隱藏分歧的實時信息。 -可用於發散檢測的振盪器:AO,RSI,CCI,MACD,STOCH,RMI,TDI,RSIOMA。 -通知服務(屏幕警報|推送通知)。 概括 使用差異交易有助於發現趨勢減弱或勢頭逆轉。有時,您甚至可以將其用作趨勢持續的信號。我們的工具在一個非常舒適和直觀的控制面板中同時提供所有時間範圍的差異檢測,並具有顯示和隱藏的可能性,以使您的圖表盡可能保持清潔。 您會在選擇的歷史時期實時看到超買和超賣情況,定期背離,隱藏背離和無資本背離。 對於沒有大寫字母的差異,我們會在屏幕上顯示MT4通知,並將通知推送到您的手機!
Super Signal – Skyblade Edition 專業級無重繪 / 無延遲趨勢信號系統,擁有卓越勝率 | 適用於 MT4 / MT5 在較低的時間週期上效果最佳,例如 1 分鐘、5 分鐘與 15 分鐘圖表。 核心特色: Super Signal – Skyblade Edition 是一套專為趨勢交易設計的智能信號系統。 其採用多重濾波邏輯,僅篩選出具有明確方向性、動能強勁且波動結構健康的走勢進場點。 本系統 不預測高點或低點 ,只有在同時滿足以下三項條件時才會觸發交易信號: 趨勢方向明確 動能持續增強 波動率結構穩定 此外,系統還結合市場流動性分析,以進一步提升信號的準確性與觸發時機。 信號特性: 所有箭頭信號皆為 100% 無重繪,無延遲 信號一旦出現即固定於圖表,不會閃爍或消失 提供圖表箭頭、資訊面板、彈出通知、聲音提示及推播訊息 支援 EA 呼叫(Buffer 輸出),可整合至自動化交易或信號跟單系統 提供預設參數模板,免調整即可使用,適合新手快速上手 總結: Super Signal – Skyblade Edition 是一款邏輯清晰、穩定高效的專業趨勢型
Advanced Supply Demand
Bernhard Schweigert
4.91 (299)
现在优惠 40%! 任何新手或专业交易者的最佳解决方案! 该指标是一款独特、高质量、且价格合理的交易工具,因为我们已经整合了许多专有功能和新公式。 依据此更新,您将能够显示双重时间帧区域。 您不仅可以显示一个较高的时间帧,还可以同时显示图表时间帧,加上更高的时间帧:显示嵌套时区。 供需双方所有交易者都会喜欢它。 :) 重要信息披露 高级供需的最大潜力,请访问 https://www.mql5.com/zh/blogs/post/720245   想象您的交易如何得以改善,是因为您能够精准定位入场或目标位吗? 构建于新的底层算法,它可以更轻松地识别出买卖双方之间的潜在失衡。 这是因为它以图形方式展示供需最强劲区域,及其过去的表现(显示旧区域)。 这些功能旨在帮助您更轻松地发现最佳入场区域和价位。 现在您可以针对您的交易品种和时间帧来优化和编辑区域强度! 高级供需指标适用于所有产品和时间帧。 它是一个新的公式,非常新的功能是两个区域强度函数可由用户输入进行调整! 这在交易中是一大优势。 当您学习如何使用专有功能,例如带有价格游离最小 X 因子的区域强度时,您能够判断该区域强劲与否。 供需
Scalper Inside PRO
Alexey Minkov
4.74 (69)
Scalper Inside PRO – Since 2020. An exclusive indicator that utilizes an innovative algorithm to swiftly and accurately determine the market trend. The indicator automatically calculates opening, closing, and profit levels, providing detailed trading statistics. With these features, you can choose the most appropriate trading instrument for the current market conditions. Additionally, you can easily integrate your own arrow indicators into Scalper Inside Pro to quickly evaluate their statistics
Dynamic Scalper System
Vitalyi Belyh
5 (1)
“ Dynamic Scalper System ”指标专为在趋势波内进行剥头皮交易而设计。 已在主要货币对和黄金上进行测试,并可与其他交易工具兼容。 提供顺势短线建仓信号,并提供额外的价格变动支持。 指标原理: 大箭头决定趋势方向。 在趋势波内,我们采用一种生成小箭头形式的剥头皮交易信号的算法。 红色箭头代表看涨方向,蓝色箭头代表看跌方向。 敏感的价格变动线会沿着趋势方向绘制,并与小箭头信号协同作用。 信号运作方式如下:当线在适当时刻出现时,将形成入场信号;在出现线时,持仓;线完成后,平仓。 建议的操作时间范围为M1 - H4。 箭头在当前K线上方形成,如果下一根K线已开仓,则不会重新绘制上一根K线上方的箭头。 输入参数 Trend Wave Period - 趋势方向(大箭头)的周期,改变趋势波的时间间隔。值 1 表示趋势方向的最长持续时间,参数值越大,持续时间越短。 Scalper Arrows Period - 信号箭头(小箭头)的计算周期,改变入场信号的生成频率。值 3 表示最频繁的生成频率,参数值越大,箭头频率越低,准确度越高。 这些参数可以根据不同的时间范
Apollo SR Master
Oleg Rodin
5 (2)
Apollo SR Master 是一款支撑/阻力指标,其特殊功能使利用支撑/阻力区域进行交易更加便捷可靠。该指标通过检测局部价格顶部和底部,实时计算支撑/阻力区域,没有任何时间延迟。为了确认新形成的支撑/阻力区域,该指标会显示特殊信号,表明该支撑/阻力区域可以作为实际的卖出或买入信号。在这种情况下,支撑/阻力区域的强度会增强,因此从该区域进行交易的成功率也会更高。这正是该指标的核心理念。 SR区域也使止损和止盈的操作更加便捷。根据信号方向,可以将SR区域上方或下方的空间用作止损位。此外,相对的SR区域也可以用作潜在的止盈区域。 我还免费向所有 Apollo SR Master 指标的用户提供我的“Apollo 价格行为系统”指标。这两个指标结合使用将帮助您找到更好的入场点。 购买后请联系我,即可免费获得我的交易技巧以及我的“阿波罗价格行为系统”指标作为赠品!
Advanced Currency Strength28 Indicator
Bernhard Schweigert
4.91 (657)
目前40%的折扣 任何新手或专家交易者的最佳解决方案! 这个指标是一个独特的、高质量的、可负担得起的交易工具,因为我们纳入了一些专有的功能和一个新的公式。只需一个图表,你就可以读出28个外汇对的货币强度!想象一下,你的交易将如何得到改善,因为你的交易是在你的手中进行的。想象一下,你的交易将如何改善,因为你能够准确地确定新趋势或剥头皮机会的触发点? 用户手册:点击这里  https://www.mql5.com/en/blogs/post/697384 这是第一本,原版的! 不要买一个毫无价值的崇拜者的克隆品。 特别的 子窗口中的箭头显示强劲的货币势头GAP将指导你的交易! 当基础货币或报价货币处于超卖/超买区域(外盘斐波那契水平)时,在个人图表的主窗口中出现警告信号。 当货币力量从外围区间回落时,回撤/反转警报。 十字星模式的特别警报 可选择多个时间框架,以快速查看趋势! 货币强度线在所有的时间框架中都非常平稳,当使用较高的时间框架来识别总体趋势,然后使用较短的时间框架来确定精确的入口时,效果非常好。你可以根据自己的意愿选择任何时间框架。每个时间框架都由其自身进行了优化。
Ultimate Sniper Dashboard
Hispraise Chinedum Abraham
4.82 (22)
折扣价为299美元! 未来可能会涨价! 请阅读下面的描述! 终极狙击手仪表盘的最佳进入系统。终极动态水平。(请查看我的产品) 由于MT4多币种测试的限制,终极狙击手仪表盘只适用于实时市场。 介绍Ultimate-Sniper Dashboard! 我们最好的产品包括HA-狙击手、MA-狙击手和许多特殊模式。终极狙击手仪表盘是一个绝对的野兽! 对于任何新手或专家交易者来说,这是最好的解决方案! 永远不要再错过任何一个动作! 对于那些喜欢简单和点数的交易者,我们有一个特别的产品给你。本质上很简单,该仪表板根据多种自定义算法查看28种货币对,完成所有工作。只需一张图表,你就可以像专家一样阅读市场。试想一下,如果你能在任何外汇对开始移动时准确地确定其方向,你的交易会有多大的改善。   我们的系统是为了寻找高概率信号并实时向用户发送警报。没有滞后或错误的信号。 为了保持图表的清洁,你可以在不需要时隐藏Ultimate-Sniper。只需按下箭头按钮即可隐藏仪表板。 Ultimate-Sniper适用于从1分钟到月度的所有时间框架,因此你可以在你选择的任何时间框架上快速发现趋势。 高概率信号
Currency Strength Wizard
Oleg Rodin
4.85 (59)
货币强度向导是一个非常强大的指标,为您提供成功交易的一体化解决方案。该指标使用多个时间范围内所有货币的数据来计算这个或那个外汇对的力量。此数据以易于使用的货币指数和货币电力线的形式表示,您可以使用它们来查看这种或那种货币的力量。 您所需要的只是将指标附加到您要交易的图表上,该指标将向您显示您交易的货币的真实强度。该指标还向您显示买卖量压力的极值,您可以在顺势交易时利用这些压力。该指标还显示了基于斐波那契的可能目标。该指标可用于各种交易时间范围。该指标支持各种货币对的交易。 该指标为您提供所有类型的警报,包括推送通知。 购买后请联系我。我将与您分享我的交易技巧,并免费为您提供丰厚的红利指标! 祝您交易愉快,获利丰厚!
BTMM State Engine Pro MT4
Garry James Goodchild
BTMM State Engine Pro is a MetaTrader 4 indicator for traders who use the Beat The Market Maker approach: Asian session context, kill zone timing, level progression, peak formation detection, and a multi-pair scanner from a single chart. It combines cycle state logic with a built-in scanner dashboard so you do not need the same tool on many charts at once. What it does Draws the Asian session range; session times can follow broker server offset or be set in inputs. Tracks level progression (L
KT Alpha Hunter Arrows MT4
KEENBASE SOFTWARE SOLUTIONS
大多数箭头指标只给你一个信号,然后把剩下的判断全部留给你自己。KT Alpha Hunter Arrows 给你的,是一套完整的交易计划。 每一个信号箭头出现时,图表上都会同时绘制完整计划:入场线、止损位、四个止盈目标,以及实时 Edge 结论,告诉你当前品种和时间周期是否值得交易。套装中还包含 Trade Manager EA,在你手动入场后负责后续执行,让你在市场波动和情绪干扰下依然保持纪律。非重绘。只在K线收盘后给出信号。适用于 Forex、黄金、指数,以及你交易的其他任何品种。 核心功能 非重绘买入和卖出箭头,只在K线收盘后出现。 每个信号都带有入场线、结构性止损和四个止盈目标。 Edge Dashboard 会分别评估当前图表上的买入和卖出机会。 结论系统:No Edge、Marginal、Tradeable、Good 或 Strong。 一键 Auto Optimize 按钮,可根据当前品种和时间周期自动调整设置。 完整套装包含 Trade Manager EA,并内置五种专为本指标设计的交易管理方案。 Prop Firm Risk Panel 可在图表上实时追踪日内回撤
- Real price is 80$ - 50% Discount (It is 39$ now) - just for 2 purchases. Contact me for instruction, add group and any questions! - Non-repaint - I just sell my products in Elif Kaya profile, any other websites are stolen old versions, So no any new updates or support. - Lifetime update free Related product:   Bitcoin Expert Introduction The breakout and retest strategy is traded support and resistance levels. it involves price breaking through a previous level.  The break and retest strateg
Atomic Analyst
Issam Kassas
5 (5)
首先值得强调的是,该交易指标是非重绘、非延迟的指标,这使其成为手动和机器人交易的理想选择。 用户手册:设置、输入和策略。 Atomic Analyst是一种PA价格行动指标,利用价格的力量和动量来寻找市场上更好的机会。配备了高级过滤器,可帮助去除噪音和假信号,并提高交易潜力。使用多层复杂的指标,Atomic Analyst扫描图表,并将复杂的数学计算转化为任何初学者都能理解并用来做出一致交易决策的简单信号和颜色。 “Atomic Analyst”是专为新手和经验丰富的交易者量身定制的综合交易解决方案。它将高级指标和一流功能融合为一体的交易策略,使其成为所有类型交易者的多功能选择。 日内交易和剥头皮策略:专为快速准确的日内交易和短期交易而设计。 日内和摆动交易策略:可用作追求价格大幅波动的日内和摆动交易者的可靠工具。 多货币和市场:凭借其可靠的精度,在不同的工具和市场上运作。 多个时间框架:可在多个时间框架上使用,性能良好。 稳定性:所有指标均不重绘、不重绘和不滞后,确保可靠的信号。 信号清晰度:提供箭头信号,用于清晰的入场和出场点。 实时警报:通过交易入场、SL和TP警报通知交易者
Dynamic Forex28 Navigator
Bernhard Schweigert
4.43 (7)
Dynamic Forex28 Navigator - 下一代外汇交易工具。 当前 49% 折扣。 Dynamic Forex28 Navigator 是我们长期流行的指标的演变,将三种功能合二为一: 高级货币强度 28 指标 (695 条评论)+ 高级货币 IMPULSE 带警报 (520 条评论)+ CS28 组合信号(奖励)。 有关指标的详细信息 https://www.mql5.com/en/blogs/post/758844 下一代强度指标提供什么? 您喜欢的原始指标的一切,现在通过新功能和更高的精度进行了增强。 主要特点: 专有货币强度公式。  所有时间范围内的平滑和准确的强度线。 非常适合识别趋势和精确进入。 动态市场斐波那契水平(市场斐波那契)。  此指标独有的独特功能。 斐波那契应用于货币强度,而不是价格图表。 适应实时市场活动以获得准确的反转区域。 实时市场动量。  第 9 行显示市场是活跃还是被动。 对于定时交易至关重要。 全面的警报和显示。  每种货币最强的买入和卖出动量。 ​​28 对的双重动量买入和卖出。 超买/超卖警告外部范围和止损。 反转
Advanced Currency IMPULSE with ALERT
Bernhard Schweigert
4.9 (490)
目前40%的折扣!! 对任何新手或专家交易者来说都是最好的解决方案! 这个指标是一个独特的、高质量的、负担得起的交易工具,因为我们已经纳入了一些专有的功能和一个秘密的公式。只需一张图表,它就能给出所有28种货币对的警报。想象一下,你的交易将如何改善,因为你能够准确地确定新趋势或剥头皮机会的触发点 建立在新的基础算法上,它使识别和确认潜在交易变得更加容易。这是因为它以图形方式显示了一种货币的强势或弱势是否正在加速,并测量了这种加速的速度--把它想象成你汽车中的速度表。当你加速时,事情显然会发生得更快,这在外汇市场上也是一样的,即如果你配对的货币正在向相反的方向加速,你就会发现一个潜在的有利可图的交易。 货币动量的垂直线和箭头将指导你的交易! 动态的市场斐波那契23水平被用作警报触发器,将适应市场活动。如果冲动触及黄色触发线,您将在MetaTrader或您的电子邮件或推送警报中收到警报。然后你就知道作为一个交易员应该做什么。货币对和方向已经给出。只要点击警报按钮,就可以切换到该货币对或打开一个新的图表,以便进一步分析。警报级别可以通过用户输入来改变,可以选择3个敏感度级别。 尽
Auto Optimized Parabolic RSI: 高级 3D 动量引擎 大多数零售指标之所以失效,是因为它们依赖于静态输入,一旦市场波动率发生变化,这些输入就会崩溃。Auto Optimized Parabolic RSI 通过不断重新计算自身的数学优势,解决了“指标衰退”的问题,将机构级别的量化自适应能力直接引入您的 MT5 终端。 核心优势:定制的内存 3D 优化   标准的自动优化器通常会导致 MT5 平台卡顿,因为它们通过标准的指标调用使终端超载。该工具完全绕过了这些性能瓶颈。内部引擎采用定制的原生基于 RAM 的计算器构建,每次加载图表或更改时间周期时,它都会执行极速的 3D 网格搜索。它同时扫描 RSI 周期(频率)、SAR 步长(加速度)和 SAR 最大值(速度限制),在绝对的毫秒级时间内测试数以万计的参数组合,且完全不会拖慢您的平台。它不是仅仅寻找一个“不错”的设置,而是映射整个参数空间,以寻找资产当前动量结构的绝对全局最大值。 严格的财务评分与逼真的交易模拟   与基于抽象“指标点数”进行优化评分的业余工具不同,该引擎的 3.10 版本严格与资金数学挂钩。每
FX Volume
Daniel Stein
4.63 (38)
FX Volume:从经纪商视角洞察真实市场情绪 简要概述 想要提升您的交易策略? FX Volume 可提供零售交易者和经纪商的持仓实时数据——远早于诸如 COT 之类的延迟报告。不论您希望获得持续稳定的收益,还是想在市场中多一分制胜的砝码, FX Volume 都能帮您识别重大失衡、确认突破以及完善风险管理。立即开启体验,让真实的成交量数据为您的交易决策带来革新! 1. 为什么 FX Volume 对交易者格外有用 极具准确度的早期预警 • 快速捕捉有多少交易者正在买入或卖出某个货币对——比大多数人提前一步。 • FX Volume 是 唯一 能够整合多家零售经纪商真实成交量数据并以简洁方式呈现的工具。 强力风险管理 • 及时识别多头或空头仓位的巨大不平衡,这往往预示着潜在的趋势反转,帮助您更自信地设置止损和目标位。 • 独家而真实的数据让每一次交易决策更具可靠性。 优化进场与出场点 • 发现“过度集中”的交易(大多数交易者都在同一方向),并通过真实成交量来确认突破。 • 避免依赖常见指标可能带来的误导信号,而是利用真实的实时成交量。 适配各种交易策略 • 将 FX
TPSpro RFI Levels
Roman Podpora
4.86 (28)
俄语说明 /  英文 说明   -  MT5 版本 主要功能: 显示卖家和买家的活跃区域! 该指标显示所有正确的买入和卖出的初始脉冲水平/区域。当这些水平/区域被激活时,即开始寻找入场点的位置,水平线会改变颜色,并填充特定颜色。此外,还会显示箭头,以便更直观地了解情况。 LOGIC AI - 激活模板时显示用于搜索入口点的区域(圆圈) 为了提高视觉清晰度,添加了使用人工智能搜索入口点的显示区域的功能。 显示更高时间范围内的级别/区域(MTF 模式) 新增使用更高时间间隔显示级别/区域的功能。此外,该指标还具有自动趋势检测功能 (   TPSproTREND PRO   )。 独立的专业分步交易算法 该算法专为顺势和逆势的日内交易而设计。每个活动模板均提供详细的说明。 适用于不同的时间范围 TPSpro RFI 水平指标可用于图表上的任何时间间隔,从分钟(M1)到每月(MN)。 图形和声音警报 该指标提供图形和声音提示,让您不会错过交易信号。 此外,还支持手机通知。 简单有效的活性模板扫描器 这是一个非常紧凑的主动模式扫描仪,当在一个方向上的所有时间间隔内激活模式时,它会自动发出警报并
Cycle Sniper
Elmira Memish
4.39 (36)
Please contact us after your purchase and we will send you the complimentary indicators to complete the system Cycle Sniper is not a holy grail but when you use it in a system which is explained in the videos, you will feel the difference. If you are not willing to focus on the charts designed with Cycle Sniper and other free tools we provide, we recommend not buying this indicator. We recommend watching the videos about the indiactor and system before purchasing. Videos, settings  and descri
Volatility Trend System - a trading system that gives signals for entries. The volatility system gives linear and point signals in the direction of the trend, as well as signals to exit it, without redrawing and delays. The trend indicator monitors the direction of the medium-term trend, shows the direction and its change. The signal indicator is based on changes in volatility and shows market entries. The indicator is equipped with several types of alerts. Can be applied to various trading ins
Route Lines Prices -  是一款用于寻找价格方向的指标。其简洁的界面包含多种价格行为和未来方向计算算法。这些算法包括基于所用时间周期的波动率计算和价格平滑。 该指标只有一个参数,用于更改“ Calculating price values ”。默认值 1 提供均衡的自动计算, 无需手动配置即可使用。 通过手动更改 2 到 500 之间的值,您可以根据自己的交易系统自定义指标。 建议在 M1 到 H4 的时间周期内使用此指标。适用于任何交易品种。 信号箭头在蜡烛图收盘时生成;不会重绘历史数据。 主图表上提供重复箭头。 提供多种类型的警报。内置的线轨迹计数器基于收盘价工作。这意味着,当出现相反信号时,会确定价格轨迹的数值,并在信号结束后的下一根蜡烛图上显示这些数值。 总计数器将获得的值相加,以便在相应的图表上方便地调整参数。
Trend indicator AI
Ramil Minniakhmetov
4.53 (83)
趋势人工智能指标是一个伟大的工具,将加强交易者的市场分析结合趋势识别与可操作的进入点和逆转警报。 该指标使用户能够自信和精确地驾驭外汇市场的复杂性 除了主要信号,趋势Ai指标识别在回调或回调期间出现的次要入口点,使交易者能够利用既定趋势内的价格修正。 重要优势: *MT4及MT5工程 *明确买入或卖出信号 ·不重绘 *适用于所有资产 小心我不卖EA或设置电报它骗局. 所有设置免费在这里的博客。  重要! 购买后立即与我联系,以获得指示和奖金! 真实的操作监控以及我的其他产品可以在这里找到: https://www.mql5.com/en/users/mechanic/seller&nbsp ; 设置和输入: 建议为所有资源设置默认设置。 第...
GOLD Impulse with Alert
Bernhard Schweigert
4.67 (12)
这个指标是我们2个产品 Advanced Currency IMPULSE with ALERT  +   Currency Strength Exotics 的一个超级组合。 它适用于所有时间框架,并以图形方式显示8种主要货币和一种符号的强势或弱势冲动! 该指标专门用于显示任何符号的货币强度加速,如黄金、异国货币对、商品、指数或期货。这是它的第一个指标,任何符号都可以被添加到第9行,以显示黄金、白银、石油、DAX、US30、MXN、TRY、CNH等的真实货币强度加速(冲动或速度)。 建立在新的基础算法上,它使识别和确认潜在的交易更加容易。这是因为它以图形方式显示了一种货币的强势或弱势是否正在加速,并测量了这种加速的速度--把它想象成你汽车中的速度表。当你加速时,事情显然会发生得更快,这在外汇市场上也是一样的,即如果你配对的货币正在向相反的方向加速,你就会发现一个潜在的有利可图的交易。 动态市场斐波那契28水平被用作警报触发器,将适应市场活动。如果冲动击中黄色触发线,你将收到警报。然后你就知道作为一个交易员应该做什么。货币对和方向已经给出。只需点击警报按钮,就可以切换到该货
停止猜测,开始用统计优势交易 股票指数的交易方式与外汇不同。它们有固定的交易时段,隔夜会出现跳空,并遵循可预测的统计模式。这个指标为您提供所需的概率数据,让您能够自信地交易DAX、标普500和道琼斯等指数。 与众不同之处 大多数指标向您展示已经发生的事情。而这个指标向您展示接下来可能发生什么。每个交易日,指标都会根据100天的历史数据分析您当前的设置。它会找到具有相似跳空、相似开盘位置的日子,并准确计算价格到达关键水平的频率。不再猜测跳空是否会回补,或者昨天的高点是否会被测试。您将获得基于真实数据的精确百分比。 完整手册及所有参数说明请访问: https://www.mql5.com/en/blogs/post/766370 帮助您找到优质设置的策略指南: https://www.mql5.com/en/blogs/post/766371 搭配风险回报计算 + 快速交易管理按钮EA,轻松进行股指日内交易 - https://www.mql5.com/en/market/product/78020 MT5 Version:  https://www.mql5.com/en/market/
作者的更多信息
SnR tool
Syahirul Nizzam Bin Haron
5 (1)
This is a SnR tool. It is built based on the body candle. It is a multi timeframe indicator. There is a powerful scalabar for vertical line slides to limit the candle bars. Color for each line can also be changed. It can detect: 1. Support && Resistance 2. Support become Resistance && vice versa 3.Support become Resistance become Support && vice versa It also can be used for trading tools and studies on SnR *New Version avaiable
MACD The Factor
Syahirul Nizzam Bin Haron
MACD FACTOR! Macd factor is amazing!...it draws multi lines of its own factor of macd(12,26,9) on the chart! not on separate windows as normally macd (12,26,9) it is.                     It is not 12,26 of EMA's on that chart ... it is now really different! ... It has 6 difference lines + 1 line of it own factor line .. You can examine every each of the lines cross over of each other at the specific time and price while at the same time, the main line of macd (12,26,9) cross over the signal l
筛选:
Wan Ping Fei
1690
Wan Ping Fei 2020.12.18 04:18 
 

用户没有留下任何评级信息

回复评论