RSI Divergence Detector
- Indicators
- Version: 1.4
- Updated: 7 December 2019
- Activations: 5

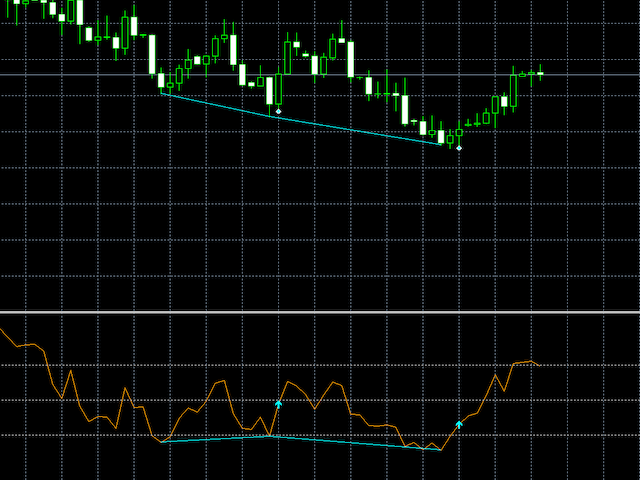
RSI Divergence Detector is an RSI indicator which also detects divergences and plots arrows and trend lines on the chart where you should buy and sell. Please note that this indicator provides 5 buffers and doesn't repaint making it an exceptional indicator for Expert Advisors. The indicator also provides alerts.
Buffer 0 = RSI
Buffer 1 = Buy
Buffer 2 = Sell
Buffer 3 = RSIGradient
Buffer 4 = PriceGradient
NON REPAINTING
DIVERGENCE DETECTION

User didn't leave any comment to the rating