Volume Profile V6

4.8

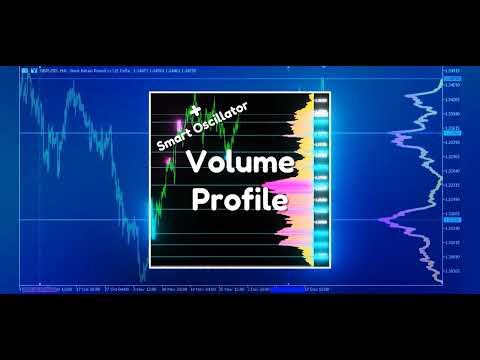
Market Volume Profile indicator + Smart Oscillator。ほぼすべての金融商品に対応しています — 通貨ペア、株式、先物、暗号資産。リアルボリュームおよびティックボリュームの両方に対応しています。プロファイルの計算範囲は自動(例:1週間、1ヶ月など)でも、手動でも設定可能です(赤と青の2本の垂直ラインで範囲を指定)。ヒストグラム形式で表示されます。各価格レベルにおけるヒストグラムの幅は、そのレベルで行われた取引量(概念的な値)を示します。「Mode level line color」パラメータにより、価格が高い確率で反応する重要なボリュームレベルを自動表示できます。また「Maximum color (POC)」パラメータは、指定範囲内で最も取引量が多い価格レベルを個別に表示します。

Smart Oscillatorは買われ過ぎ・売られ過ぎゾーンを表示します。複数のインジケーターからの情報を分析し、処理されたデータに基づいてこれらのゾーンを色分けして表示します。

Volume every dayでは、Range periodパラメータでプロファイル構築の時間範囲を指定し、Range countパラメータでその範囲の数を設定できます。例えば、Range period = 1Day、Range count = 10の場合、直近10日分の日次プロファイルが構築されます。重要な点として、チャートの時間足を変更してもプロファイルの計算には影響しません。これも本インジケーターの大きな利点です。

本インジケーターは非常にシンプルで使いやすく、それでいて非常に高い情報量を持っています。このインジケーターを使えば、マーケットメーカーの売買を隠すことはできません。すでに数千人のユーザーがダウンロードしており、否定的なレビューは一つもありません。

一部の銘柄に対する設定例は、ディスカッションのメッセージNo.14をご覧ください。

その他の無料および有料製品はこちら:
https://www.mql5.com/ru/users/raprofit/seller

PARAMETERS:

Use Smart Oscillator — インジケーターの有効/無効。

Smart Oscillator Alerts — スマートオシレーターのシグナル通知の有効/無効を切り替えるブロック。通知は確認済みシグナルに対してのみ生成されます:
— START signal(ゾーン開始)は、オシレーターラインが確定し再描画されない状態でバーが確定した後に送信されます
— END signal(ゾーン終了)は、ラインが消えた最初の確定バーの後に送信されます

SmartAlertPopup — ターミナルでのポップアップ通知の有効/無効。

SmartAlertPush — モバイルデバイスへのプッシュ通知の有効/無効(事前にMetaQuotes IDの設定が必要)。

SmartAlertEmail — メール通知の有効/無効(事前にメール設定が必要)。

Use Volume Range — インジケーターの有効/無効。

Range mode — 範囲指定方法:
Between lines - 2本のラインの間
Last minutes - 直近RangeMinutes分
Minitues to line - 右側ラインまでのRangeMinutes

Range minutes — RangeMode 1および2の分数。

Mode step (points) — モード間の最小距離(銘柄ごとに調整)。

Point scale — ヒストグラム描画の価格精度。値が大きいほど高速だが精度は低下します。

Volume type — ボリュームタイプ:ティックまたはリアル。リアルボリュームが提供されていない場合、表示されません。

Data source — データソース:
Ticks (MT5 only) - ブローカーのティックデータ
M1, M5, M15 - 指定時間足のバーから補間されたティック

Bar style — ヒストグラムスタイル:
Lines - ライン
Empty bar - 空の矩形
Filled bar - 塗りつぶし矩形
Outline - 輪郭
Color - カラー

Histogram position — ヒストグラム位置:
Window left - ウィンドウ左側
Window right - ウィンドウ右側
Left outside - 左側境界から外側
Right outside - 右側境界から外側
Left inside - 左側境界から内側
Right inside - 右側境界から内側

Color 1 — ヒストグラムカラー1。Noneで背景色を使用。

Color 2 — ヒストグラムカラー2。Noneで背景色を使用。

Line width — ヒストグラムの線の太さ。

Mode color (None=disable) — モード(局所ボリュームピーク)の色。Noneで無効。

Maximum color (None=disable) — 最大ボリュームレベルの色。Noneで無効。

VWAP color (None=disable) — VWAP(出来高加重平均価格)の色。Noneで無効。

Mode level line color — モードレベルラインの色。Noneで無効。

Mode level line style — モードラインのスタイル。

Identifier — インジケーター識別子(複数使用時に異なる値を指定)。

Use Volume every day — インジケーターの有効/無効。

Range period — 期間(M1〜MN1の標準値)。MT5では中間時間足も使用可能。

Range count — 範囲数。

Mode step (points) — モード間の最小距離。

Point scale — ヒストグラム精度設定。

Volume type — ボリュームタイプ。

Data source — データソース:
Ticks (MT5 only)
M1, M5, M15

Bar style — ヒストグラムスタイル:
Lines
Empty bar
Filled bar
Outline
Color

Draw direction — 描画方向(左→右 または 右→左)。

Color 1 — カラー1。

Color 2 — カラー2。

Line width — 線の太さ。

Mode color (None=disable) — モードカラー。

Maximum color (None=disable) — 最大レベルカラー。

VWAP color (None=disable) — VWAPカラー。

Mode line width — モードラインの太さ。

Identifier — インジケーター識別子。


レビュー 24
Mase
1779
Mase 2026.05.03 06:57 
 

very supportive seller and excellent value add for my trading! thx a lot

Wagner Ceide
76
Wagner Ceide 2025.10.23 23:33 
 

ola Andrey.... comprei o indicador, tem um pdf explicando , wagner939@gmail.com, obrigado

Indigotom
71
Indigotom 2023.08.17 11:10 
 

Sehr nützliches und hilfreiches Programm. Der Funktionsumfang ist fantastisch. Und das zu einem wirklich guten Preis!!

おすすめのプロダクト
Was: $249  Now: $99   Market Profile defines a number of day types that can help the trader to determine market behaviour. A key feature is the Value Area, representing the range of price action where 70% of trading took place. Understanding the Value Area can give traders valuable insight into market direction and establish the higher odds trade. It is an excellent addition to any system you may be using. Inspired by Jim Dalton’s book “Mind Over Markets”, this indicator is designed to suit the
The market is unfair if only because 10% of participants manage 90% of funds. An ordinary trader has slim changes to stand against these "vultures". This problem can be solved. You just need to be among these 10%, learn to predict their intentions and move with them. Volume is the only preemptive factor that faultlessly works on any timeframe and symbol. First, the volume appears and is accumulated, and only then the price moves. The price moves from one volume to another. Areas of volume accumu
This Volume Delta Profile is an advanced MetaTrader 5 indicator that visualizes   volume delta (order flow imbalance)   using a volume profile-style histogram. It shows the difference between buying and selling pressure at specific price levels, helping traders identify supply and demand zones. This indicator provides a unique perspective on market dynamics by visualizing the imbalance between buying and selling pressure, offering insights beyond traditional volume analysis. Core Concept Positiv
Advanced Volume Profile Analysis Tool for MetaTrader 5 The Kecia Volume Profile Order Finder provides traders with volume profile analysis capabilities. This MT5 indicator combines volume profile visualization with statistical calculations to help identify potential trading opportunities and suggests entry, stop loss, and take profit levels based on market structure. Market Profile Visualization Transform your chart with customizable volume profile visualizations: Multiple visualization options
インディケータは現在のクオートを作成し、これを過去のものと比較して、これに基づいて価格変動予測を行います。インジケータには、目的の日付にすばやく移動するためのテキスト フィールドがあります。 オプション: シンボル - インジケーターが表示するシンボルの選択; SymbolPeriod - 指標がデータを取る期間の選択; IndicatorColor - インジケータの色; HorisontalShift - 指定されたバー数だけインディケータによって描画されたクオートのシフト; Inverse - true は引用符を逆にします。false - 元のビュー。 ChartVerticalShiftStep - チャートを垂直方向にシフトします (キーボードの上下矢印)。 次は日付を入力できるテキストフィールドの設定で、「Enter」を押すとすぐにジャンプできます。
Here   our more valuable tools SMC Trend Trading   ,  Easy SMC Trading  ,  Institutional SMC Architect Volume Analysis Tools  ,  Volume flow Profile  ,  Market volume profile  , FVG with Volume  , Liquidity Heatmap Profile  ,  Volume Spread Analysis The    Liquidity Heatmap   is a sophisticated institutional trading tool designed to reveal where over-leveraged traders are trapped. By calculating estimated liquidation levels based on volume spikes and leverage, this indicator draws a dynamic "h
プレミアムレベルは、正しい予測の精度が80%を超える独自の指標です。 この指標は、最高のトレーディングスペシャリストによって2か月以上テストされています。 あなたが他のどこにも見つけられない作者の指標! スクリーンショットから、このツールの正確さを自分で確認できます。 1は、1キャンドルの有効期限を持つバイナリーオプションの取引に最適です。 2はすべての通貨ペア、株式、商品、暗号通貨で機能します 手順: 赤い矢印が表示されたらすぐにダウントレードを開き、青い矢印が表示されたら閉じます。青い矢印の後に開くこともできます。 試してテストしてください!推奨設定はデフォルトです! 日足チャートで最高の精度を示します! インディケータは、2600 Pipsの収益性に対して、約10Pipsという非常に小さなマージンを使用します。
This indicator allows you to enjoy the two most popular products for analyzing request volumes and market deals at a favorable price: Actual Depth of Market Chart Actual Tick Footprint Volume Chart This product combines the power of both indicators and is provided as a single file. The functionality of Actual COMBO Depth of Market AND Tick Volume Chart is fully identical to the original indicators. You will enjoy the power of these two products combined into the single super-indicator! Below is
Here   our more valuable tools SMC Trend Trading   ,  Easy SMC Trading  ,  Institutional SMC Architect Volume Analysis Tools  ,  Volume flow Profile  ,  Market volume profile  , FVG with Volume  , Liquidity Heatmap Profile  ,  Volume Spread Analysis The Fractals_Price indicator is a technical analysis tool that identifies fractal patterns on price charts. Fractals are recurring patterns that signal potential trend reversals or continuation points. This indicator marks both upward and downward
Volume Profile Canvas - Professional Volume Profile Indicator for MetaTrader 5 DESCRIPTION Volume Profile Canvas is a professional volume profile indicator for MetaTrader 5 that renders directly on the chart using a high-performance Canvas engine. It calculates and displays the volume distribution across price levels, identifying the Point of Control (POC), Value Area High (VAH) and Value Area Low (VAL) in real time. This is a pure analysis tool. It does not trade. It gives you an instant vi
Cumulative Volume Delta MA-X MTF (Gradient Momentum 搭載) このインディケーターは、MetaTrader 5向けにマルチタイムフレーム(MTF)での累積ボリューム・デルタ(CVD)分析を行います。ティックデータまたはリアルボリュームデータを分析することで、買い圧力と売り圧力の純差を計算し、オーダーフローのセンチメントを視覚的に表現します。 ロジックと機能 このインディケーターは、数学的なアプローチを用いてボリューム分析を行います: データソース : 取引所銘柄のリアルボリューム(Real Volume) と、FX/CFD向けの OHLCウィック・プロキシ(OHLC Wick Proxy)計算の両方をサポートしています。 グラデーションシステム : 4色の移動平均線がトレンドの段階を識別します: ディープスカイブルー(DeepSkyBlue) : 数値が正で、上昇中。 オレンジ(Orange) : 数値が正で、下落中。 マゼンタ(Magenta) : 数値が負で、下落中。 パープル(Purple) : 数値が負で、上昇中。 5レイヤー
Volume Candle Indicator
Pablo Filipe Soares De Almeida
MetaTrader 5 用ボリュームカラーヒストグラムインジケーター このインジケーターは、取引量を別ウィンドウにヒストグラムとして表示します。ローソク足の方向に基づき、バーの色が自動的に変化します。終値が始値より高い場合は緑(上昇トレンド)で表示され、終値が始値より低い場合は赤(下降トレンド)で表示されます。これにより、トレーダーは価格変動とボリュームの関係を視覚的に把握できます。 主な機能 ボリュームソース:ティックボリュームまたはリアルボリュームを選択可能。 ボリュームヒストグラムの上に移動平均線を追加でき、平滑化されたボリュームトレンドを確認可能。 対応平均タイプ:SMA、EMA、SMMA、LWMA。 平均期間を自由に設定可能。 すべての銘柄と時間足で動作し、MetaTrader 5 に完全対応。 視覚的にわかりやすい配色設計により、価格変化の強弱を一目で判断でき、トレードタイミングを最適化するのに役立ちます。
Includes almost all the concepts related to Volume Profile: POC , Value Area , Developing POC , Anchored VWAP , Volume Delta ; since the “Total” in its name. It is fast in its calculations and simple to work with. Features: 1.    Selectable calculation timeframe to find most traded levels. 2.    Capable of calculating Volume Profile based on tick data 3.    Adjustable histogram bars by their count. 4.    Adjustable histogram bars by their height (price range). 5.    Showing Value Area (VA
The "MR Volume Profile 5" indicator is a charting tool that displays trading volume at different price levels rather than time intervals. A key concept in volume profile is the point of control (POC)—the price level with the highest volume traded during the session or time range. While tools like VWAP or OBV provide volume trends, the "MR Volume Profile 5" indicator offers granular detail about where the most market activity occurs at specific price levels. This makes it a more precise tool for
"QuickLineAlert" – Smart and Fast Price Level Indicator (MT5) "QuickLineAlert" is a tool designed for the MetaTrader 5 platform, created to maximize the speed and simplify the marking of price levels. It is perfectly suited for active traders (especially scalpers and day traders) who need to react instantly to market changes without long and tedious setups. You just press a button, place a line, and let the indicator do its job. Main Advantages: Fully Automated (No Need to Choose Direction) U
Japanese このインジケーターは、チャートパターンでのトレードを好むトレーダーにとって、高度なチャート分析アシスタントとして機能します。目視での分析負担を軽減し、利益を上げるための精度を高めるように設計されています。 実際の使用においての、このインジケーターの主な利点と特徴は以下の通りです: 1. 自動パターン検出 (Automated Pattern Detection) 時間の節約とバイアスの軽減: 手動でトレンドラインを引く必要はありません。価格のスイングポイント(Pivot High/Low)を検索し、価格構造が条件を満たすと、ライジングウェッジ(上昇楔形)とフォーリングウェッジ(下降楔形)を自動的に描画します。 あらゆる状況を網羅: パターン形成中、ブレイクアウト、さらにはパターン失敗(Failed)まで検出でき、市場の全体像を明確に把握できます。 2. ターゲットとフィボナッチTPの内蔵 (Built-in Targets & Fibonacci TP) ターゲットを自動計算: ブレイクアウトが発生すると、システムはウェッジの開き幅に基づいてメインターゲットの距離を即
Noize Absorption Index - is the manual trading system that measures the difference of pressure between bears forces and bulls forces. Green line - is a noize free index that showing curent situation. Zero value of index shows totally choppy/flat market.Values above zero level shows how powerfull bullish wave is and values below zero measures bearish forces.Up arrow appears on bearish market when it's ready to reverse, dn arrow appears on weak bullish market, as a result of reverse expectation.
Harmonic Pattern Structure Harmonic Pattern Structure is a professional MetaTrader 5 indicator that automatically detects classic harmonic patterns using strict Fibonacci ratio validation and XABCD price structure. Designed for traders who value precision, clean visuals, and structured analysis, the indicator highlights potential reversal zones based on price geometry, supporting consistent and objective decision-making. SUPPORTED HARMONIC PATTERNS Gartley (222) Butterfly Bat Crab Shark Cy
Before installing the HeatMap indicator make sure you are using a broker that gives you access to the Depth of market (DOM) !! This indicator creates a heatmap on your chart allowing you to see the buy or sell limit orders easily and in real time. You have the possibility to change the setting and the colors of the HeatMap in order to adapt to all markets and all charts. Here is an example of a setting you can use with the NASDAQ100 on the AMPGlobal broker :  https://www.youtube.com/watch?v=x0Y
You already have positions open. The question is whether the episode is still under control. Floating P/L tells you the result. It does not tell you the condition. A position group can still show a small gain while inventory load, hold time, adverse drift, weakening recovery, and spread expansion are already building pressure in the background. By the time the P/L number turns negative, the episode is already stressed. Episode Health Monitor was built to surface those conditions before they beco
Introducing PivotWave – your ultimate trading companion that redefines precision and market analysis. Designed with traders in mind, PivotWave is more than just an indicator; it’s a powerful tool that captures the pulse of the market, identifying key turning points and trends with pinpoint accuracy. PivotWave leverages advanced algorithms to provide clear visual signals for optimal entry and exit points, making it easier for traders to navigate volatile market conditions. Whether you are a begin
Here   our more valuable tools SMC Trend Trading   ,  Easy SMC Trading  ,  Institutional SMC Architect Volume Analysis Tools  ,  Volume flow Profile  ,  Market volume profile  , FVG with Volume  , Liquidity Heatmap Profile  ,  Volume Spread Analysis 2. Key Features Dynamic Filtering : The core feature. As soon as the current price crosses a historical liquidity level, that level disappears. This reduces chart clutter and prevents you from trading off "dead" support/resistance. Liquidity Heatma
SMC Venom Model BPR インジケーターは、スマート マネー (SMC) コンセプトで取引するトレーダー向けのプロフェッショナル ツールです。価格チャート上の 2 つの主要なパターンを自動的に識別します。 FVG   (フェアバリューギャップ) は、3 本のローソク足の組み合わせで、最初のローソク足と 3 番目のローソク足の間にギャップがあります。ボリュームサポートのないレベル間のゾーンを形成し、価格修正につながることがよくあります。 BPR   (バランス価格範囲) は、2 つの FVG パターンの組み合わせで、「ブリッジ」を形成します。これは、価格がボリュームアクティビティの少ない動きで動くときに、ブレイクアウトしてレベルに戻るゾーンで、ローソク足の間にギャップを作成します。 これらのパターンは、大規模な市場プレーヤーと一般参加者の相互作用が発生するチャート上のボリュームと価格動向の分析に基づいて、トレーダーが主要なサポート/レジスタンス レベル、ブレイクアウト ゾーン、エントリ ポイントを識別するのに役立ちます。 インジケーターは、長方形と矢印の形でパターンを視覚
TRI Visualizer Enhanced - 熱力学的市場分析の革命 概要 TRI(Thermal Range Indicator)Visualizer Enhanced は、従来のテクニカル分析を超越した、物理学の熱力学理論を応用した革新的なマーケット分析インジケーターです。市場の価格変動を「熱力学的エネルギー」として捉え、これまで見落とされていた市場の微細な変化を高精度で検出します。 革新的な仕組み 1. デュアル計算エンジン クラシックTRIモード 基本公式: |終値-始値| + (高値-安値) ローソク足の実体とヒゲを統合した純粋なボラティリティ測定 シンプルで直感的、あらゆる市場環境で安定動作 熱力学的TRIモード(独自開発) 価格加速度 :2次微分による価格変化の勢いを測定 出来高変化率 :相対的な出来高の変化を動的に評価 ポジションエネルギー :正規化された価格変動エネルギーを計算 熱力学的係数 :物理学の熱力学法則を市場分析に応用 2. 高度な平滑化システム SMA(単純移動平均) :基本的なノイズ除去 EMA(指数移動平均) :最新データ重視の平滑化
Description: The Volume Profile displays detailed informations of historical trading activities at certain price levels (Market Profile). Locate the areas with the best prices in the market and get an advantage over other market participants. Features: Customizable Market Profile Shows the "fair" Value Area with 70% of all Volume Shows critical low volume zones Shows VPOC, VAL and VAH Points integrated resource management to reduce the load while working with multiple charts Works on all timefr
VPO Profile MT5
Kyra Nickaline Watson-gordon
5 (2)
Definition : VPO is a Volume Price Opportunity. Instead of using bars or candles with an Open, High, Low, and Close price, each "bar" in a Market Profile is represented by horizontal bars against the price It is called Market Profile terminology. In other words volume-price-opportunity (VPO) profiles are histograms of how many volumes were traded at each price within the span of the profile. By using a VPO chart, you are able to analyze the amount of trading activity, based on volume, for each
MT5用ボリュームプロファイルVPVR ボリュームプロファイルVPVRは、高度なボリュームプロファイル(可視範囲)をチャート上に直接再現する、強力で高性能なMetaTrader 5インジケーターです。取引活動が集中している場所を視覚化することで、市場構造を深く理解し、トレーダーが重要な価格レベルを正確に特定するのに役立ちます。 このインジケーターは、価格レベルごとのボリューム分布を動的に分析し、詳細なヒストグラムをチャート上に直接表示します。これにより、市場の受容ゾーン、拒否ゾーン、流動性クラスターを一目で把握できます。 主な機能 • 可視範囲モードと固定範囲モード VPVR(可視ローソク足に合わせて自動調整)と、より精密な分析のための独自のカスタム範囲をシームレスに切り替えられます。 • ポイントオブコントロール(POC) 取引量が最も多い価格レベル(市場の関心度が最も高いレベル)を自動的に検出し、ハイライト表示します。 • バリューエリア(VAH / VAL) 設定可能なパーセンテージ(デフォルト70%)に基づいてバリューエリアの高値と安値を表示し、適正価格帯を
LevelsHunter Pro – プロフェッショナルな出来高プロファイルと履歴分析 これは何か LevelsHunter Proは、現在のPOC、VAH、VALレベルを表示するだけでなく、 過去に遡って 過去のトレードの瞬間にこれらのレベルがどこにあったかを確認できる出来高プロファイルインジケーターです。 チャート上で推測するためのツールではありません。すでに起こったことを   冷静に分析   するためのものです。 トレーダーに必要な理由 問題点:   ほとんどのインジケーターは「今、ここ」だけを示します。トレードを終了してミスを分析しようとすると、レベルはすでに動いています。POCがエントリー価格より上にあったのか下にあったのかわかりません。価格がなぜ跳ね返ったのか、レベルをブレイクしたのかわかりません。 解決策:   LevelsHunter Proはすべてのバーのレベルを記録します。履歴の任意のローソク足をクリックするだけで、その瞬間の出来高プロファイルを正確に見ることができます。 トレードでの使い方 1. リアルタイムエントリーの改善 買いシグナルが見えます。価格がPOCま
Was: $299  Now: $99  Supply Demand uses previous price action to identify potential imbalances between buyers and sellers. The key is to identify the better odds zones, not just the untouched ones. Blahtech Supply Demand indicator delivers functionality previously unavailable on any trading platform. This 4-in-1 indicator not only highlights the higher probability zones using a multi-criteria strength engine, but also combines it with multi-timeframe trend analysis, previously confirmed swings a
VOLUME PROFILE SAF-XII MT5専用プロフェッショナル・マーケットプロファイル分析ツール(グリッドトレードに最適な「ドリーム・インジケーター」) ボリュームプロファイル(価格帯別出来高)とは? ボリュームプロファイルは、従来の「時間軸」の出来高とは異なり、「特定の価格帯」での取引活動を表示するプロ仕様のツールです。選択した期間内の「どこで」取引が行われたかを可視化し、以下のポイントを特定します: バリューエリア (VAH/VAL) :全取引の大部分が行われた価格帯。 ポイント・オブ・コントロール (POC) :最も出来高が集中した単一の価格水準。 リクイディティ・イムバランス :各価格帯における強気(買い)と弱気(売り)の優劣。 サポレジ(支持・抵抗) :実際の取引活動に基づいた自然な価格水準。 3つの動作モード — 「設定したらあとはお任せ」 VP_MANUAL(スイングトレード・重要ライン分析) 垂直ラインをドラッグして分析範囲を手動で設定。 ラインを動かした時のみ再計算されるため軽量。 用途 :指標発表前分析、決算発表、特定の期間分析。 VP_AUTO(スキ
このプロダクトを購入した人は以下も購入しています
Neuro Poseidon is a new indicator by Daria Rezueva. It combines precise trading signals with adaptive TP/SL levels - creating best possible trades as a result! Message me and get  Neuro Poseidon Assistant  as a gift to automize your trading process! What makes it stand out? 1. Proven profitability on all assets and timeframes 2. Only confirmed BUY and SELL signals present on the chart 3. Adaptive TP & SL levels generated by the software for each trade 4. Easy to understand - suitable for al
SuperScalp Pro
Van Minh Nguyen
4.67 (27)
SuperScalp Pro – 高度なマルチフィルタースキャルピングインジケーターシステム SuperScalp Pro は、クラシックな Supertrend と複数のインテリジェント確認フィルターを組み合わせた高度なスキャルピングインジケーターです。M1 から H4 まで複数の時間足で効率的に動作し、XAUUSD、BTCUSD、主要 Forex 通貨ペア向けに最適化されています。 このインジケーターは明確な Buy / Sell シグナルを提供し、ATR に基づいてエントリー価格、Stop Loss、Take Profit を自動計算します。Fibonacci Take Profit 機能により、重要な価格帯で早期決済し、到達時に通知を送信します。 初期設定では Fibonacci Take Profit が有効化されており、より安定した取引体験を重視しています。チャートに適用するだけですぐ利用可能です。上級者向けに、すべてのパラメータは自由にカスタマイズできます。 完全なドキュメントは製品ブログにあります: [User Guide] SuperScalp Pro Auto T
まず正直に言いましょう。 どんなインジケーターも、それ単体であなたを利益化させることはできません。もしそう言う人がいるなら、それは夢を売っているだけです。完璧な売買シグナル(矢印)を表示するインジケーターは、いくらでも“完璧に見せる”ことができます。正しい過去の区間を拡大して、勝ちトレードだけを切り取ればいいだけです。私たちはそれをしません。 SMC Intraday Formula はツールです。 市場構造を読み取り、最も高い確率の価格ゾーンを特定し、今この瞬間のスマートマネーの痕跡をシンプルな言葉で正確に示します。最終判断はあなたが行います。トレードを実行するのもあなたです。しかし今は「希望」ではなく「精度」でエントリーできます。 私たちはこのインジケーターを、ゴールド(XAUUSD)および主要FX通貨ペアで約3年間、日々のスキャルピングに使用してきました。M1、M5、M15、M30の主要ツールです。これは未来を予測しようとするのではなく、今まさに形成されている高確率セットアップを示し、その理由を説明します。 他のすべてのインジケーターと何が違うのか? ほとんどのトレーディングイ
Quantum TrendPulse を ご紹介します。これは、   SuperTrend   、   RSI   、および Stochastic のパワーを 1 つの包括的なインジケーターに組み合わせて、取引の可能性を最大限に引き出す究極の取引ツールです。精度と効率を求めるトレーダー向けに設計されたこのインジケーターは、市場のトレンド、勢いの変化、最適なエントリー ポイントとエグジット ポイントを自信を持って特定するのに役立ちます。 主な特徴: SuperTrend 統合: 現在の市場動向に簡単に追従し、収益性の波に乗ることができます。 RSI精度: 買われすぎと売られすぎのレベルを検出し、市場の反転のタイミングに最適で、SuperTrendのフィルターとして使用されます。 確率的精度: 確率的振動を活用して、変動の激しい市場で隠れたチャンスを見つけます。SuperTrend のフィルターとして使用されます。 マルチタイムフレーム分析:   M5 から H1 または H4 まで、さまざまなタイムフレームで市場を常に把握します。 カスタマイズ可能なアラート: カスタム取引条件が満たされ
Entry In The Zone and SMC Multi Timeframe is a real-time 2-in-1 market analysis tool that combines market structure analysis and a No Repaint BUY / SELL signal system into a single indicator, built on Smart Money Concepts (SMC) — a widely adopted framework used by professional traders to understand market structure. This indicator helps you see the market more clearly, make decisions based on structure rather than guesswork, and focus on high-probability zones where price is more likely to react
このインジケーターを購入された方には、以下の特典を 無料 で提供しています: 各トレードを自動で管理し、ストップロスとテイクプロフィットを設定し、戦略ルールに基づいてポジションを決済する補助ツール 「Bomber Utility」 様々な銘柄に合わせたインジケーターの設定ファイル(セットファイル) 「最小リスク」、「バランスリスク」、「待機戦略」 の3つのモードで使用できる Bomber Utility 用の設定ファイル このトレーディング戦略をすぐに導入・設定・開始できる ステップバイステップのビデオマニュアル ご注意: 上記の特典を受け取るには、MQL5のプライベートメッセージシステムを通じて販売者にご連絡ください。 オリジナルのカスタムインジケーター 「Divergence Bomber(ダイバージェンス・ボンバー)」 をご紹介します。これは、MACDのダイバージェンス(乖離)戦略に基づいた 「オールインワン」型のトレーディングシステム です。 このテクニカルインジケーターの主な目的は、価格とMACDインジケーターの間に発生するダイバージェンスを検出 し、将来の価格の動きを示す
この製品は 2026 年の市場向けに更新され、最新の MT5 ビルドに最適化されています。 価格更新のお知らせ: Smart Trend Trading System は現在 $99 で提供されています。 次の 30 件の購入 後、価格は $199 に上がります。 特別オファー: Smart Trend Trading System を購入後、私にプライベートメッセージを送ることで、 Smart Universal EA を無料 で受け取り、Smart Trend のシグナルを自動売買に変えることができます。 Smart Trend Trading System は、リペイントなし、再描画なし、遅延なしの完全なトレーディングシステムです。よりクリーンなシグナル、より明確なトレンド方向、そしてより整理された取引方法を求めるトレーダー向けに作られています。 Online course , manual and download presets . このシステムは、トレンド検出、反転ゾーン、Smart Cloud、トレーリングストップロジック、サポートとレジスタンス、ローソク足の色分け、ア
M1 Quantum は、M1専用のプロフェッショナルトレーディングシステムであり、ストップロス、テイクプロフィット、スマートな資金管理を内蔵した、迅速かつ正確な取引シグナルを提供します。 M1 Quantum は、 連続勝利 に重点を置いて口座を素早く成長させるために設計されたプロフェッショナルな資金管理を備えています。 M1 Quantum インジケーター の主な特徴 M1時間足 およびすべての 主要通貨ペア 向けに設計 すべての取引にストップロスとテイクプロフィットを設定 資金管理 を実装し、トレーダーが簡単に取引できるようサポート 高い勝率と高い 連続勝利 リペイントなし、遅延なし あらゆるトレーダーにとって理解しやすい M1 Quantum を使用するには、 M1 Quantum Assistant が必要です。この強力なツールは、M1 Quantum をご購入いただいたすべてのお客様に 無料 で提供されています。 M1 Quantum Assistant をダウンロード 私のMQL5 チャンネルに参加して、最新のアップデートや新製品のリリース情報を入手してください。 価格は
トレンドキャッチャーインジケーター トレンドキャッチャーインジケーターは、開発者独自の適応型トレンド分析指標を組み合わせることで、市場価格の動きを分析します。短期的なノイズを除去し、根底にあるモメンタムの強さ、ボラティリティの拡大、価格構造の挙動に焦点を当てることで、真の市場方向性を特定します。また、移動平均線、RSI、ボラティリティフィルターなどの平滑化およびトレンドフィルタリング機能を備えたカスタマイズ指標も使用します。 実際の運用状況のモニタリングやその他の製品については、こちらをご覧ください: https://www.mql5.com/en/users/mechanic/seller ご注意ください。私はTelegramでEAや設定を販売していません。詐欺です。すべての設定はブログで無料で公開しています。 重要!ご購入後すぐにご連絡ください。手順とボーナスをお送りします!
SignalTech is an unique fully rule based trading system delivers an Institutional approach for both Independent Traders and Prop Firm Challengers. Never Repaint. Push Notification available. No over-optimization. All the winning trades with chart setups are published on the comments page. 2026-05 4107 Pips (Until 05-29 NY Closed) 2026-04 2243 Pips 2026-03 2165 Pips 2026-02 2937 Pips 2026-01 2624 Pips 2025-12 1174 Pips It can generate signals with Buy/Sell Arrows, Push Notification (To Mobile) an
PrimeScalping is a powerful trading companion designed to generate high-probability entry signals with dynamic TP/SL/DP levels based on volatility. Built-in performance tracking shows win/loss stats, PP1/PP2 hits, and success rates — all updated live. Key Features: Buy/Sell signals with adaptive volatility bands Real-time TP/SL/DP levels based on ATR Built-in MA Filter with optional ATR/StdDev volatility Performance stats panel (Success, Profit/Loss, PP1/PP2) Alerts via popup, sound, push, or e
FX Trend NG:次世代マルチマーケット・トレンドインテリジェンス 概要 FX Trend NG は、複数の時間足に対応したプロフェッショナル向けトレンド分析およびマーケット監視ツールです。 市場全体の構造を数秒で把握することができます。 複数のチャートを切り替える必要はありません。どの銘柄がトレンド中なのか、どこでモメンタムが弱まっているのか、そしてどの時間足で強い整合性があるのかを瞬時に確認できます。 ローンチ特別オファー – FX Trend NG を $30(6ヶ月) または $80 永久ライセンス でご利用いただけます。 すでに Stein Investments のユーザーですか? -> メッセージを送信 して、プライベートグループへアクセスしてください。 セットアップや詳細情報が必要ですか? -> Stein Investments 公式ページ をご覧ください。 1. FX Trend NG が他と異なる理由 3ステート・トレンドロジック ― Buy と Sell だけではない • 多くのインジケーターは Buy または Sell の2状態のみを表示します。
Power Candles V3 - 自己最適化型強弱インジケーター Power Candles V3は 、通貨や銘柄の強さを、適用されたすべてのチャート上で実行可能なトレードプランに変換します。単にローソク足を色分けするだけでなく、バックグラウンドでリアルタイムの自動最適化を実行し、目の前の銘柄に対して最適なストップロス、テイクプロフィット、およびシグナルの閾値を提示します。ワンクリックで実取引に適用でき、エントリーポイント、ストップロス、テイクプロフィットのラインが正確な価格位置にチャート上に表示され、方向性を示すアラートがリアルタイムで発動します。 このツールは、Stein Investmentsのエコシステムの一部です。  18種類以上のツールをすべて閲覧し、AIを活用したセットアップの推奨事項を入手し、  https://stein.investments でコミュニティに参加しましょう クローズしたバーごとに3,000回以上のトレードシミュレーション。9つの強さの状態。2つの戦略を並行してテスト。勝率の高い設定をワンクリックで適用。 なぜこれが必要なのか ほとんどの強
この製品は 2026 年の市場向けに更新され、最新の MT5 ビルドに最適化されています。 価格更新のお知らせ: Atomic Analyst は現在 $99 で提供されています。 次の 30 件の購入 後、価格は $199 に上がります。 特別オファー: Atomic Analyst を購入後、私にプライベートメッセージを送ることで、 Smart Universal EA を無料 で受け取り、Atomic Analyst のシグナルを自動売買に変えることができます。 Atomic Analyst は、リペイントなし、再描画なし、遅延なしの Price Action トレーディングインジケーターで、手動取引、シグナルの明確化、EA 自動化のために設計されています。 User manual: settings, inputs and strategy. 価格行動、強さ、モメンタム、マルチタイムフレーム方向、高度なフィルターを分析し、トレーダーがノイズを減らし、弱いセットアップを避け、より構造化された取引判断を行えるようにします。 このインジケーターは、複雑な市場計算をシンプルな視覚シ
UZFX {SSS} スキャルピング・スマートシグナル MT5は、変動の激しい市場において正確かつリアルタイムのシグナルを求めるスキャルパー、デイトレーダー、スイングトレーダー向けに設計された、リペイントしない高性能な取引インジケーターです。(UZFX-LABS)によって開発されたこのインジケーターは、価格行動分析、トレンド確認、スマートフィルタリングを組み合わせることで、すべての通貨ペアおよび時間軸において、高確率の売買シグナルを生成します。 推奨* 最適な時間足:15分足以上。 {1時間足}が私のお気に入りです。そして、その成果は驚くべきものです...! 注:{ LTL 164343 }インジケーターと組み合わせることで、シグナルの勝率を高めることができます。 LTLシグナルでトレンドを判断し、SSSシグナルをエントリーシグナルとして活用してください。 このアプローチにより勝率が最大化され、誤ったシグナルの発生を防ぐことができます。 主な機能 スマートシグナル検出 – 強力なトレンド反転や継続パターンを正確に特定します。 マルチタイムフレーム・スキャルピング – すべての時間
Gann Made Easy   は、ミスター・ギャンの理論を使用した取引の最良の原則に基づいた、プロフェッショナルで使いやすい外国為替取引システムです。 W・D・ガン。このインジケーターは、ストップロスとテイクプロフィットレベルを含む正確な買いと売りのシグナルを提供します。 PUSH通知を利用して外出先でも取引可能です。 ご購入後、取引方法の説明と優れた追加インジケーターを無料で入手するには、私にご連絡ください! おそらく、ギャンの取引手法についてはすでに何度も聞いたことがあるでしょう。通常、ギャンの理論は初心者のトレーダーだけでなく、すでにある程度の取引経験がある人にとっても非常に複雑なものです。なぜなら、ギャンの取引手法は理論的にはそれほど簡単に適用できるものではないからです。私はその知識を磨き、最良の原則を私の外国為替インジケーターに組み込むために数年を費やしました。 このインジケーターは非常に簡単に適用できます。必要なのは、それをチャートに添付し、簡単な取引推奨事項に従うだけです。このインジケーターは常に市場分析の仕事を行い、取引の機会を探します。適切なエントリーポイントを検
SmartScalping is a powerful trading companion designed to generate high-probability entry signals with dynamic TP/SL/DP levels based on volatility. Built-in performance tracking shows win/loss stats, PP1/PP2 hits, and success rates — all updated live. Key Features: Buy/Sell signals with adaptive volatility bands Real-time TP/SL/DP levels based on ATR Built-in MA Filter with optional ATR/StdDev volatility Performance stats panel (Success, Profit/Loss, PP1/PP2) Alerts via popup, sound, push, or e
GEM Signal Pro GEM Signal Pro は、MetaTrader 5 向けのトレンドフォロー型インジケーターです。より明確なシグナル、より整理されたトレードセットアップ、そして実用的なリスク管理をチャート上で確認したいトレーダーのために設計されています。 単純な矢印だけを表示するのではなく、GEM Signal Pro はトレード全体の考え方を、より見やすく分かりやすい形で表示します。条件が確認されると、インジケーターはエントリー価格、ストップロス、利確目標をチャート上に表示し、トレードセットアップをより効率的に確認できるようにします。 動作の仕組み このインジケーターは、まず内部ロジックに基づいて有効なシードシグナルを検出します。 確認条件が満たされると、GEM Signal Pro はチャート上に完全なセットアップを表示します。これにより、トレーダーはトレード構造をより明確に把握し、手作業による分析を減らすことができます。 チャート上のトレードレベル 確認済みシグナルに対して、GEM Signal Pro は以下を表示できます。 エントリー価格 ストップロス テ
ARIPoint
Temirlan Kdyrkhan
1 (1)
ARIPoint is a powerful trading companion designed to generate high-probability entry signals with dynamic TP/SL/DP levels based on volatility. Built-in performance tracking shows win/loss stats, PP1/PP2 hits, and success rates all updated live. Key Features: Buy/Sell signals with adaptive volatility bands Real-time TP/SL/DP levels based on ATR Built-in MA Filter with optional ATR/StdDev volatility Performance stats panel (Success, Profit/Loss, PP1/PP2) Alerts via popup, sound, push, or email Cu
MasterTrend Indicator for MT5 A powerful trend-following and signal-evaluation tool MasterTrend   is a custom MT5 indicator that combines Moving Averages and ATR-based risk/reward logic to generate clear buy/sell signals. It visualizes dynamic SL/TP levels, evaluates past trade outcomes, and displays win/loss statistics in a clean on-chart panel. Key features include: Buy/Sell signals based on MA crossovers ATR-based SL/TP1/TP2/TP3 levels with visual lines and labels Signal outcome tracking wit
Crystal Heikin Ashi Signals - Professional Trend & Signal Detection Indicator Advanced Heikin Ashi Visualization with Intelligent Signal System for Manual & Automated Trading Final Price: $149 ---------> Price goes up $10 after every 10 sales . Limited slots available — act fast . Overview Crystal Heikin Ashi Signals is a professional-grade MetaTrader 5 indicator that combines pure Heikin Ashi candle visualization with an advanced momentum-shift detection system. Designed for both manual traders
Azimuth Pro
Ottaviano De Cicco
5 (7)
Azimuth Pro V2:MT5向けシンセティック・フラクタル構造分析と確認済みエントリー 概要 Azimuth Pro は Merkava Labs によるマルチレベルスイング構造インジケーターです。4つのネストされたスイングレイヤー、スイングアンカーVWAP、ABCパターン検出、3タイムフレーム構造フィルタリング、そして確定バーでの確認済みエントリー — 1つのチャートで、ミクロスイングからマクロサイクルまでを網羅するワークフロー。 これはブラインドシグナル製品ではありません。ロケーション、コンテキスト、タイミングを重視するトレーダーのための構造ファーストワークフローです。 V2発売記念オファー — Azimuth Pro V2をUSD 399で(次の100本)。最終価格:USD 499。 1. V2での変更点 シンセティック・マルチタイムフレームエンジン 上位タイムフレーム分析をMeridian Proと同じ独自のシンセティックアーキテクチャで一から再構築。よりクリーンなHTFコンテキスト、安定したライブ動作、従来のMTF同期問題なし。シンセティックエンジンは 固定比率タ
ScalpPoint is a powerful trading companion designed to generate high-probability entry signals with dynamic TP/SL/DP levels based on volatility. Built-in performance tracking shows win/loss stats, PP1/PP2 hits, and success rates — all updated live. Key Features: Buy/Sell signals with adaptive volatility bands Real-time TP/SL/DP levels based on ATR Built-in MA Filter with optional ATR/StdDev volatility Performance stats panel (Success, Profit/Loss, PP1/PP2) Alerts via popup, sound, push, or emai
Reversion King Indicator
Eugen-alexandru Zibileanu
5 (4)
新たな王者が登場 - インジケーター + 注文管理表示(TP1 + TP2 + TP3)+ オプションのTelegramシグナル送信機能付き(無料) (完全なトレード&シグナルシステム) ゴールド向け最高のEA: Gold Slayer このインジケーターには、高度な戦略、カスタマイズ可能な注文管理システム、そしてエンベロープ拡張を組み合わせた平均回帰システムが搭載されています。さらに、RSIなど複数のインテリジェントな確認フィルターによって、高確率の反転エントリーをBUY・SELLシグナルとして検出します。 単にトレードを学ぶだけでなく、複数ポジションを効果的に管理し、過去に利益を出しているオープンポジションで損失トレードをカバーする方法も学べます。 M5向けに構築・最適化されており、流動性が高くシグナルの精度が安定しているBTCUSDとXAUUSDで優れたパフォーマンスを発揮します。 このインジケーターは、ATRを基に自動計算されたエントリー、ストップロス、テイクプロフィットレベルを備えた明確なLong・Shortシグナルを提供するため、リスク管理が最初から組み込まれています。 マ
MT4版もご用意しています https://www.mql5.com/ja/market/product/170617  M30/H1/H4スイング版もあります M5/M15では取りきれない大きな波を狙いたい方へ。 Gold Signal Swing Pro(M30/H1/H4対応)を販売中。 1トレードで$20〜$80+の値幅を狙う。 https://www.mql5.com/en/market/product/177643 KURAMA GOLD SIGNAL PRO(MT5版)— 7層フィルター搭載 XAUUSD完全トレードシステム リペイントなし。リドローなし。ラグなし。すべてのサインは確定後に変わりません。 購入者限定特典:買い切りライセンスをご購入いただいた方に、AI Zone Radar($59相当)+PDFマニュアルを無料プレゼント。購入後にMQL5でメッセージをお送りください。 AI Zone Radar:
Quant Direction は、3次元の市場分析ツールです。完全に客観的なアルゴリズムベースの市場分析を提供し、様々なパラメータにわたる正確なパーセンテージ偏差を同時に算出します。高度なAI搭載モデリングツールで開発され、厳密なテストを経て開発されたこのアルゴリズムは、かつてない精度で市場を分析するように設計されています。プラットフォーム上では、あらゆる通貨ペアや金融商品を分析できます。 短期取引、デイトレード、スイングトレードなど、どのような取引スタイルに も、Quant Directionは最適な選択肢です。 オペレーターの本当の利点 Quant Directionの真の利点は、感情、眼精疲労、過剰分析を完全に排除できる点にあります。方向性を探るために何十ものチャートを手作業で精査したり、自分の好みを常に疑ったりする必要がなくなります。このシステムは、8つの時間間隔(5ヶ月から月単位まで)をミリ秒単位で処理します。あらゆる瞬間に市場を支配している主体を正確に明らかにし、常に成功確率が最も高い方向で取引できるようにします。 市場分析の3つの側面 このアルゴリズムは市場を3つの
Meridian Pro
Ottaviano De Cicco
5 (2)
Meridian Pro 2.00:MT5向けプロ仕様マルチタイムフレーム・トレンドマトリクス Meridian Pro 2.00 は、MetaTrader 5 向けのプロ仕様の適応型トレンドマトリクスです。オリジナルの Meridian トレンドエンジン、クリーンなチャート ribbon、確定足ベースのシグナル矢印、8時間足 dashboard、Fuel momentum、weighted consensus、synthetic HTF processing、そしてチャート上に直接表示される上位足コンテキストラインを統合します。 目的はシンプルです。現在のトレンド、マルチタイムフレーム構造、強度、momentum、EA-ready 状態を、複数チャートに無関係なインジケータを重ねるのではなく、1つの整理された workflow で読むことです。 Meridian Pro の違い 1つの適応型エンジン - 同じ volatility-aware Meridian ロジックを M1 から W1 まで適用します。 Synthetic HTF architecture - 上位足行は下位足デ
この製品は 2026 年の市場向けに更新され、最新の MT5 ビルドに最適化されています。 価格更新のお知らせ: MENA Trend Scanner Pro は現在 $99 で提供されています。 次の 30 件の購入 後、価格は $199 に上がります。 特別オファー: MENA Trend Scanner Pro を購入後、私にプライベートメッセージを送ることで、 Smart Universal EA を無料 で受け取り、MENA Trend のシグナルを自動売買に変えることができます。 まず、このトレーディングシステムはリペイントなし、再描画なし、遅延なしのインジケーターであり、手動取引とロボット取引の両方に理想的であることを強調しておきます。 Online course, user manual, and downloadable presets included. MENA Trend Scanner Pro は、複数のシンボルと複数の時間足を同時に分析する完全な multi-pair scanner dashboard として機能します。手動で何度もチャートを切り替える代
Market Structure Order Block Dashboard MT5 は、市場構造と主要な価格反応ゾーンをチャート上で直接読み取りたいトレーダー向けに設計された MT5 インジケーターです。BOS、ChoCH、オーダーブロック、Fair Value Gap (FVG)、流動性、Kill Zones、Volume Profile、そして素早い分析のためのコンパクトなダッシュボードを組み合わせています。 本インジケーターは、市場構造、ICT、Smart Money の概念を意思決定の枠組みとして使用するトレーダーを対象としています。トレンド継続、反転の可能性、価格の不均衡、流動性ターゲット、注目ゾーンをより構造的に特定する助けとなります。 購入者向けの付属リソース 購入後、MQL5 のプライベートメッセージにてご依頼いただくと、完全な PDF ユーザーガイドとパラメータ設定のヒントを提供いたします。MQL5 のプライベートメッセージによる直接的な技術サポート。 バージョン 1.20 では 2 つの重要な追加機能があります: Pending BOS / Pending Cho
MasterTrend Indicator for MT5 A powerful trend-following and signal-evaluation tool MasterTrend   is a custom MT5 indicator that combines Moving Averages and ATR-based risk/reward logic to generate clear buy/sell signals. It visualizes dynamic SL/TP levels, evaluates past trade outcomes, and displays win/loss statistics in a clean on-chart panel. Key features include: Buy/Sell signals based on MA crossovers ATR-based SL/TP1/TP2/TP3 levels with visual lines and labels Signal outcome tracking wit
作者のその他のプロダクト
RAlabs Arbitrage Parser — High-Precision Market Data Collector Reliable and efficient Expert Advisor for collecting real-time market data from MetaTrader 4 and MetaTrader 5 terminals. Designed for traders, quantitative analysts, and developers who need clean, structured price data for analysis, arbitrage, or algorithmic trading. Overview RAlabs Arbitrage Parser is a lightweight and fully autonomous tool that records streaming Bid/Ask prices into CSV files with millisecond precision. The EA ru
FREE
The indicator shows the time until the candle closes, as well as the server time on the current chart. Very easy to use, with only four settings.: Lable Location-the location of the timer on the graph; Display server time-to show the server time or not; Sound alert when the candle is closed-to use a sound signal when closing the candle or not; Color-the color of the timer digits. Other useful free and paid products can be viewed here: https://www.mql5.com/ru/users/raprofit/seller
FREE
Мой самый популярный и востребованный продукт здесь  https://www.mql5.com/ru/market/product/41605?source=Site+Market+Product+From+Author# Индикатор стрелочник идеален для торговли в боковике, очень точно показывает моменты перекупленности и перепроданности инструмента, с дополнительными фильтрами также можно использовать для торговли по тренду. На экран выводятся стрелки сигнализирующие о развороте тренда,  направление стрелки показывает дальнейшее направление торговли, также имеется звуковое о
FREE
(You can order any custom arbitrage bot from us, for both cross-terminal and cross-exchange arbitrage. You can find our other products, both paid and free, via this link:   https://www.mql5.com/en/users/raprofit/seller ) Multi-Symbol & Multi-Broker CSV Logger Short Description:   Universal quote parser with millisecond precision!   Collect streaming data (Ask/Bid) for an unlimited number of assets simultaneously. The perfect tool for data scientists, arbitrageurs, and traders using Python, E
FREE
The indicator displays candlesticks of a given senior timeframe, on smaller timeframes TF_Bar - selection of the senior timeframe, based on which candlesticks on the current one will be displayed.; Number_of_Bars - the maximum number of bars up to which the indicator will be calculated.; Color_Up - color display of bullish candlesticks; Color_Down - color display of bearish candlesticks; Widht_lines - the thickness of the indicator lines. Other useful free and paid products can be viewed
FREE
Основные отличия и преимущества индикатора Volume every day от похожего продукта  Volume Profile V6 В Volume every day можно параметром Range period  задать временной диапазон построения профиля, а параметром Range count задать количество профилей данных диапазонов. Например, на втором скрине  Range period=1Day, а Range count=10 - это значит, что профиль будет строиться на периоде один день, десять последних дней. Важно, что переключение тайм фрейма графика не влияет на построение профиля, что т
"Smart Trend and Smart Oscillator" are two indicators in one. Smart trend shows the current trend direction. Using the settings, you can make sure that, for example, on the M15 timeframe, the trend direction is shown from the H1 or D1 timeframe, and so on. The smart oscillator shows overbought and oversold zones. This indicator consists of several oscillators that show the best result. The readings for all indicators are summed up and the average value zone is painted over in the selected col
フィルタ:
Mase
1779
Mase 2026.05.03 06:57 
 

very supportive seller and excellent value add for my trading! thx a lot

Andrey Kolesnik
21553
開発者からの返信 Andrey Kolesnik 2026.05.03 07:01
Thanks for the feedback. Mase!
Marco Scherer
3932
Marco Scherer 2025.12.04 07:28 
 

The indicator provides a lot of information, but it has one huge problem: when I apply it to my chart, I can no longer adjust my TP and SL by dragging them with the mouse, which is a massive issue for me.

Andrey Kolesnik
21553
開発者からの返信 Andrey Kolesnik 2025.12.04 22:45
Greetings to Marco Scherer! Thank you for your feedback. The indicator should not affect trading in any way, let's try to understand your situation. Put the indicator on the chart as you did earlier and try dragging TP and SL, if it doesn't work out, look at what will be written in the log and send me a screenshot, you can send it in private messages
BMWbq7070
302
BMWbq7070 2025.12.02 18:07 
 

ユーザーは評価に対して何もコメントを残しませんでした

Andrey Kolesnik
21553
開発者からの返信 Andrey Kolesnik 2025.12.02 23:00
Greetings 252 BMWbq7070. Thank you for your feedback and rating!
This is a sign that you need to switch to mt5 ), which is much more progressive than mt4
Wagner Ceide
76
Wagner Ceide 2025.10.23 23:33 
 

ola Andrey.... comprei o indicador, tem um pdf explicando , wagner939@gmail.com, obrigado

Andrey Kolesnik
21553
開発者からの返信 Andrey Kolesnik 2025.10.24 08:21
Добрый день Wagner Ceide ! Благодарю за отзыв! "Есть pdf-файл с объяснением"-это вопрос или все таки утверждение?)
削除済み 2024.12.12 13:08 
 

ユーザーは評価に対して何もコメントを残しませんでした

Andrey Kolesnik
21553
開発者からの返信 Andrey Kolesnik 2024.12.13 01:29
Thank you, Antonio!
Niklas Templin
22822
Niklas Templin 2023.12.26 19:21 
 

ユーザーは評価に対して何もコメントを残しませんでした

Andrey Kolesnik
21553
開発者からの返信 Andrey Kolesnik 2024.12.13 01:31
I'm glad you liked the indicator, Niklas
Indigotom
71
Indigotom 2023.08.17 11:10 
 

Sehr nützliches und hilfreiches Programm. Der Funktionsumfang ist fantastisch. Und das zu einem wirklich guten Preis!!

Affiq A Ghani
916
Affiq A Ghani 2023.08.01 14:41 
 

ユーザーは評価に対して何もコメントを残しませんでした

Andrey Kolesnik
21553
開発者からの返信 Andrey Kolesnik 2023.08.02 14:38
Hello. you need to put Between lines in the first setting. I attached a screenshot in the discussions
Nikolai Fomin
180
Nikolai Fomin 2023.04.17 06:59 
 

ユーザーは評価に対して何もコメントを残しませんでした

dapac
464
dapac 2022.11.13 19:37 
 

Extremely useful.

Ikaryforyou
58
Ikaryforyou 2022.07.21 16:16 
 

ユーザーは評価に対して何もコメントを残しませんでした

Bruno Cirilo
57
Bruno Cirilo 2022.06.20 13:04 
 

ユーザーは評価に対して何もコメントを残しませんでした

Eled1111
14
Eled1111 2022.01.23 13:53 
 

ユーザーは評価に対して何もコメントを残しませんでした

mehmetharuncmn
54
mehmetharuncmn 2022.01.20 14:37 
 

ユーザーは評価に対して何もコメントを残しませんでした

Andronis28
14
Andronis28 2021.11.03 20:57 
 

ユーザーは評価に対して何もコメントを残しませんでした

Evgeny Belyaev
92162
Evgeny Belyaev 2021.10.01 22:44 
 

ユーザーは評価に対して何もコメントを残しませんでした

Eduardo Aparizi
228
Eduardo Aparizi 2021.09.27 07:09 
 

ユーザーは評価に対して何もコメントを残しませんでした

ian v
23
ian v 2021.09.10 10:36 
 

ユーザーは評価に対して何もコメントを残しませんでした

Borgen79
17
Borgen79 2021.06.26 20:51 
 

ユーザーは評価に対して何もコメントを残しませんでした

SerMamonov
14
SerMamonov 2021.05.21 15:26 
 

ユーザーは評価に対して何もコメントを残しませんでした

12
レビューに返信