Volume Profile V6
- Indicatori
- Versione: 2.18
- Aggiornato: 5 maggio 2026
- Attivazioni: 9

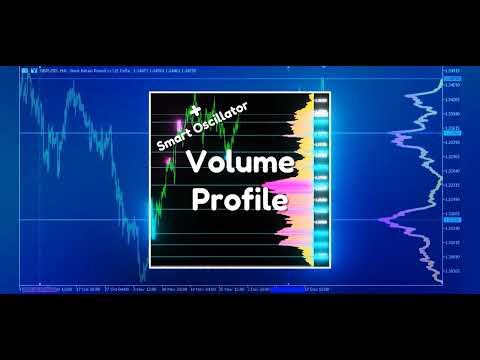
Market Volume Profile indicator + Smart Oscillator. Funziona su quasi tutti gli strumenti — coppie di valute, azioni, futures, criptovalute — utilizzando sia volumi reali che volumi tick. È possibile impostare l’intervallo del profilo automaticamente (ad esempio una settimana, un mese, ecc.) oppure manualmente spostando i limiti (due linee verticali: rossa e blu). Viene visualizzato sotto forma di istogramma. La larghezza dell’istogramma a un determinato livello rappresenta, in modo approssimativo, il numero di operazioni eseguite a quel livello. Il parametro "Mode level line color" consente la visualizzazione automatica dei livelli di volume più significativi, dai quali il prezzo ha un’alta probabilità di reagire, mentre il parametro "Maximum color (POC)" mostra separatamente il livello con il volume più alto all’interno dell’intervallo selezionato.
Lo Smart Oscillator mostra le zone di ipercomprato e ipervenduto. Analizza le informazioni provenienti da diversi indicatori e, sulla base dei dati elaborati, colora le zone corrispondenti.
Nella sezione Volume every day, il parametro Range period consente di impostare l’intervallo temporale per la costruzione del profilo, mentre il parametro Range count definisce il numero di tali intervalli. Ad esempio, Range period = 1Day e Range count = 10 significa che il profilo verrà costruito su un periodo di un giorno per gli ultimi dieci giorni. È importante notare che il cambio del timeframe del grafico non influisce sul calcolo del profilo, il che rappresenta un ulteriore vantaggio di questo indicatore.
L’indicatore è molto semplice e facile da usare, ma allo stesso tempo estremamente informativo. Con questo indicatore, il market maker non potrà nascondere le proprie operazioni di acquisto o vendita. Migliaia di utenti hanno già scaricato questo prodotto e non esiste alcuna recensione negativa.
Esempi di configurazioni per alcuni strumenti sono disponibili nella sezione discussioni, messaggio n°14.
Altri prodotti utili gratuiti e a pagamento sono disponibili qui:
https://www.mql5.com/ru/users/raprofit/seller
PARAMETERS:
Use Smart Oscillator — attiva/disattiva l’indicatore.
Smart Oscillator Alerts — blocco per attivare o disattivare le notifiche dei segnali dello Smart Oscillator. Le notifiche vengono generate solo per segnali confermati:
— START signal (inizio della zona) viene inviato dopo la chiusura della candela in cui la linea dell’oscillatore è già formata e non verrà ridisegnata
— END signal (fine della zona) viene inviato dopo la chiusura della prima candela in cui la linea è scomparsa
SmartAlertPopup — attiva/disattiva le notifiche popup nel terminale.
SmartAlertPush — attiva/disattiva le notifiche push su dispositivo mobile (richiede la configurazione preventiva del MetaQuotes ID nel terminale).
SmartAlertEmail — attiva/disattiva le notifiche email (richiede la configurazione preventiva dell’email nel terminale).
Use Volume Range — attiva/disattiva l’indicatore.
Range mode — metodo di definizione dei limiti dell’intervallo:
— Between lines - tra due linee
— Last minutes - ultimi RangeMinutes minuti
— Minitues to line - RangeMinutes fino alla linea destra
Range minutes — numero di minuti per RangeMode 1 e 2.
Mode step (points) — distanza minima tra i mode, regolata soggettivamente per ogni strumento.
Point scale — scala dei punti per il disegno dell’istogramma. Un valore più alto significa maggiore velocità ma minore precisione.
Volume type — tipo di volume: tick o reale. Il volume reale potrebbe non essere disponibile presso il broker, in tal caso l’indicatore non mostrerà dati.
Data source — fonte dati:
— Ticks (MT5 only) - tick dal server del broker (se disponibili)
— M1, M5, M15 - tick interpolati basati sulle candele del timeframe selezionato
Bar style — stile dell’istogramma:
— Lines - linee
— Empty bar - rettangoli vuoti
— Filled bar - rettangoli pieni
— Outline - contorno
— Color - colore
Histogram position — posizione dell’istogramma:
— Window left - lato sinistro della finestra
— Window right - lato destro della finestra
— Left outside - verso l’esterno dal limite sinistro
— Right outside - verso l’esterno dal limite destro
— Left inside - verso l’interno dal limite sinistro
— Right inside - verso l’interno dal limite destro
Color 1 — colore istogramma 1. Impostare None per usare il colore di sfondo del grafico.
Color 2 — colore istogramma 2. Impostare None per usare il colore di sfondo del grafico.
Line width — spessore della linea dell’istogramma.
Mode color (None=disable) — colore dei massimi locali di volume (mode). Impostare None per disattivare.
Maximum color (None=disable) — colore del livello massimo. Impostare None per disattivare.
VWAP color (None=disable) — colore del VWAP (prezzo medio ponderato per il volume). Impostare None per disattivare.
Mode level line color — colore delle linee di livello dei mode. Impostare None per disattivare.
Mode level line style — stile delle linee di livello dei mode.
Identifier — identificatore dell’indicatore, utilizzare valori diversi per più istanze sullo stesso grafico.
Use Volume every day — attiva/disattiva l’indicatore.
Range period — periodo, valori standard da M1 a MN1 (1, 5, 15, 30, 60, 240, 1440, 10080, 43200). MT5 supporta anche timeframe intermedi.
Range count — numero di intervalli.
Mode step (points) — distanza minima tra i mode.
Point scale — scala dei punti per il disegno dell’istogramma.
Volume type — tipo di volume.
Data source — fonte dati:
— Ticks (MT5 only)
— M1, M5, M15
Bar style — stile dell’istogramma:
— Lines
— Empty bar
— Filled bar
— Outline
— Color
Draw direction — direzione di disegno dell’istogramma — da sinistra a destra o da destra a sinistra.
Color 1 — colore 1.
Color 2 — colore 2.
Line width — spessore della linea.
Mode color (None=disable) — colore dei mode.
Maximum color (None=disable) — colore del livello massimo.
VWAP color (None=disable) — colore del VWAP.
Mode line width — spessore delle linee dei mode.
Identifier — identificatore dell’indicatore.


very supportive seller and excellent value add for my trading! thx a lot