Stop Loss Take Profit Drawer
- Indikatoren
- Version: 1.0
- Aktivierungen: 5

Einführung
Es ist gängige Praxis, dass professionelle Trader ihren Stop-Loss / Take-Profit vor ihren Brokern verbergen. Entweder weil sie ihre Strategie für sich behalten wollen oder weil sie befürchten, dass ihr Broker gegen sie arbeitet. Mit diesem Indikator werden die Stop-Loss- und Take-Profit-Punkte auf dem Produktchart anhand des Geldkurses eingezeichnet. So können Sie genau sehen, wann der Preis erreicht ist und ihn manuell schließen.
Verwendung
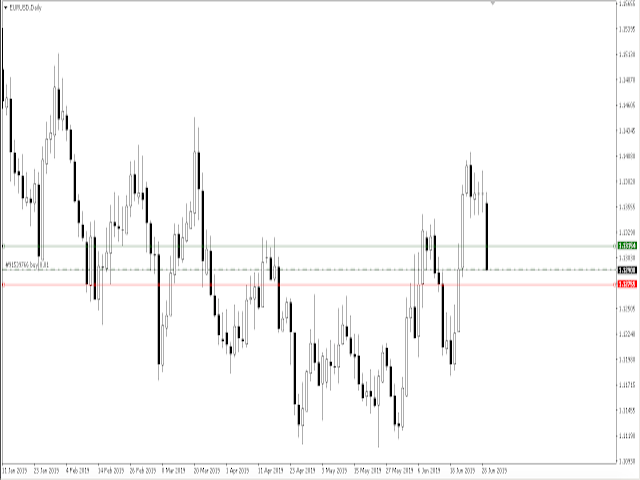
Sobald der Indikator an den Chart angehängt ist, scannt er die offenen Orders, um Linien für sie anzuhängen, und wartet dann auf eine neue Order. Sobald die Order geschlossen ist, entfernt der Indikator die Ziellinien aus dem Chart.
Der voreingestellte Stop-Loss-Wert für die rote Linie beträgt 15 Pips, während der Wert für die grüne Take-Profit-Linie 25 Pips beträgt. Sie können jeden beliebigen Wert für die Anfangswerte einstellen, aber auch die Linien auf dem Bildschirm für Ihre gewünschten Werte ziehen.
© 2019 Roy Meshulam