Renko Studio MT5
- Utilities
-
Ranjeet Kumar
 Data & AI Engineer | Algorithmic Trader | MQL4/MQL5 Developer | Python & Machine Learning Enthusiast
I am a passionate technology professional with 11+ years of experience in Data Engineering and Artificial Intelligence, along with 6+ years of experience in Algorithmic Trading and Financial Markets. - Version: 1.50
- Activations: 10
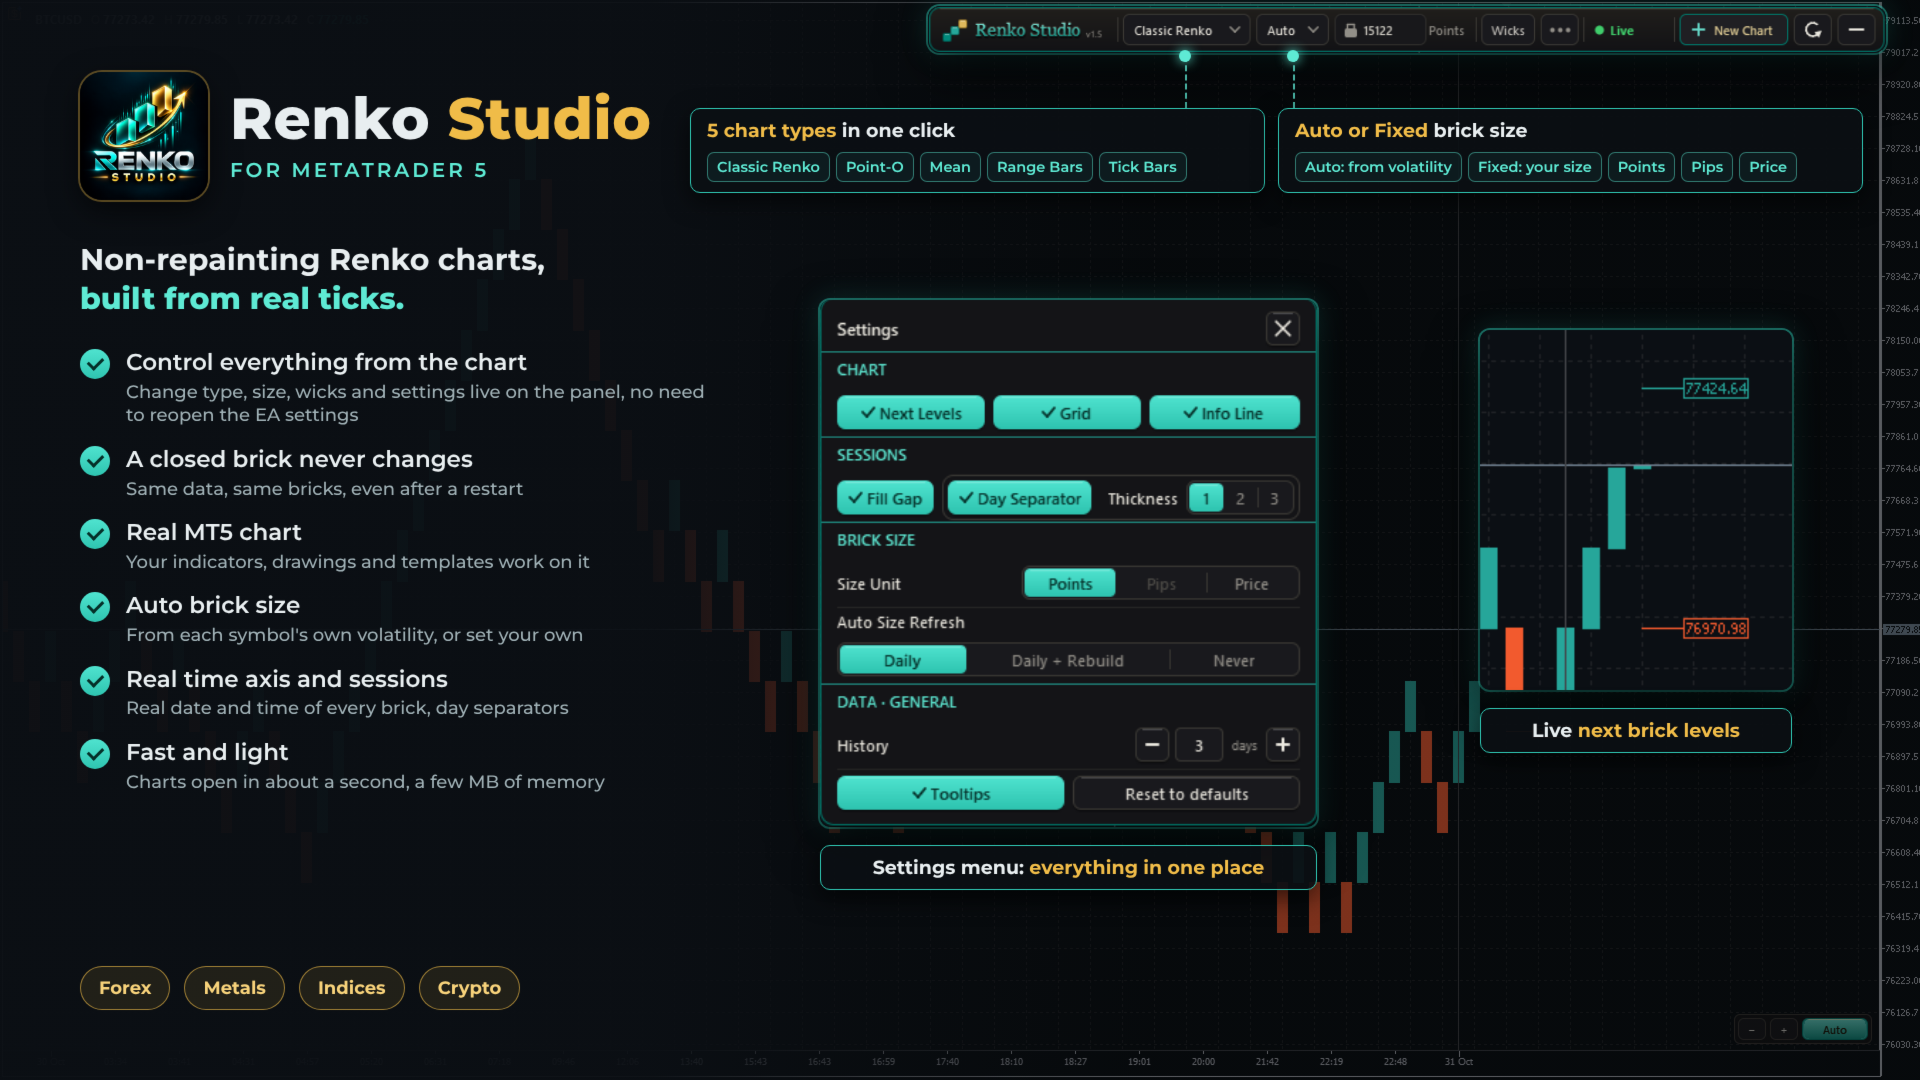
Fast, non-repainting Renko charts for MetaTrader 5: Classic, Point-O, Mean, Range Bars and Tick Bars.
A closed brick never changes. The Renko chart is a real MT5 chart, so your indicators and drawings work on it. Auto brick size, live next-brick levels, and charts ready in seconds.
Overview
Renko Studio turns any MT5 symbol into clean, fast Renko charts built from your broker's real tick data. The Renko chart is a real MT5 chart, so your indicators, drawings and templates work on it, and everything is controlled from a modern panel on the chart.
1. Non-Repainting
- A closed brick never changes. Not when you refresh, not after a restart, not when you reopen the terminal.
- Built from real ticks. Every brick comes from your broker's tick data, not from M1 candles.
- Same data, same bricks. The same ticks always produce exactly the same chart.
- Your changes, your choice. The chart is only rebuilt when you change a setting yourself, such as the chart type or brick size.
2. Fast and Optimized
- Opens in about a second. The chart window appears almost immediately; 3 days of history are ready in a few seconds.
- Very light on memory. After loading, the EA uses only a few MB.
- Smooth live updates. Bricks, the live bar and labels update without flicker.
- Light on your terminal. Several Renko charts can run together with low CPU use.
3. Five Chart Types
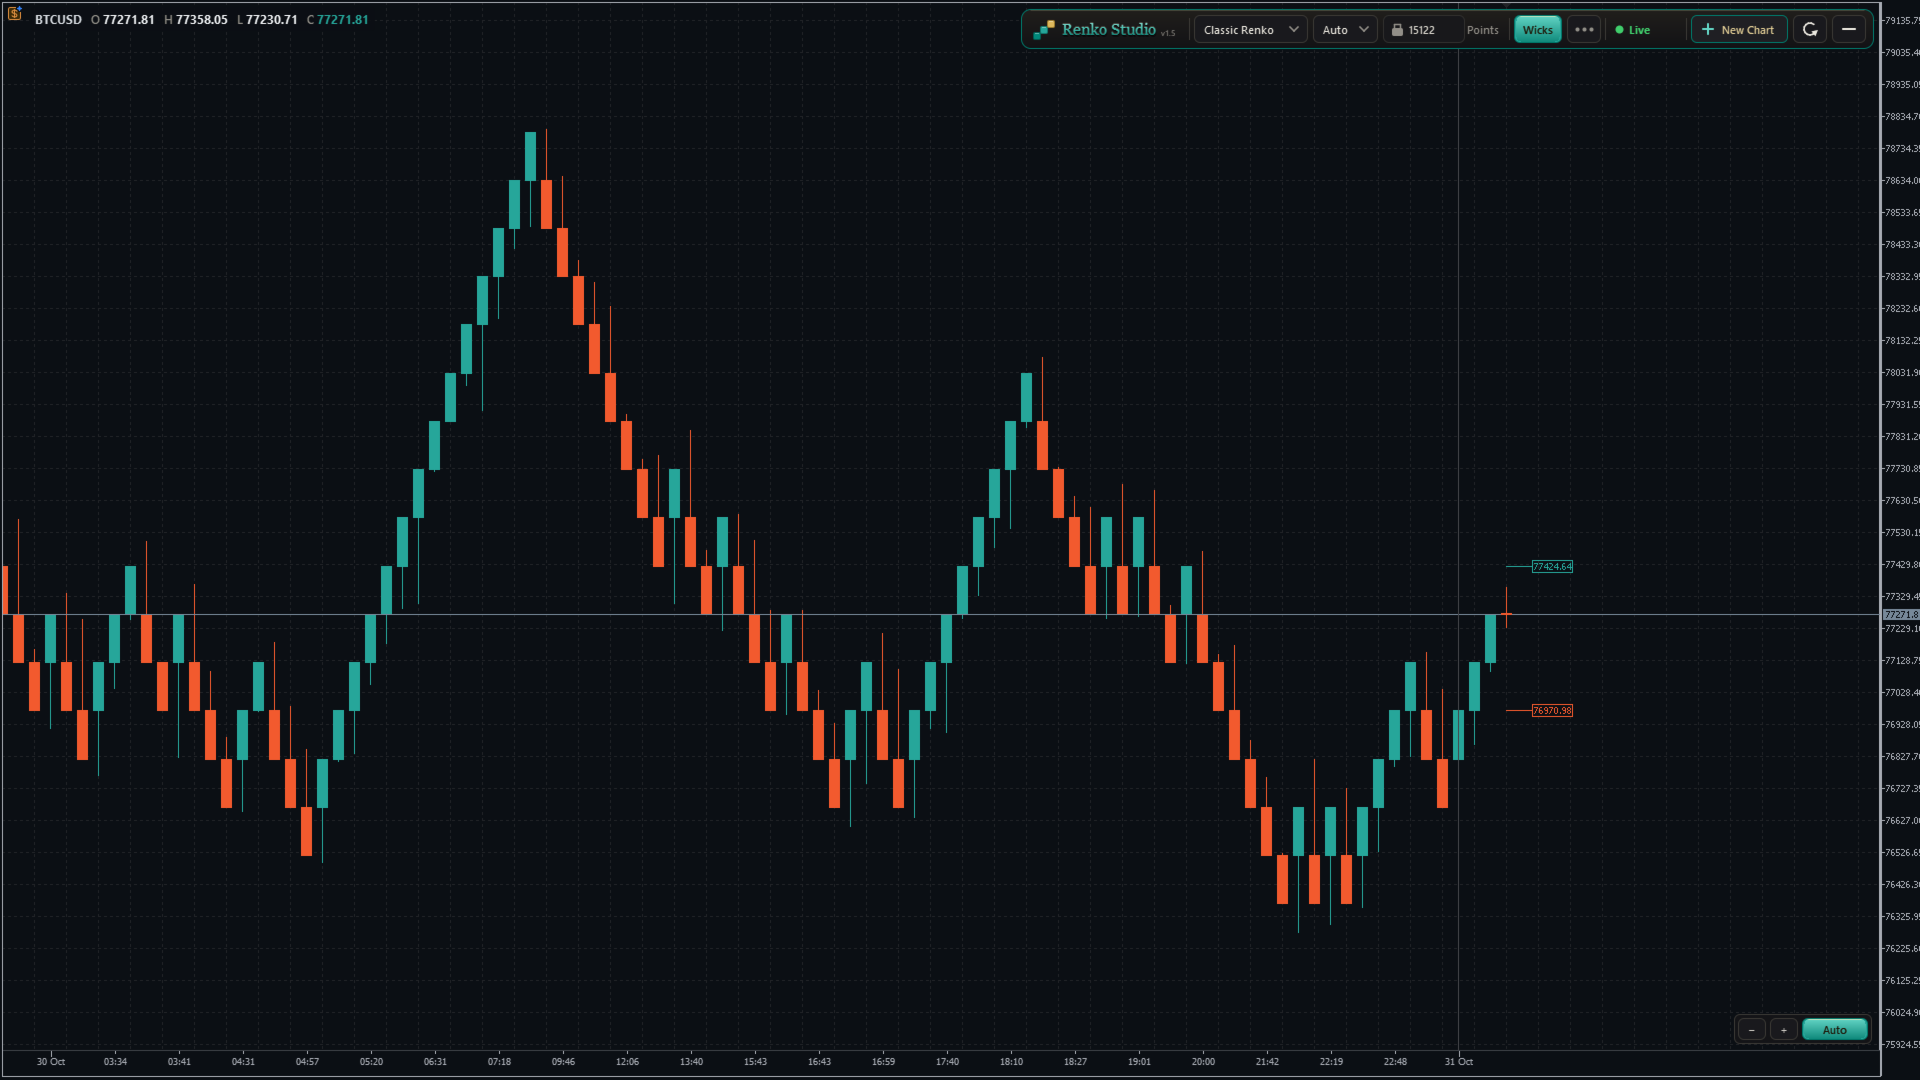
- Classic Renko: a new brick forms when price moves one brick size in the trend direction; a reversal needs two brick sizes. The standard Renko view.
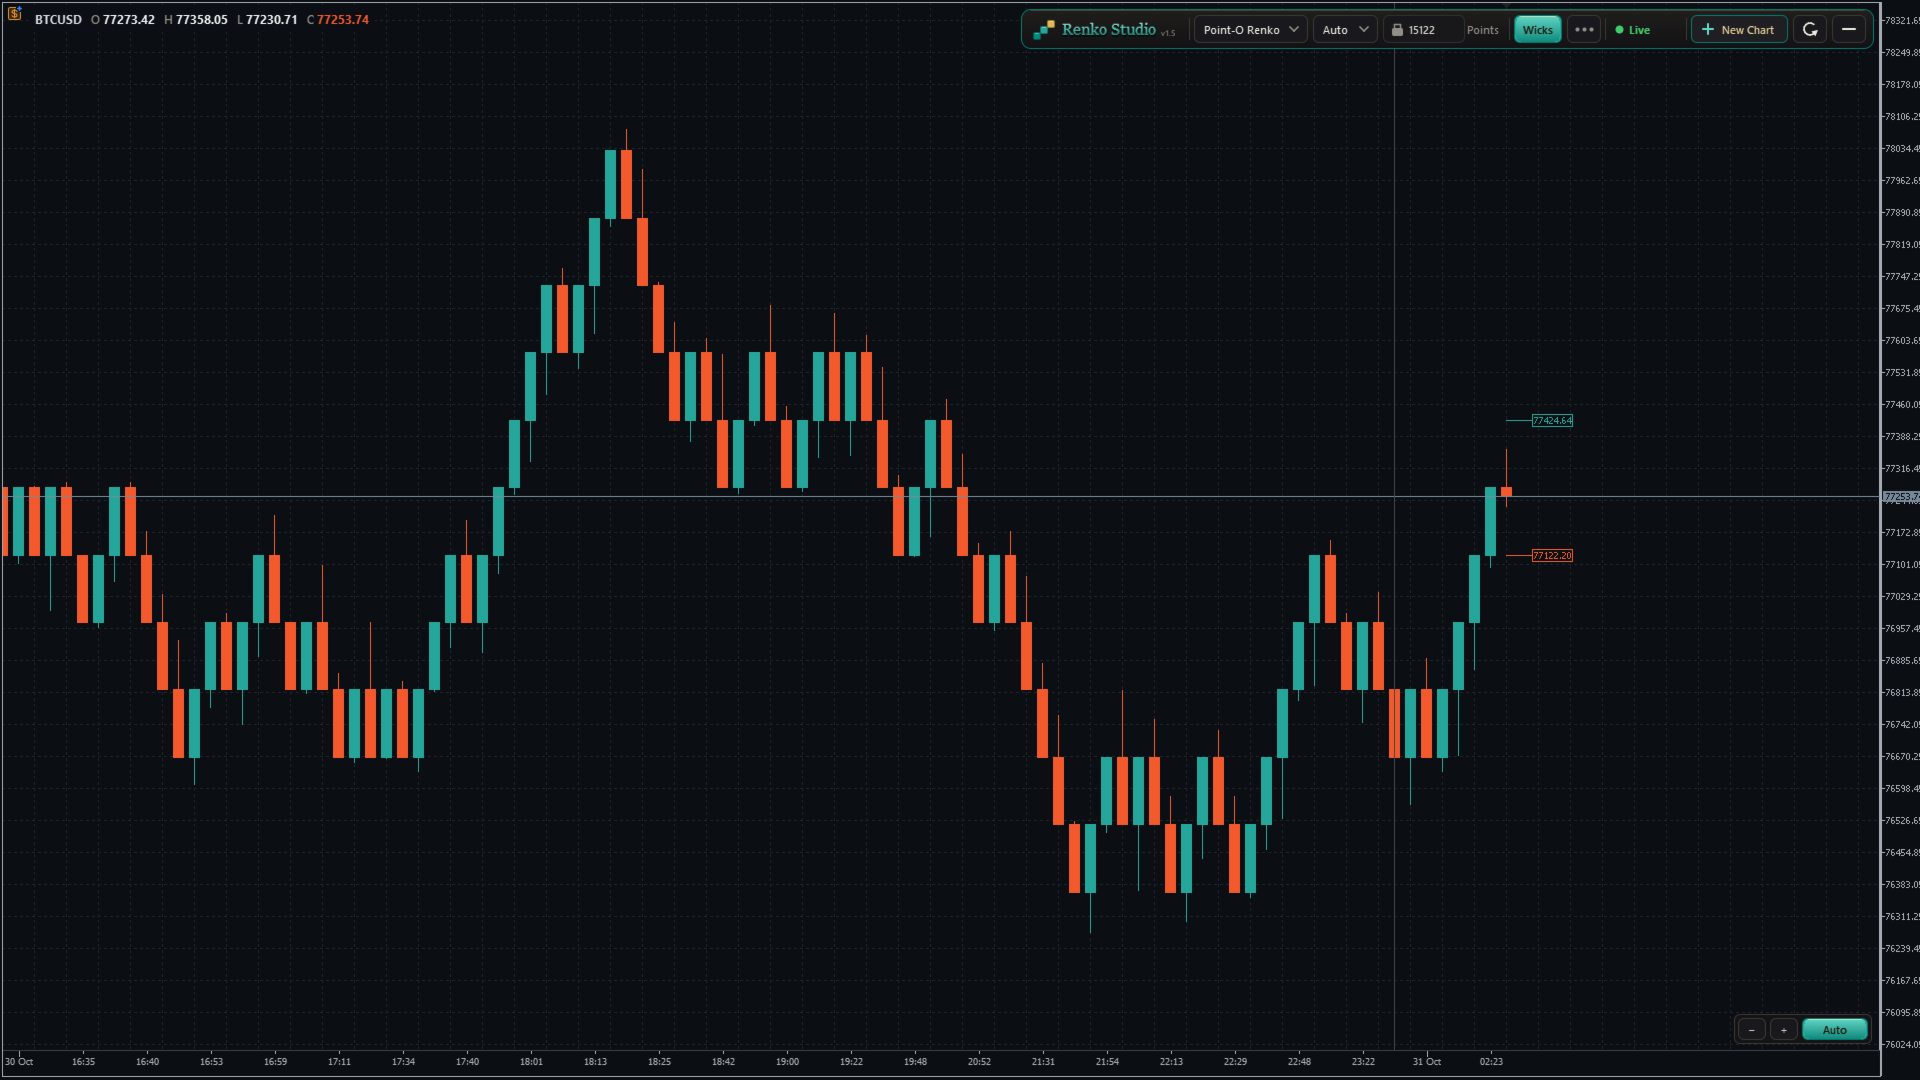
- Point-O Renko: reverses after a one-brick move, so it reacts faster to turns.
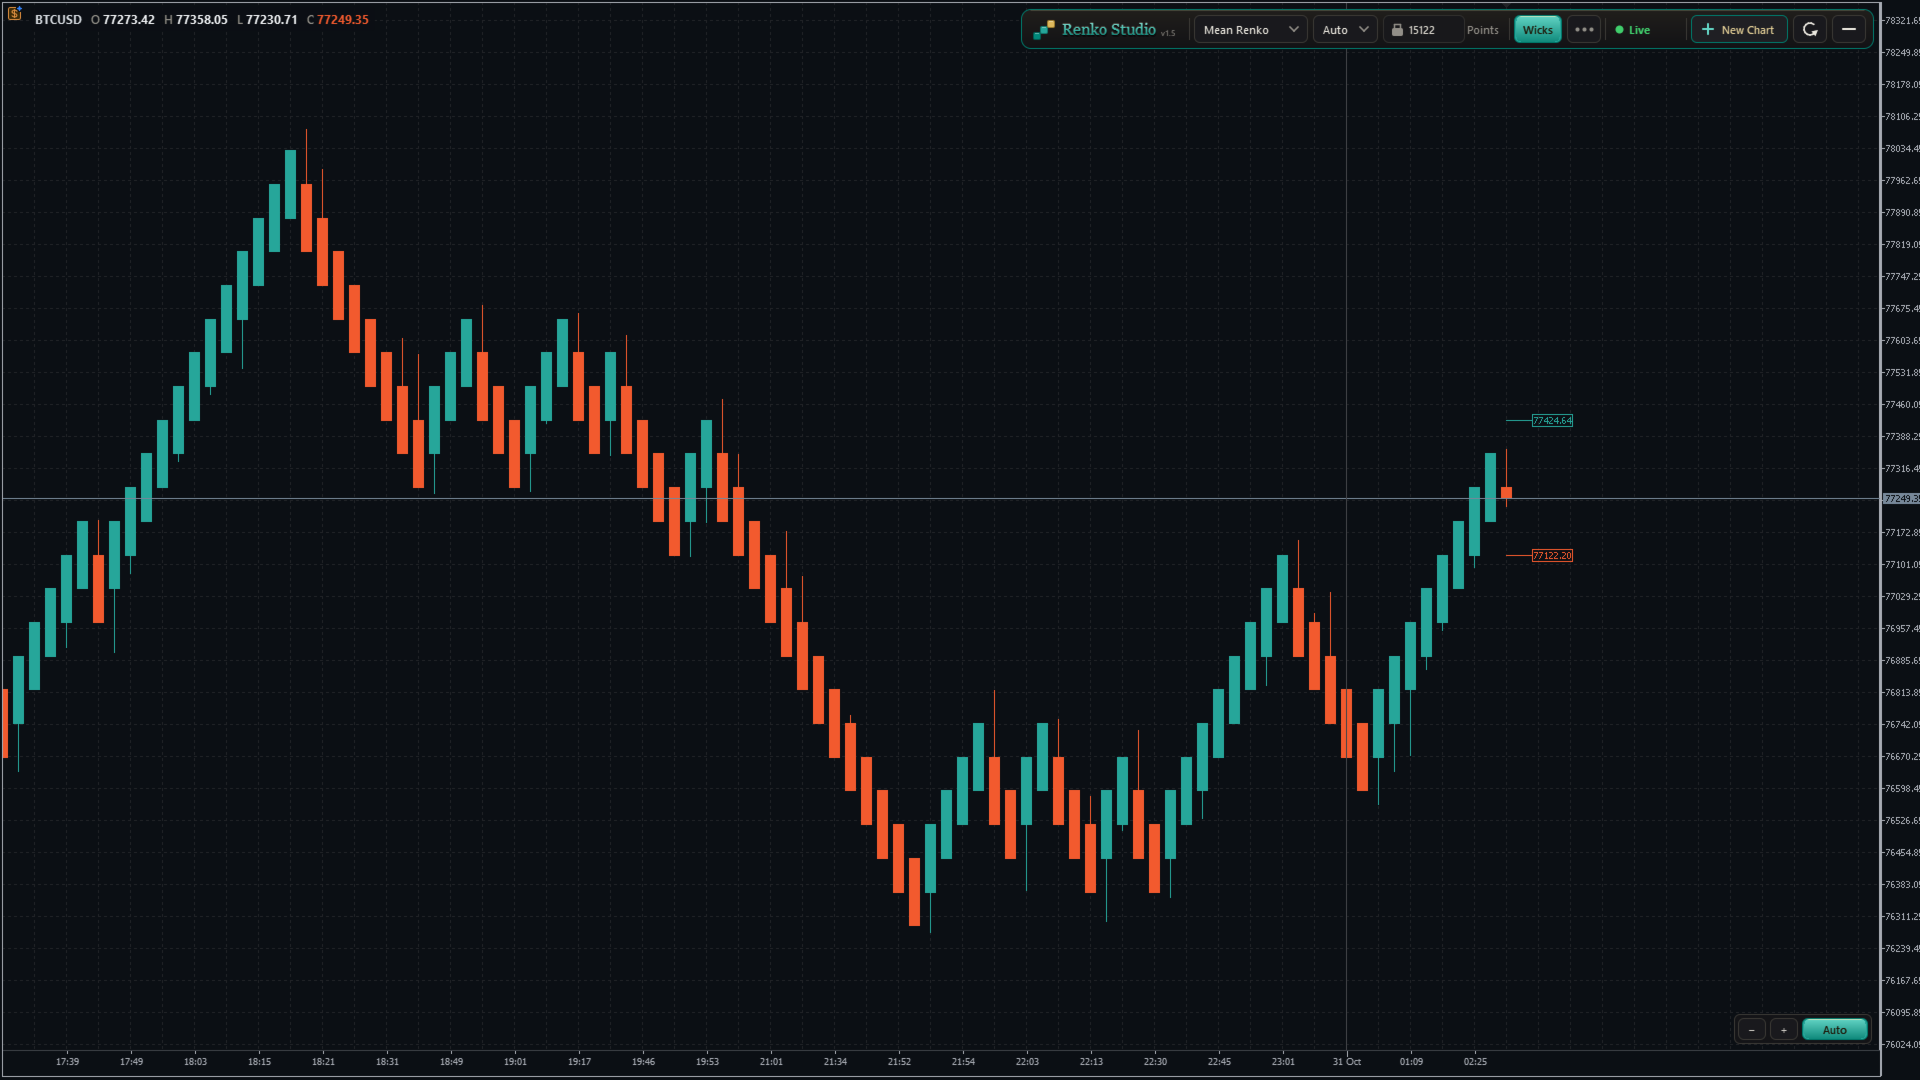
- Mean Renko: each new brick starts from the middle of the previous one, giving a smoother trend view.
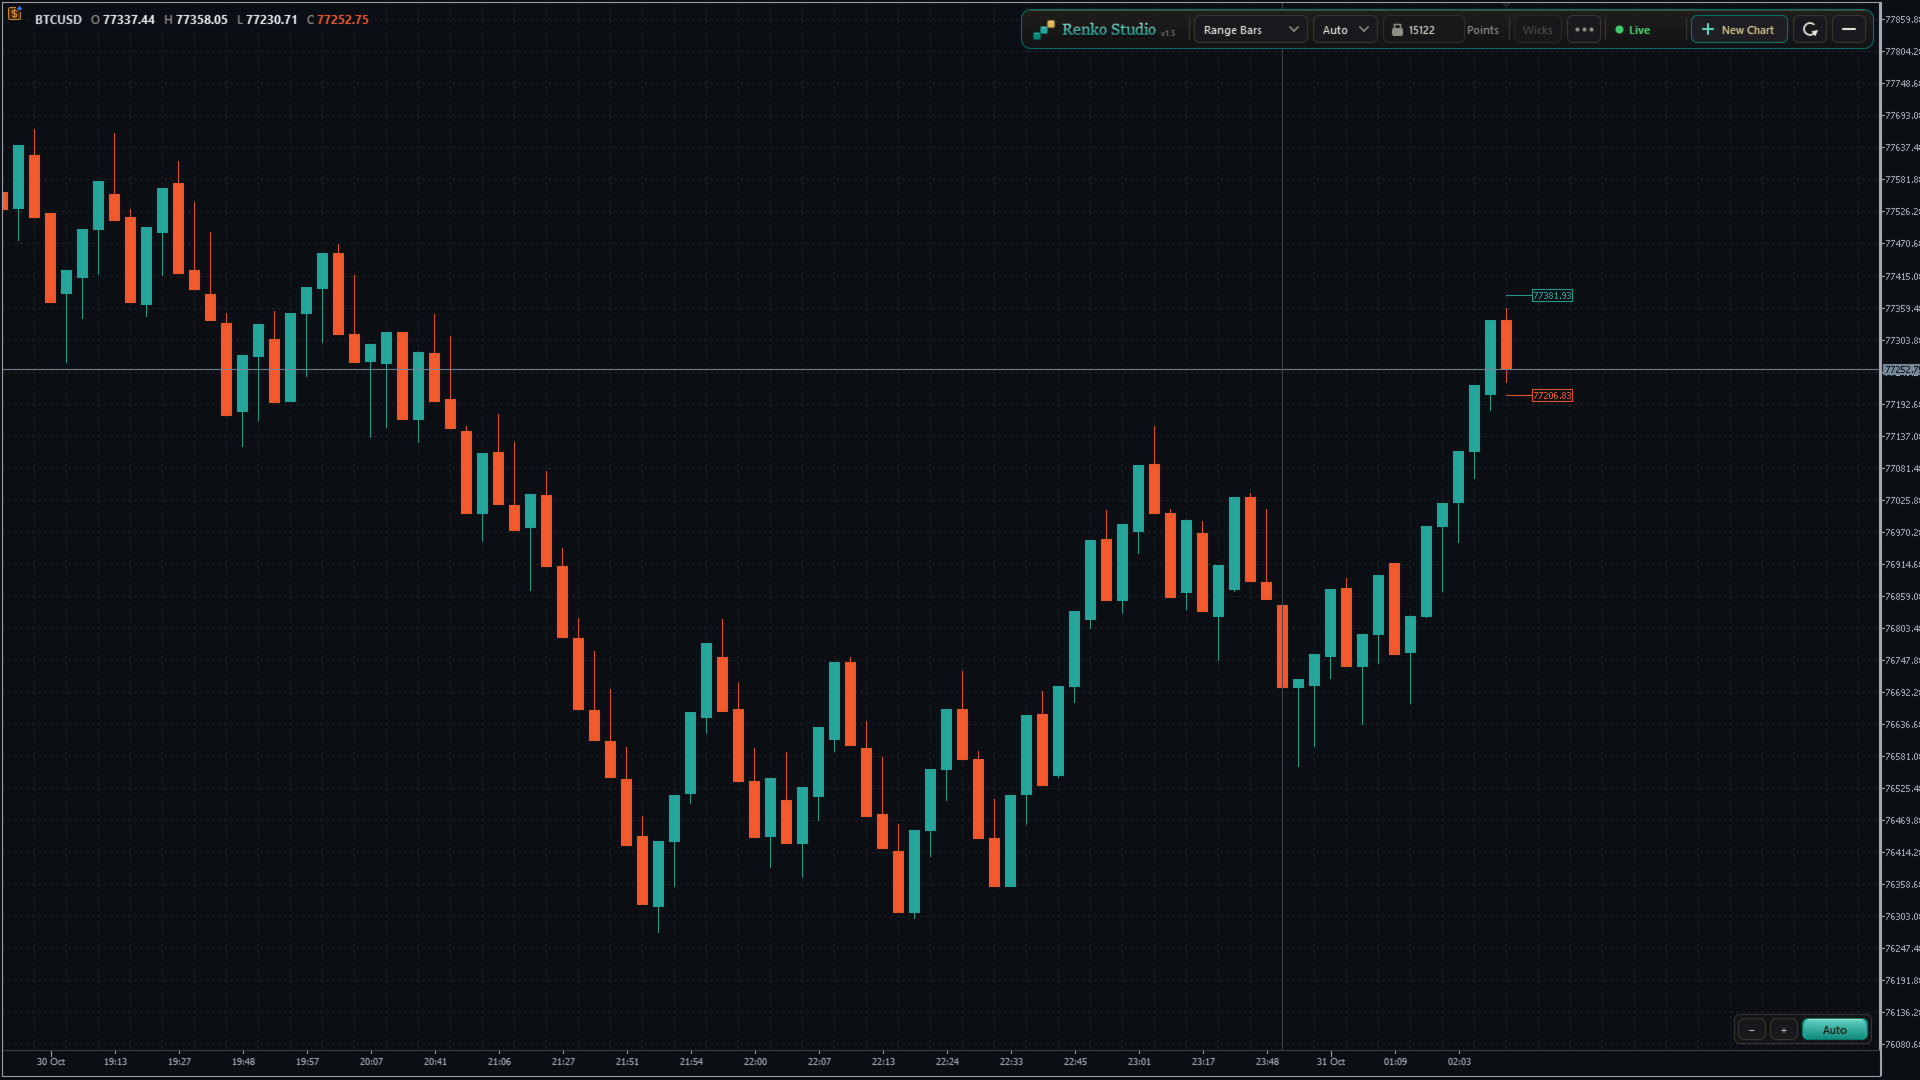
- Range Bars: each bar closes when its high–low range reaches the set size, with real open, high, low and close.
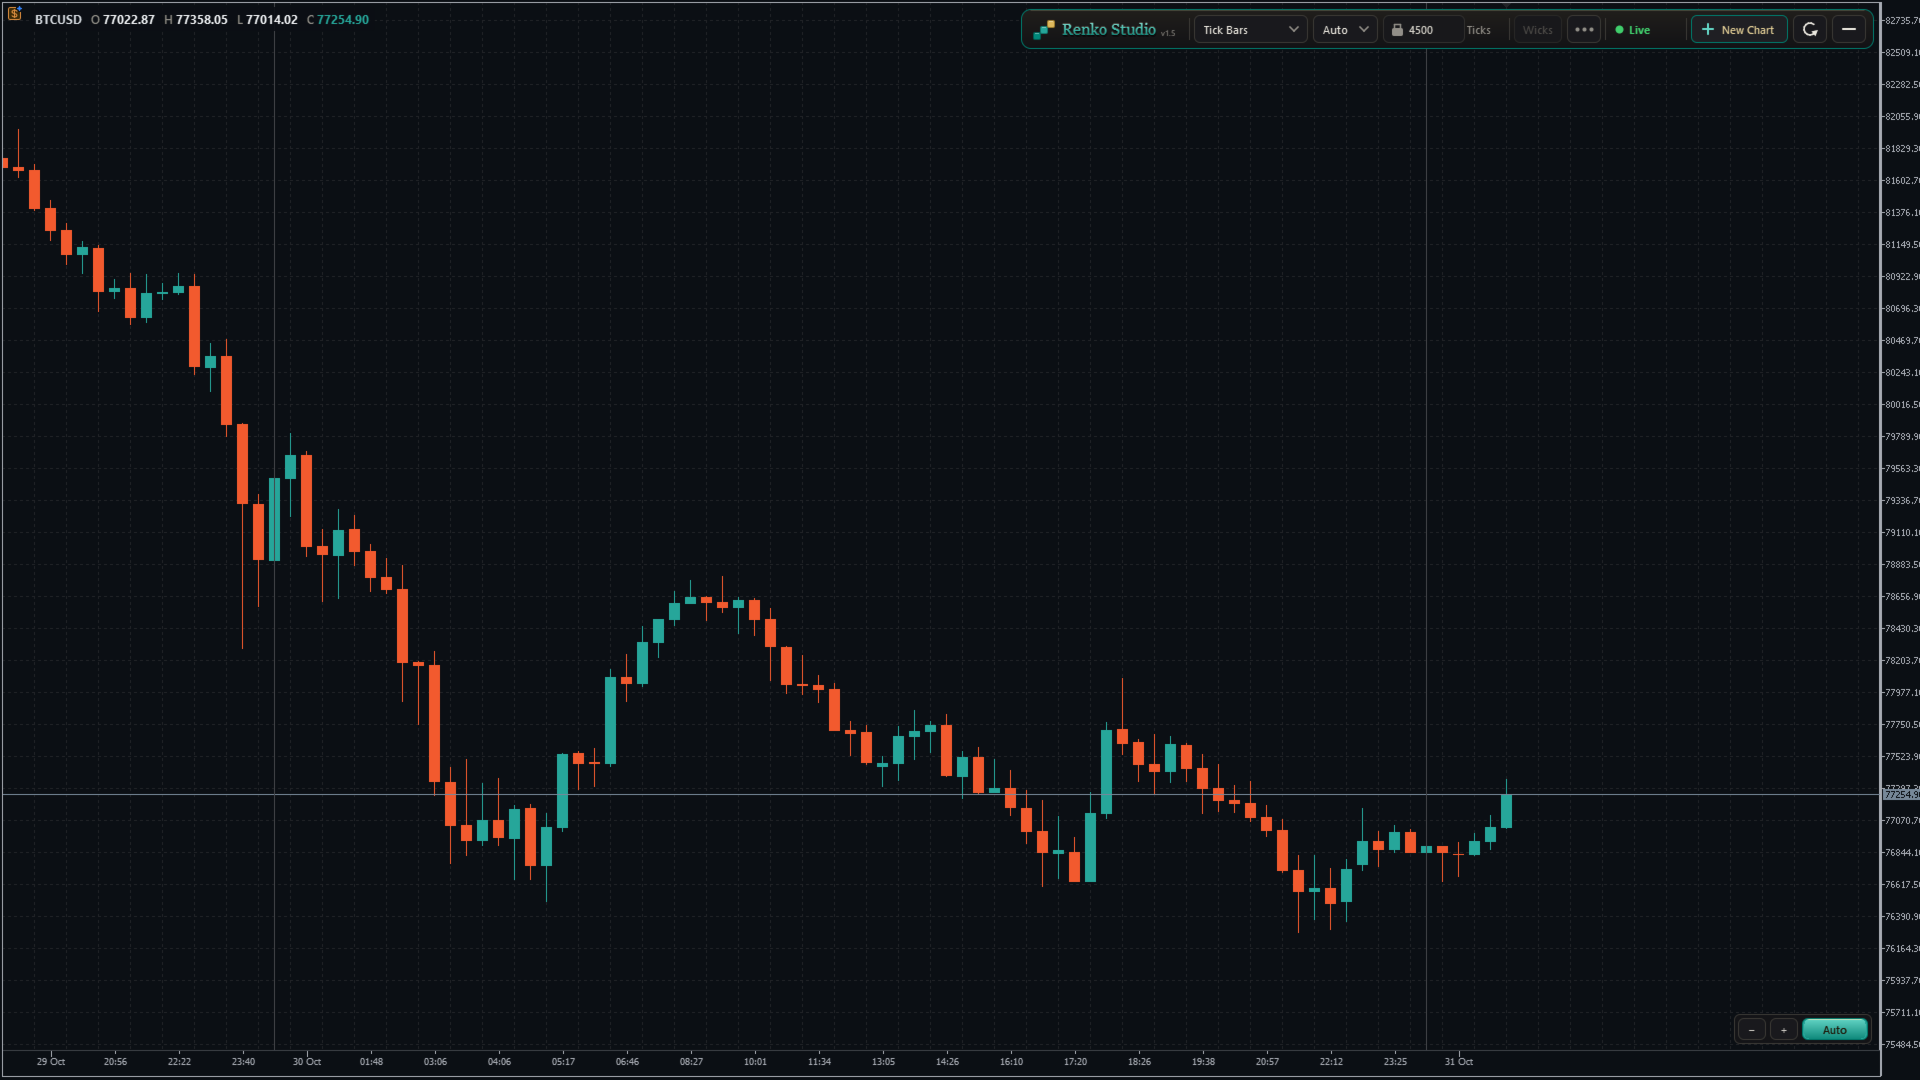
- Tick Bars: each bar closes after a set number of ticks, showing market activity.
- Switch in one click. Choose the type from the panel; the same chart window rebuilds in place.
4. Brick Size
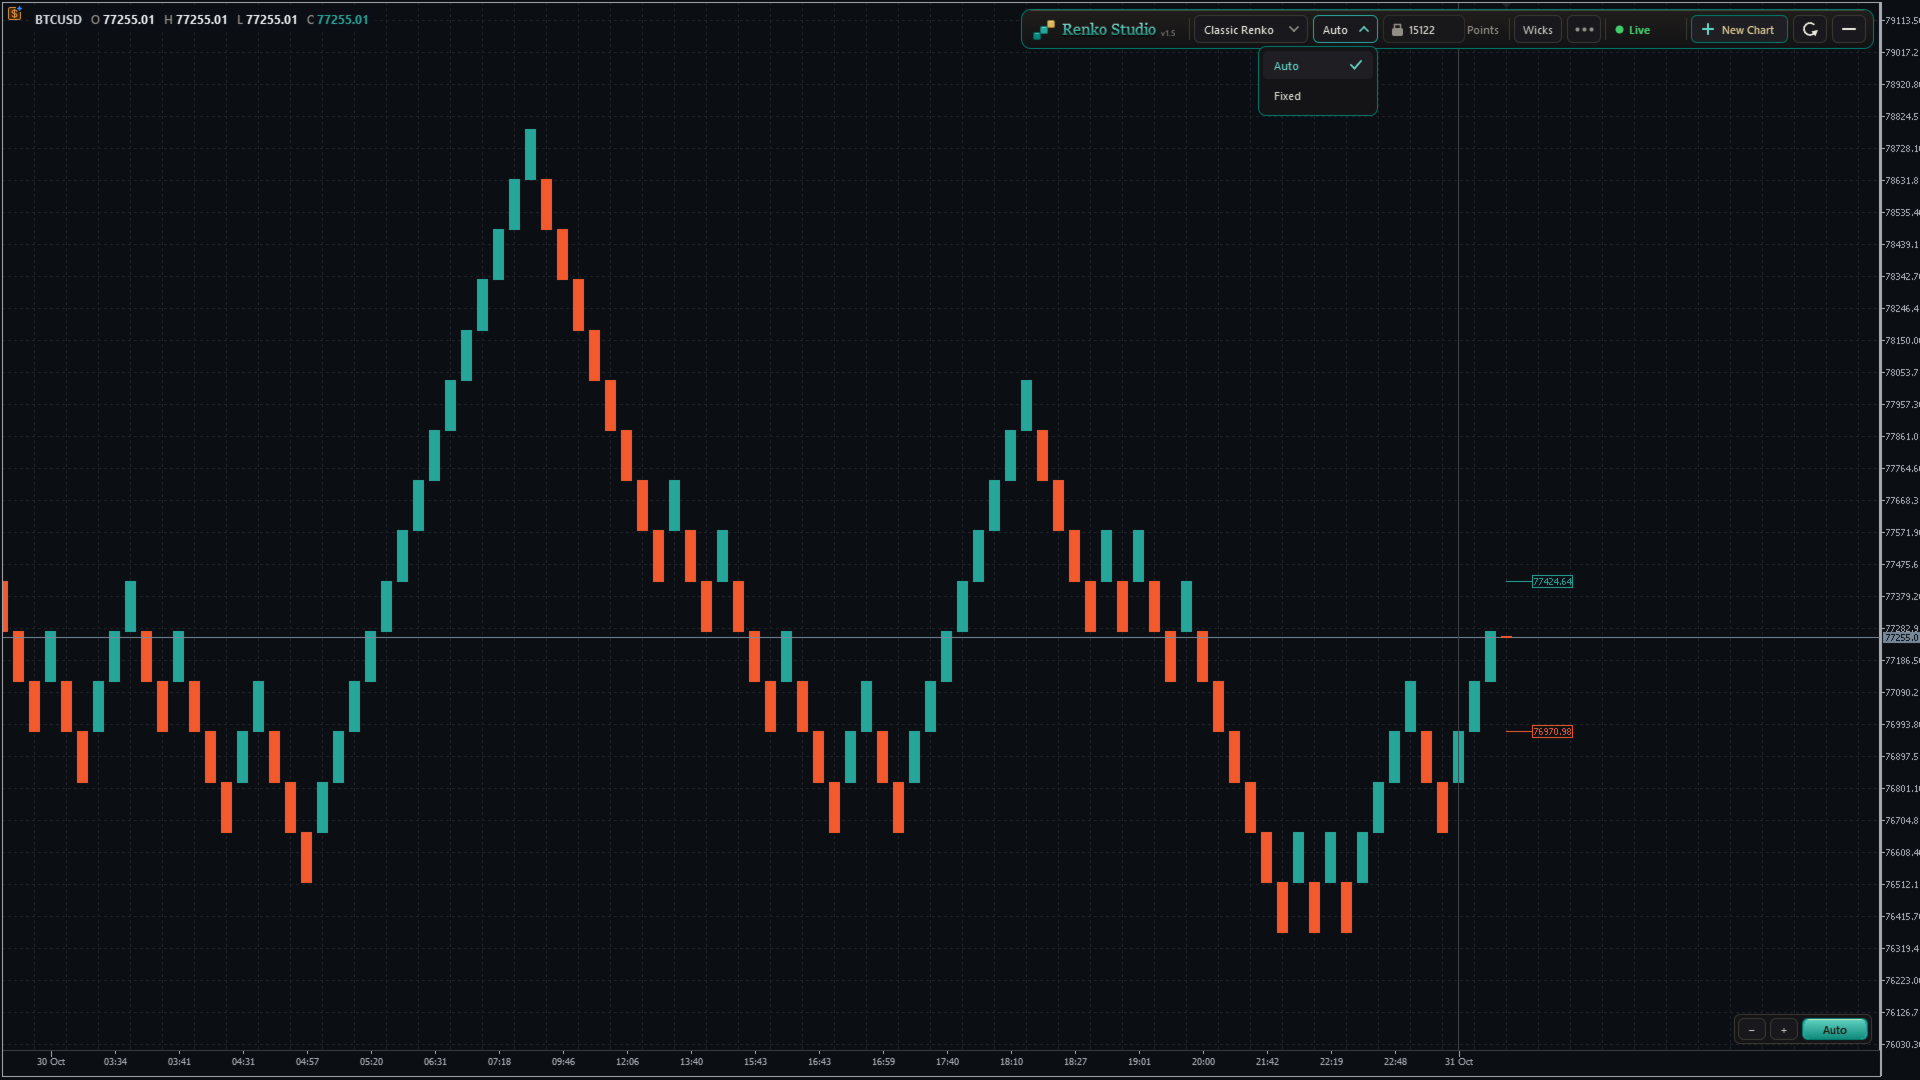
- Auto size: calculated from the symbol's own daily volatility during its trading sessions. One Auto size per symbol, the same on every chart type.
- Fixed size: type any brick size you like.
- Size unit: show and enter the size in Points, Pips (forex pairs) or Price. Works correctly on 2-, 3-, 4- and 5-digit brokers.
- Auto Size Refresh:
- Daily: a new size at the start of each trading session; past bricks stay unchanged.
- Daily + Rebuild: a new size at the start of each session, and the whole chart is rebuilt with it.
- Never: keeps the size calculated when the chart was created.
5. Live View
- Next Brick Levels: two labels show exactly where the next up brick and the next down brick will close.
- Live bar: the forming brick is drawn clearly as price moves, with matching colours.
- Live price line: follows the forming brick in real time.
- Wicks: show or hide brick wicks with one click (Range and Tick bars always show real wicks).
6. Real Time Axis and Sessions
- Real time axis: shows the real date and time of every brick, evenly spaced and easy to read.
- Day separator: a clear line at the start of each trading day, with adjustable thickness.
- Fill Session Gap: choose whether a price gap between sessions is filled with bricks or left as a visible gap.
- Info line: shows the symbol and the open, high, low and close of the brick under your mouse.
7. Chart Control
Auto mode (default)
- The chart keeps the latest bricks and the live bar centred between the panel and the time axis.
- Bricks always look comfortable on screen: never too tall, never too flat.
- Scroll back and forward in time freely; the vertical position adjusts by itself, smoothly.
- The price scale can be stretched only within safe limits, so bricks never hide behind the panel or the time axis.
Manual mode
- Click the Auto/Manual button to switch. The mode changes only when you click it.
- Drag the chart freely in any direction: back, forward, up and down.
- Stretch or shrink the price scale as much as you like.
- If the live bar leaves the screen and you don't touch the chart for about 10 seconds, it glides back into view. Your zoom and scale stay as you set them.
- Click Auto at any time to return to the centred view.
Zoom
- Use the − and + buttons at the bottom-right corner to zoom out and in.
- Or drag on the time axis to shrink or stretch the chart.
- The zoom and Auto/Manual controls stay in the same place at every window size.
Refresh
- One click resets the view: Auto mode, default zoom, latest bricks centred and space on the right for the next brick levels.
- Refresh only resets the view. It never changes or reloads your bricks.
8. Control Panel and Settings Menu
Panel
- Chart type, Auto/Fixed size, brick size with its unit, Wicks, the settings menu, status, New Chart and Refresh, in one compact toolbar.
- No inputs to configure: attach the EA, click OK, and your chart is ready.
Settings menu
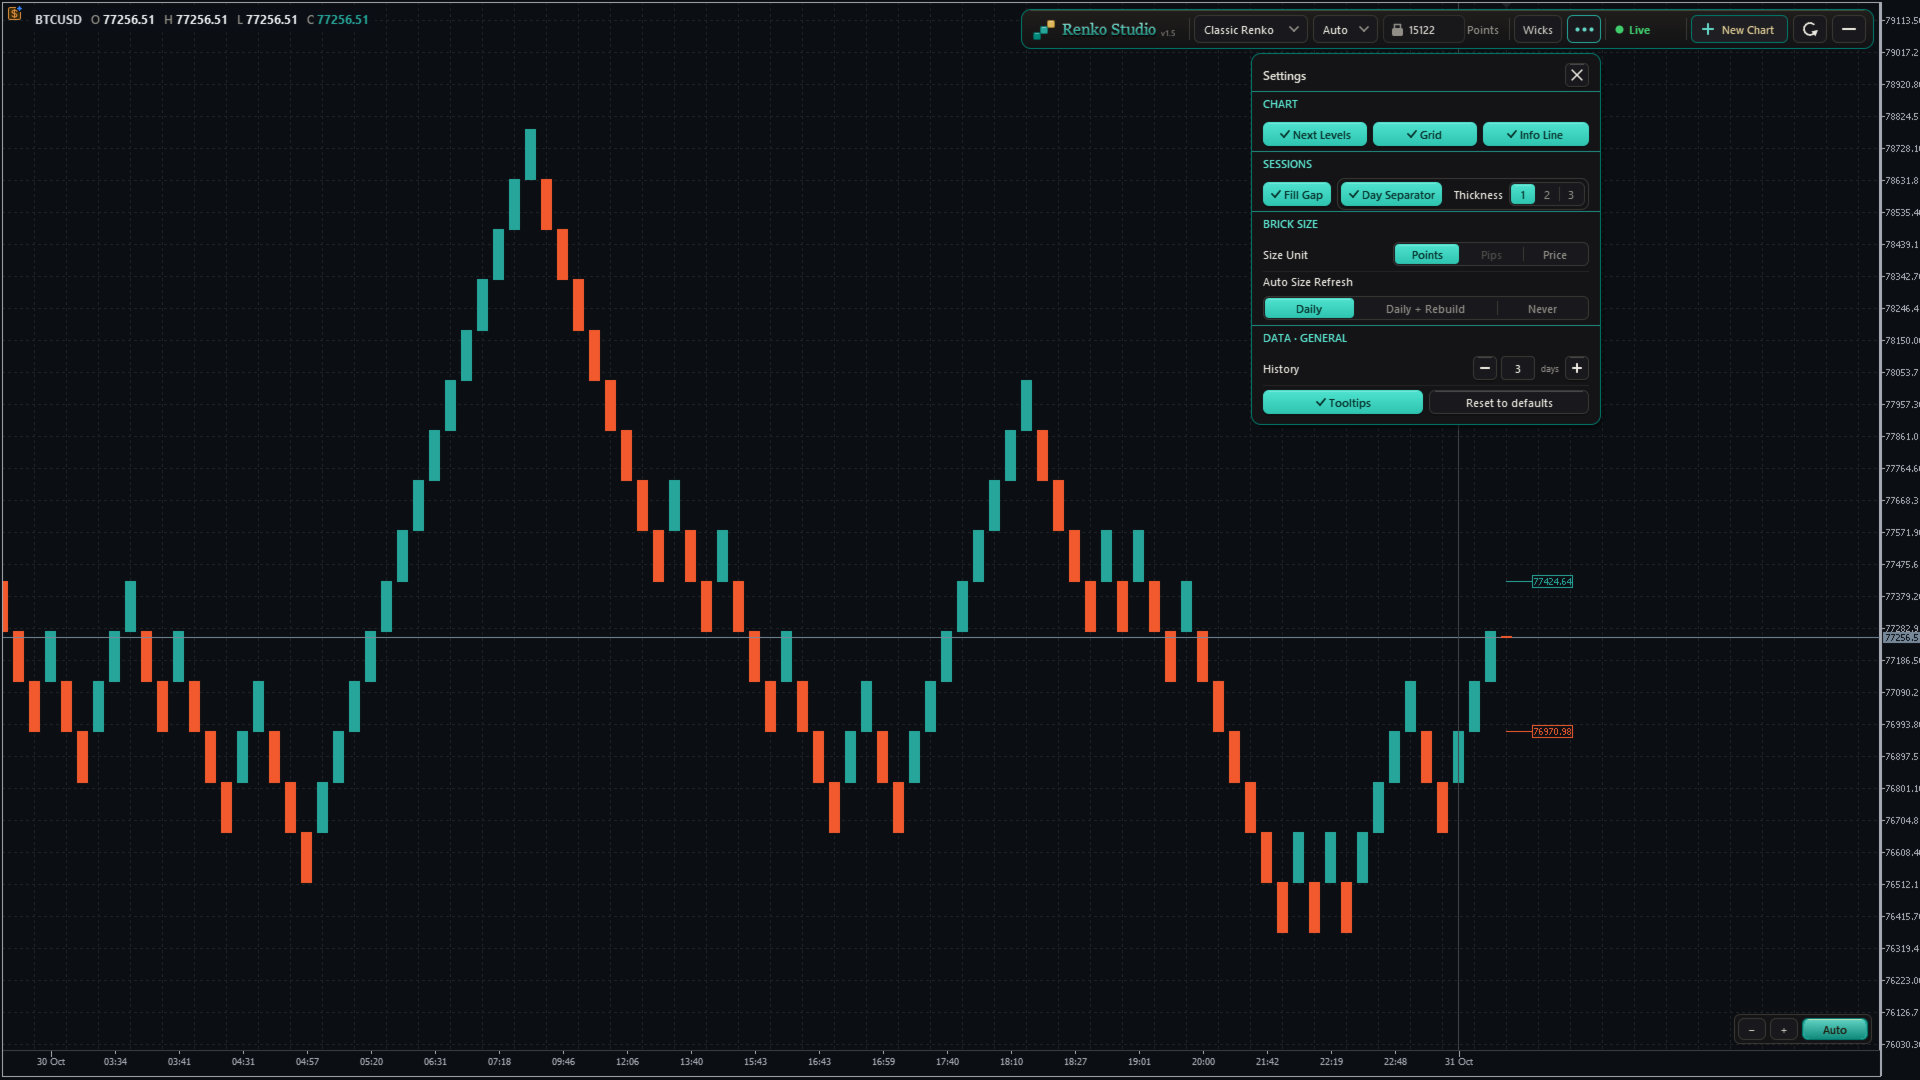
- Next Brick Levels, Grid, Info Line, Day Separator and its thickness, Fill Session Gap, Size Unit, Auto Size Refresh, History, Tooltips and Reset to defaults, grouped in clear sections.
- Tooltips: clear hover help for every control, which you can switch off.
- Reset to defaults: brings every setting back to its default in one click.
History
- Choose how many trading days to load: type the number or use − and +.
- "3 days" means today plus the last 3 complete trading sessions. Weekends and holidays without data are not counted.
- The chart reloads once with the new history, in the same window, keeping all your settings.
- A per-symbol limit keeps loading fast. Above the recommended value, a note shows the expected first-load time; once loaded, the chart runs at full speed.
Status
- A live status indicator (Live, Loading, Market closed and more) with a short explanation on hover.
9. Multiple Charts and Restore
New Chart
- Click + New Chart on the panel to open another Renko chart of the same symbol.
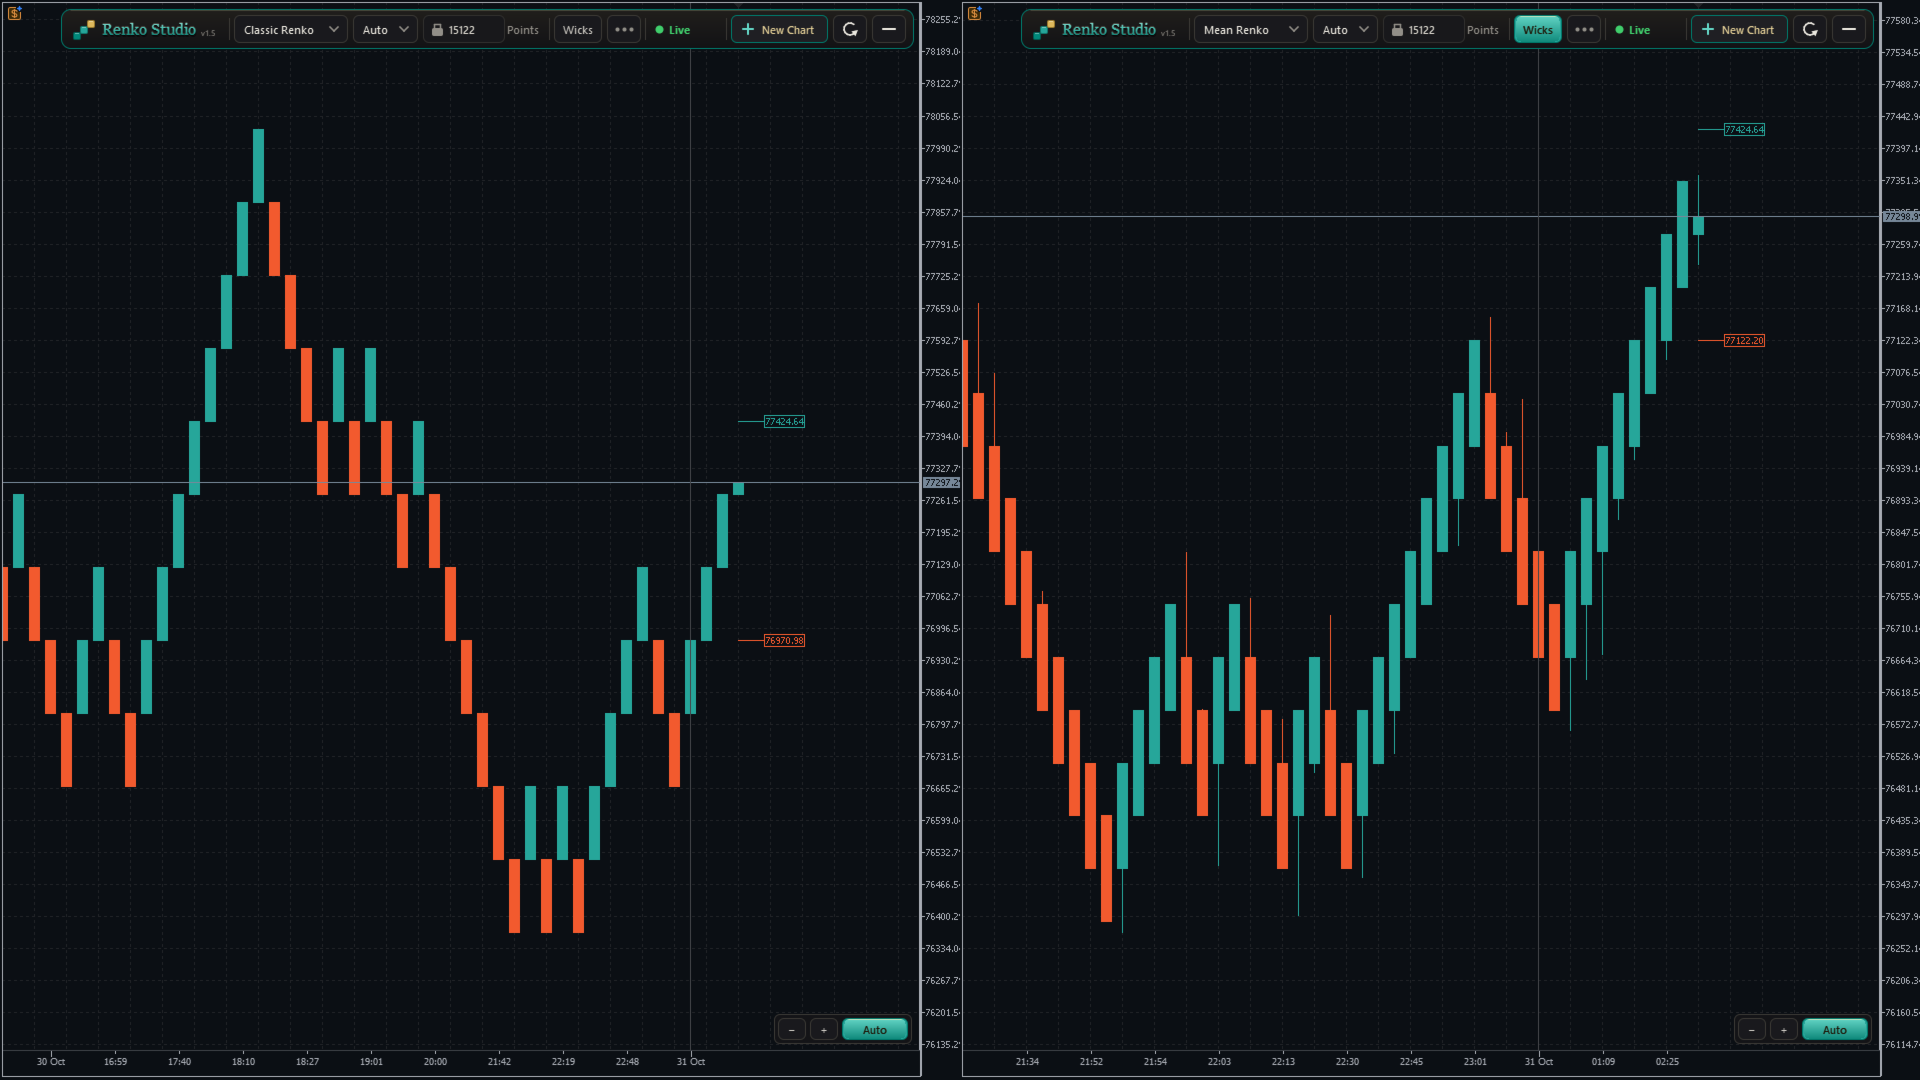
- Each chart has its own type, brick size and settings, for example Classic Renko on one and Range Bars on another.
- New charts open with your last-used settings.
- Charts are named XAUUSD_RS01, XAUUSD_RS02 and so on, numbered separately for each symbol.
Clean-up and restore
- Closing a Renko chart removes its symbol and data automatically.
- After restarting MT5, every chart comes back with the same settings and catches up with the latest prices.
10. Compatibility
- Indicators, drawings and templates work on the Renko chart like on any MT5 chart.
- Any symbol: forex, metals, indices and more, including broker suffixes such as .m or .pro.
- Any broker digits: 2-, 3-, 4- and 5-digit symbols are handled correctly.
How to Use
- Open an M1 chart of your symbol (for example XAUUSD).
- Attach Renko Studio and click OK.
- A Renko chart opens with Classic Renko and Auto size. Change anything from the panel or the settings menu.
Important Notes
- Removing the EA from the source chart closes its Renko charts.
- Expert Advisors attached to a Renko chart do not receive ticks in this version, so they cannot run or trade from it. Indicators work normally.
- The Renko time axis shows the real time. MT5's status bar and Data Window show an internal date.
- Available history depends on your broker's tick data.