X Ray
- Indicators
- Version: 1.0
- Activations: 10

X Ray - See Inside Every Candle (MT5)
Most indicators only read open, high, low and close. That is the finished story of a candle, and it hides how the candle was actually built.
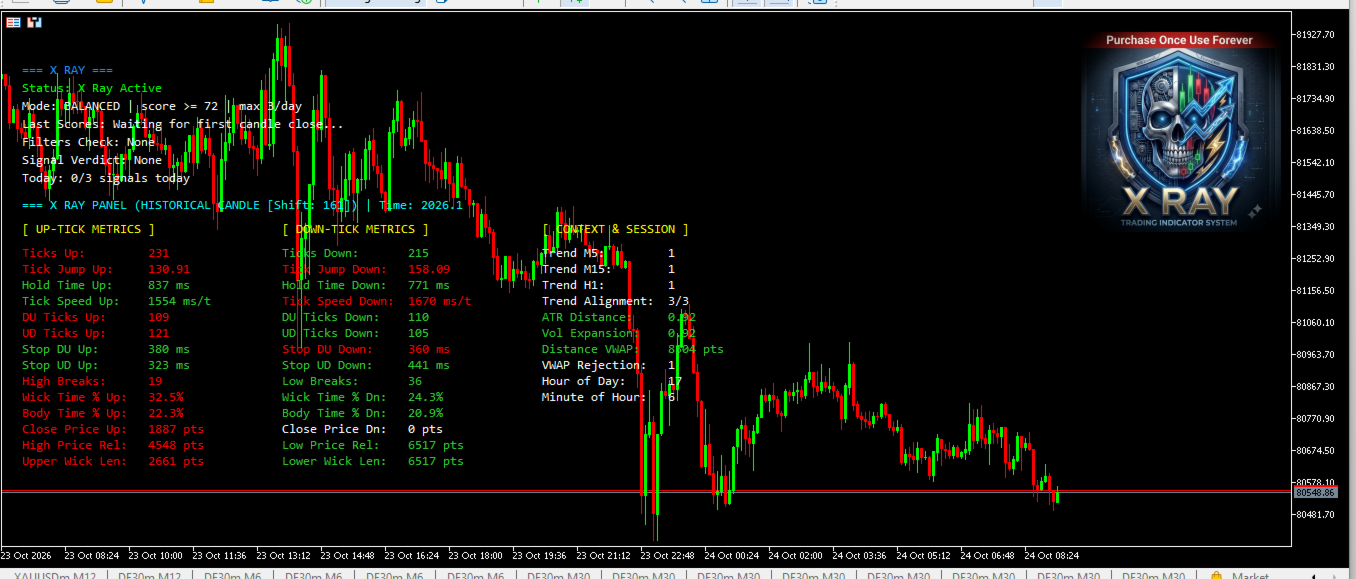
X Ray reads the tick-by-tick behaviour inside every candle and puts it in front of you, live:
- How fast ticks are arriving, and how long price holds before moving
- How often price breaks the high or the low
- How much time price spends in the body versus the wicks
- How long reversals pause before they turn
- Trend alignment of M5, M15 and H1, ATR distance and VWAP position
- 38 parameters in total, updating live on your chart
The panel changes colour as the candle develops: green when a value is rising, red when it is falling. You can read the pressure of a candle at a glance instead of guessing from its shape. Hover over any candle to inspect its parameters.
CLEAR SIGNALS, NOT CHART NOISE
X Ray scores every closed candle from 0 to 100 on the buy side and the sell side. Only candles that pass your chosen threshold produce an arrow, for example "BUY 84%", placed on the next candle's open.
You decide how selective it is:
- SAFE: up to 2 signals per day
- BALANCED: up to 3 signals per day
- ACTIVE: up to 4 signals per day
- CUSTOM: your own score and daily limit
Built-in filters: cooldown between signals, spread filter, trend filter, session hours, dead-candle and news-spike filter, plus 38 optional advanced filters. Popup, sound, push and email alerts included.
WHY TRADERS CHOOSE X RAY
- It shows information that standard indicators do not show.
- Fewer, selective signals instead of an arrow on every move.
- Everything is visible: you can see why a candle scored high or low.
- Fully adjustable, from cautious to active.
- Clean panel, your own logo-free chart colours, easy to read on any screen.
LAUNCH OFFER
X Ray is currently offered at a special launch price. The price may increase in a future update.
GOOD TO KNOW
- Signals appear from the moment the indicator runs. Past signals are not drawn on old history.
- It needs tick history from your broker. In the Strategy Tester use "Every tick based on real ticks".
- Recommended: M5 and M15 on liquid symbols. Test on a demo account first.
- This is an analysis tool. It does not open trades. No indicator is always right, and trading carries risk of loss.
One-time purchase, no subscription, free updates. Support: use the Comments section on this page.