ProfileScope MT5
- Indicators
- Version: 1.0
- Activations: 5

ProfileScope MT5
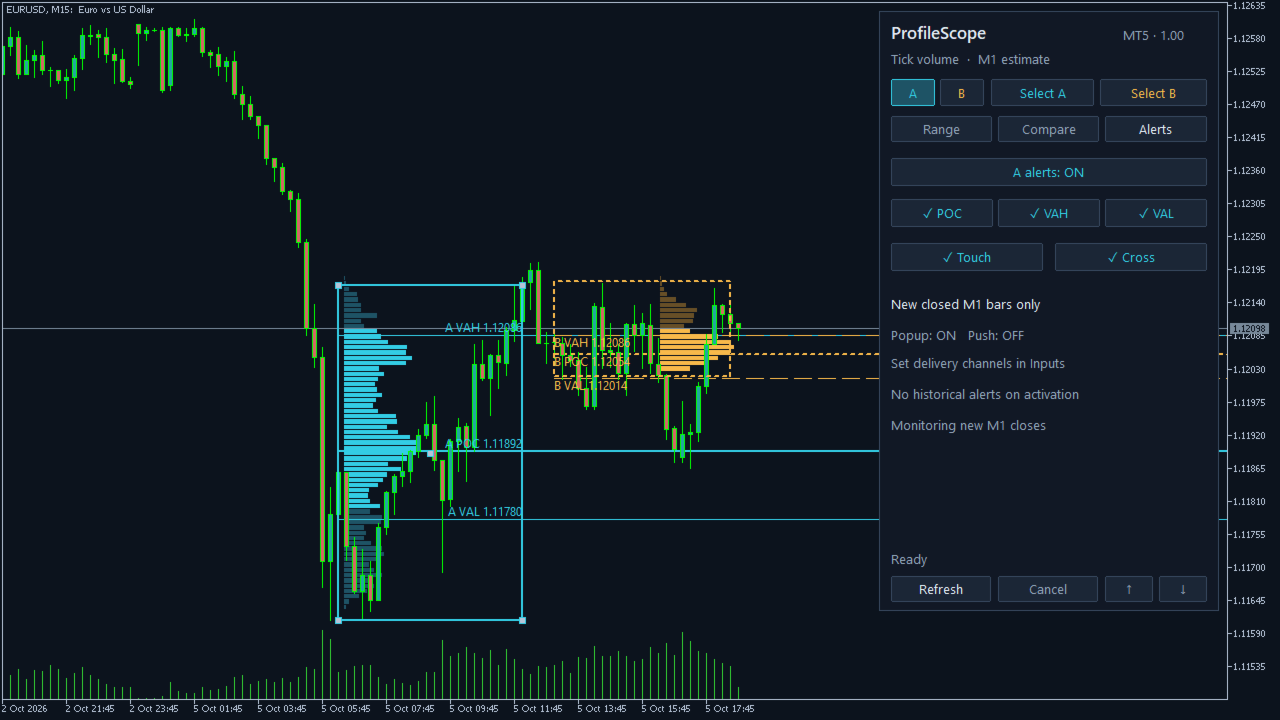
Compare volume distributions across two areas you choose on the chart. ProfileScope MT5 combines a selected-area volume profile, numerical A/B comparison and alerts for confirmed interactions with profile levels.
Choose the area that matters
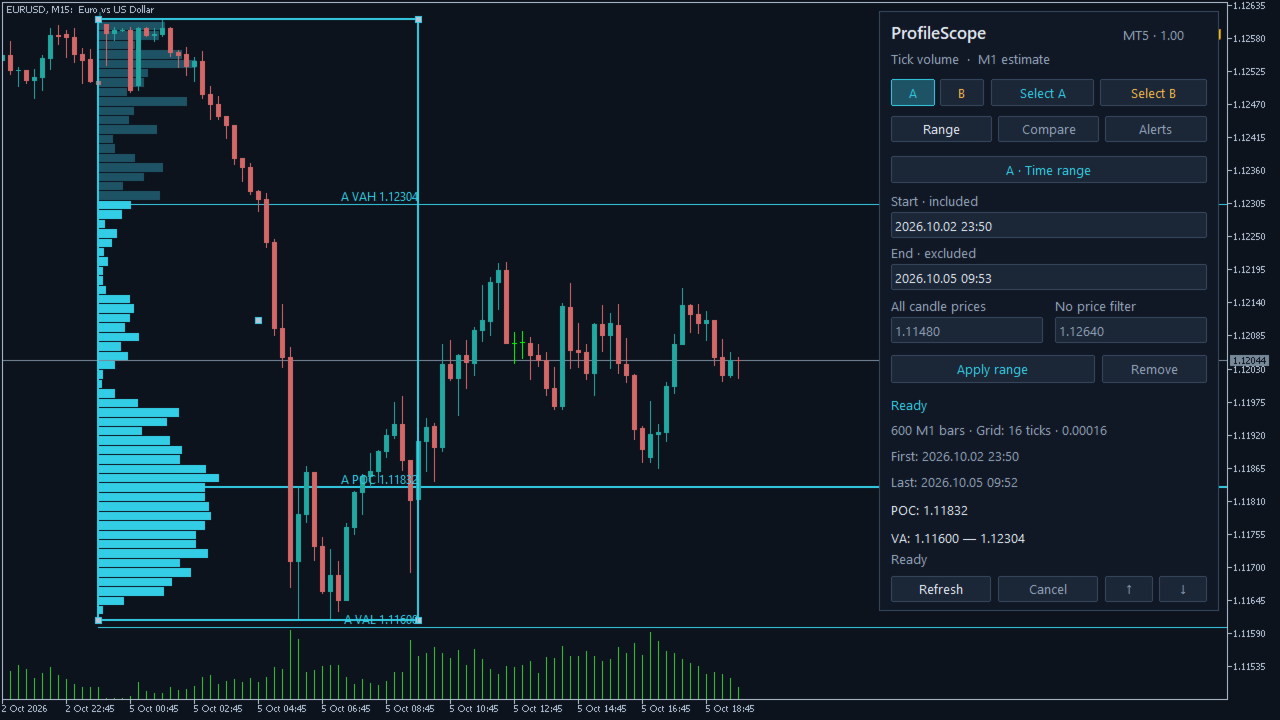
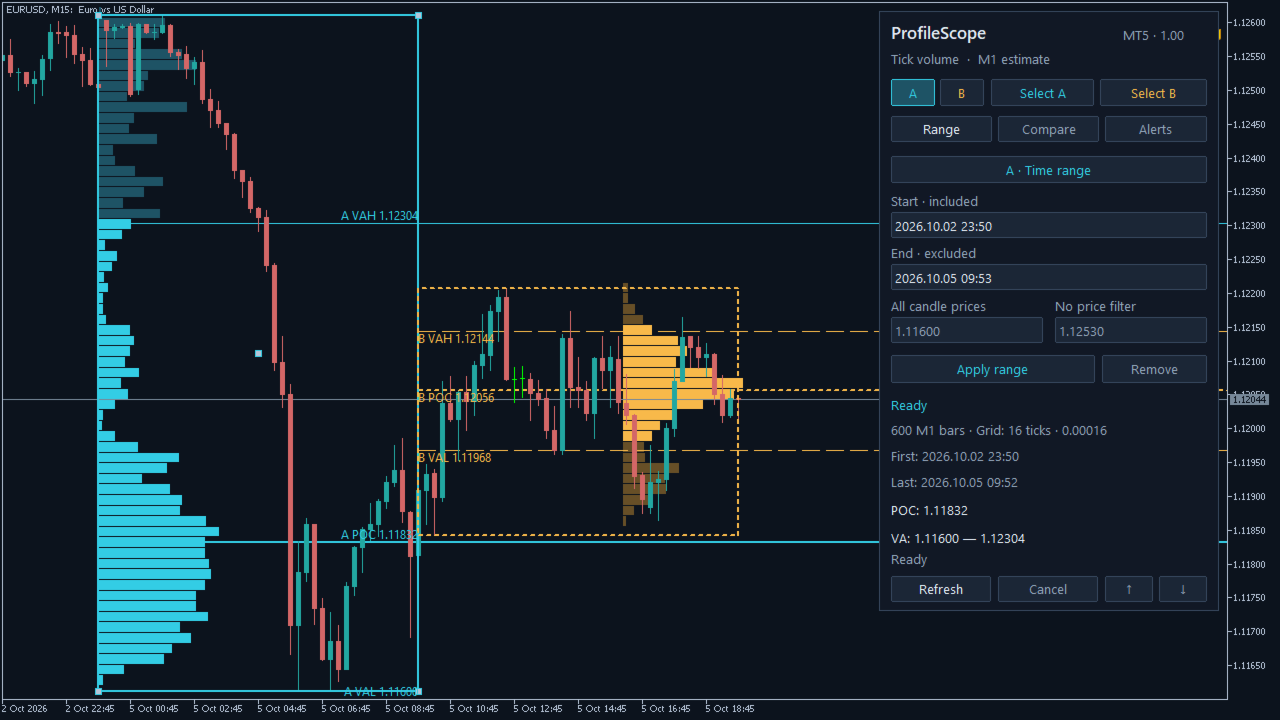
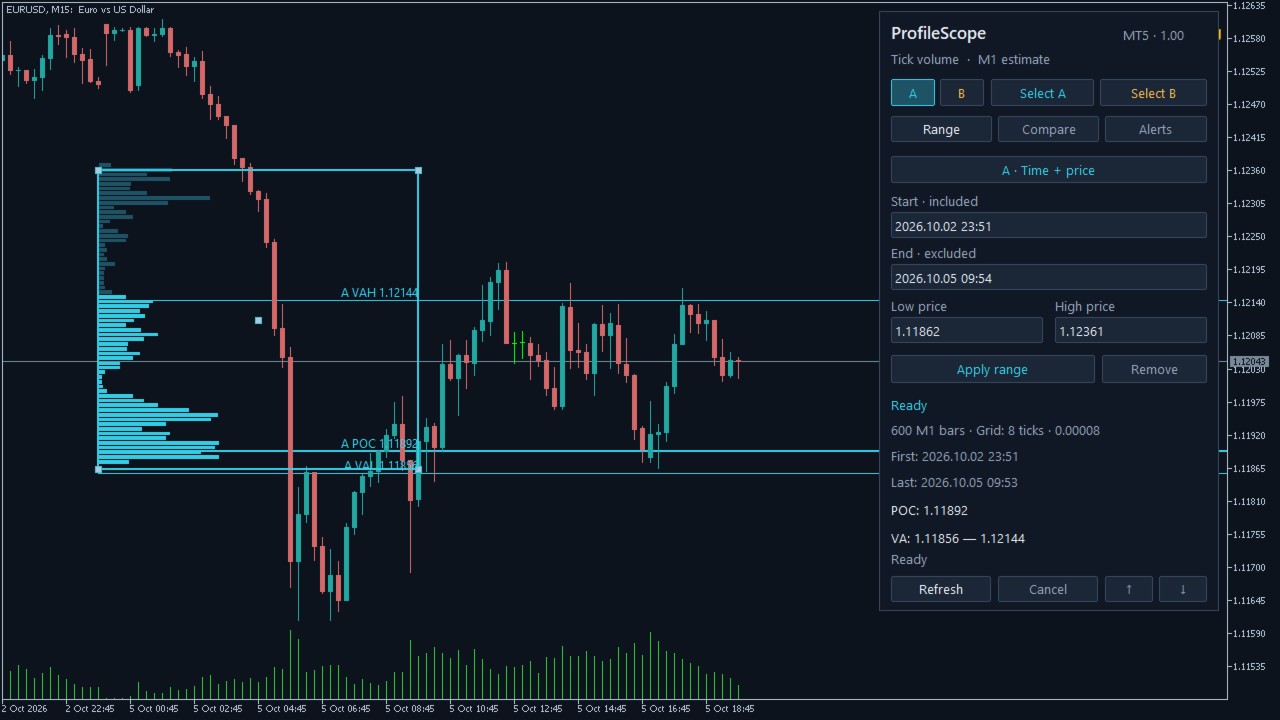
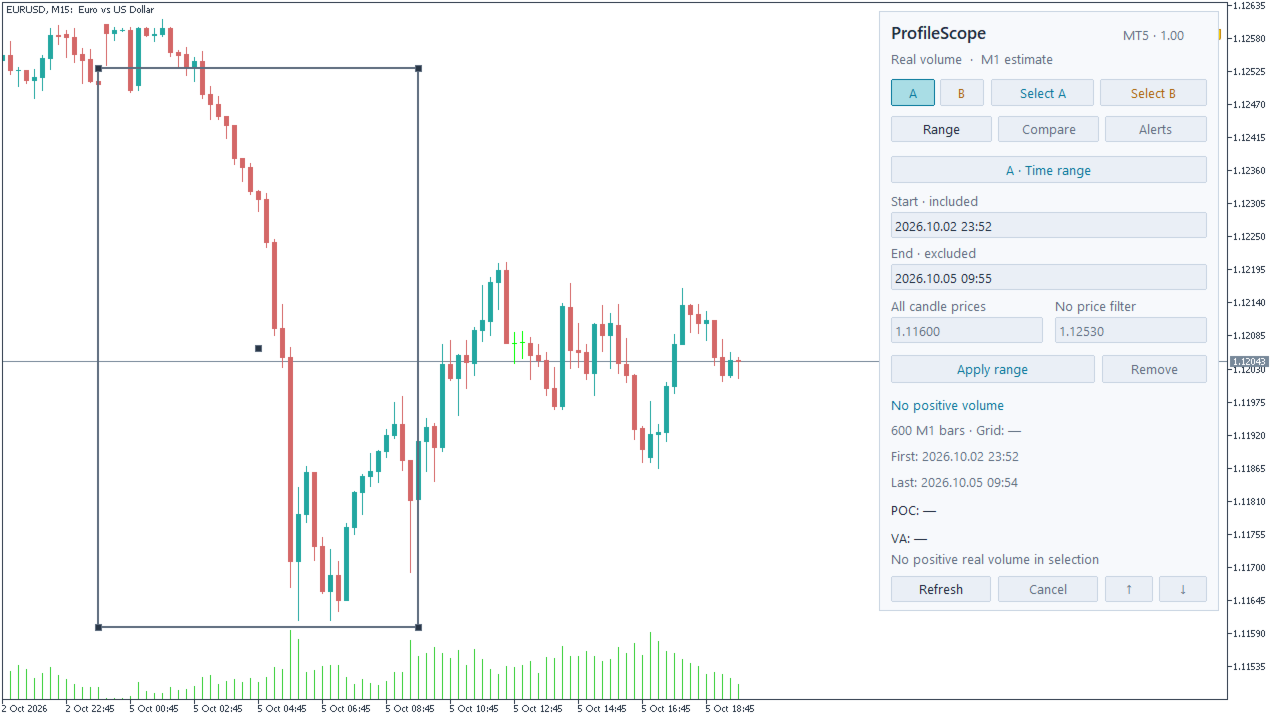
Choose Select A, drag across the chart and release to create A. Use Select B the same way to compare another period. Use Time range for the full price range of selected candles, or Time + price to keep only the estimated volume within a price interval. Drag the boundaries or enter exact minute times and prices in the panel. Areas stay fixed until you edit them.
Each profile displays its histogram, Point of Control (POC) and Value Area boundaries (VAH / VAL). Check the actual Value Area coverage, retained-volume percentage, received M1 bar count and first/last received times.
Compare A and B on one price grid
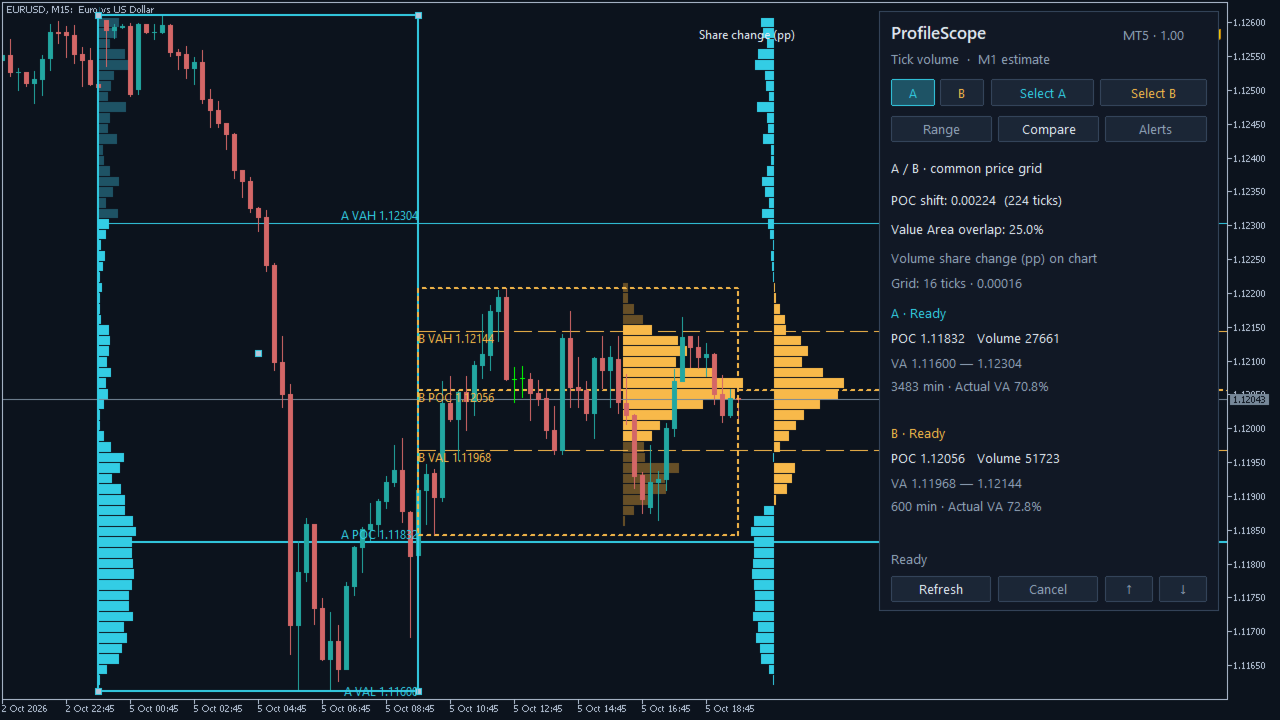
- POC shift: B minus A, in price and minimum price steps.
- Value Area overlap: intersection of the VA price intervals divided by their union. This compares price intervals, not volume totals.
- Volume share change (pp): B's normalized volume share minus A's share at each row. A change from 12% to 17% is +5 percentage points.
- Read each area's total volume and duration alongside the normalized comparison.
A and B share one source and one price grid. Adding or changing B can change the automatic grid and the levels of both profiles. Different price filters are identified in the panel. These comparisons describe selected historical distributions; they do not predict price direction.
Monitor POC, VAH and VAL
Enable A and/or B, select the levels and choose Touch, Cross, or both. Enable popup and/or push delivery in Inputs. All alerts and delivery channels are off by default.
Monitoring uses new closed M1 candles, regardless of the displayed chart period. Touch is reported at the beginning of a contact sequence; another non-touching candle is required before a new touch. Cross requires a close beyond the level after a previous close on the other side or exactly on the level. Closing exactly at the level is not a confirmed cross. A price gap may cross without touching.
Events at the same price are grouped, and A/B events from the same minute are combined where possible. Activation, changed levels, restart and history resynchronization establish a new starting point without historical replay.
Push attempts are at least 6.1 seconds apart per instance. The queue holds 10 messages, expires events 120 seconds after the candle closes and splits messages at 255 characters. Overflow removes the oldest message. Failed delivery is logged without automatic retry. Push requires a configured terminal and MetaQuotes ID; notification limits are shared with other programs. A send attempt does not guarantee phone receipt.
Understand the data
M1 estimate means each closed broker M1 candle's volume is distributed uniformly over its Low–High range. A flat candle contributes to one row. This is an OHLC-based estimate, not actual transactions at each price, order flow or buy/sell delta.
TickVolume uses tick activity. RealVolume uses the broker's real-volume field where available. There is no automatic substitution between them. If the selected source has no positive volume, the profile is unavailable. A price filter discards the estimated volume outside its bounds without redistributing it inside.
The selected start minute is included; the end minute is excluded. Mouse selection rounds start down and end up to full minutes. Numeric times require exact minutes. The forming M1 candle is excluded, and the end never advances automatically. Missing market minutes are not filled with invented volume. Incomplete or unknown history is shown as unavailable/loading rather than as a complete profile. Broker corrections can change results.
Inputs and limits
- VolumeSource: TickVolume by default; TickVolume or RealVolume.
- RowsMode: Auto by default; Auto or Manual.
- TargetRows: 64 by default; 16–256 in Auto.
- TicksPerRow: 10 by default; 1–100000 in Manual.
- ValueAreaPercent: 70 by default; 1–100. Whole rows may cover more than the target.
- Theme: Auto by default; Auto, Light or Dark.
- PanelCorner: upper right by default; any chart corner.
- FontSize: 10 by default; 8–16.
- ProfilePlacement: Inside by default; inside the area or at the right edge.
- PopupAlerts / PushAlerts: false by default; each profile must also be enabled in the Alerts tab.
Up to 2 profiles, 100000 closed M1 candles per profile and 256 price rows. An oversized manual grid is rejected rather than silently coarsened. One indicator instance per chart. The panel is in English; the translated listing does not translate the interface. No DLLs, WebRequest or trading operations.
Getting started
Attach the indicator, choose Select A, then press and drag in the main price chart outside the panel. Release to apply; Esc or Cancel cancels an unfinished selection. Wait for the data, then create B and open Compare. Use Range → Apply range for exact boundaries and the panel's arrow buttons to reach additional details. To monitor a level, enable a delivery channel in Inputs, select A or B in Alerts, choose its levels/events and switch its alerts ON.