SqueezeScope MT5
- Indicators
- Version: 1.0
- Activations: 5

SqueezeScope MT5
Follow a squeeze through its price events
SqueezeScope MT5 is designed for traders who review one symbol and want to understand what happened after volatility compressed. Its focus is a fixed squeeze range with a sequence of price events, plus the H1/H4/D1 context that was available when each historical event became confirmed.
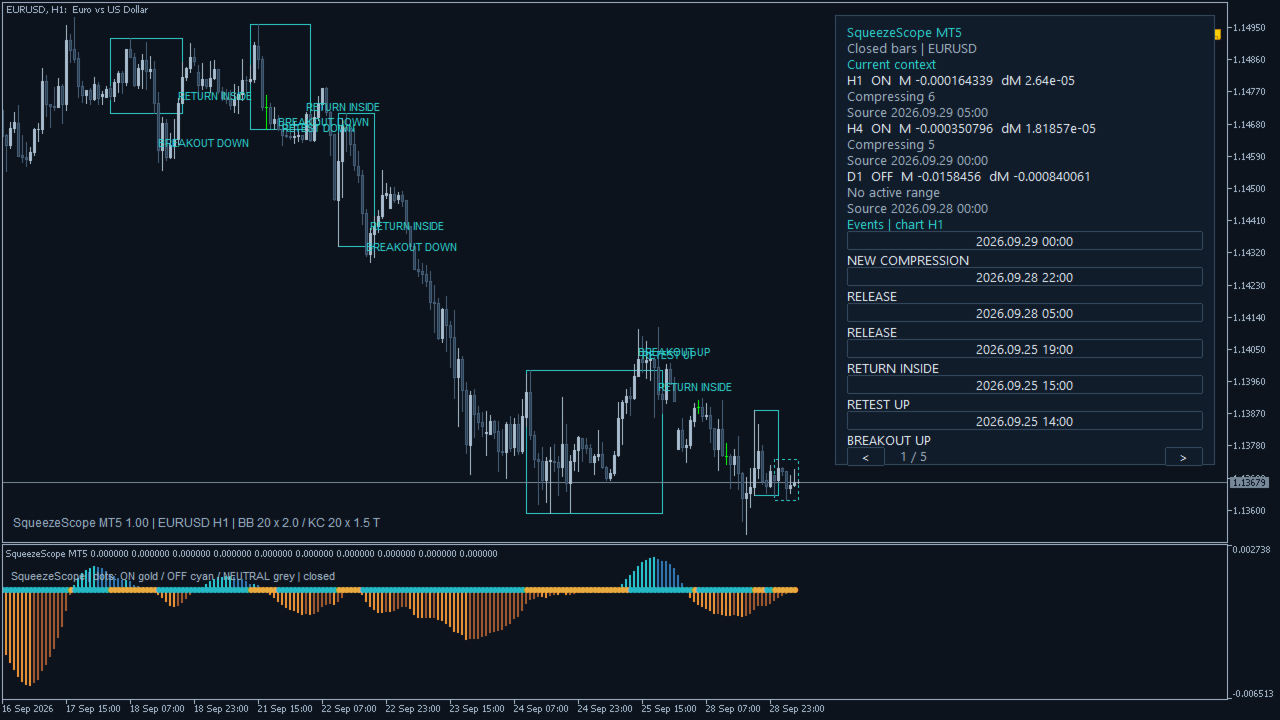
- Keep the original range in view. A fully observed run of ON bars forms a range from their highest High and lowest Low. At the first non-ON bar, the range is fixed. That exit bar does not enlarge it.
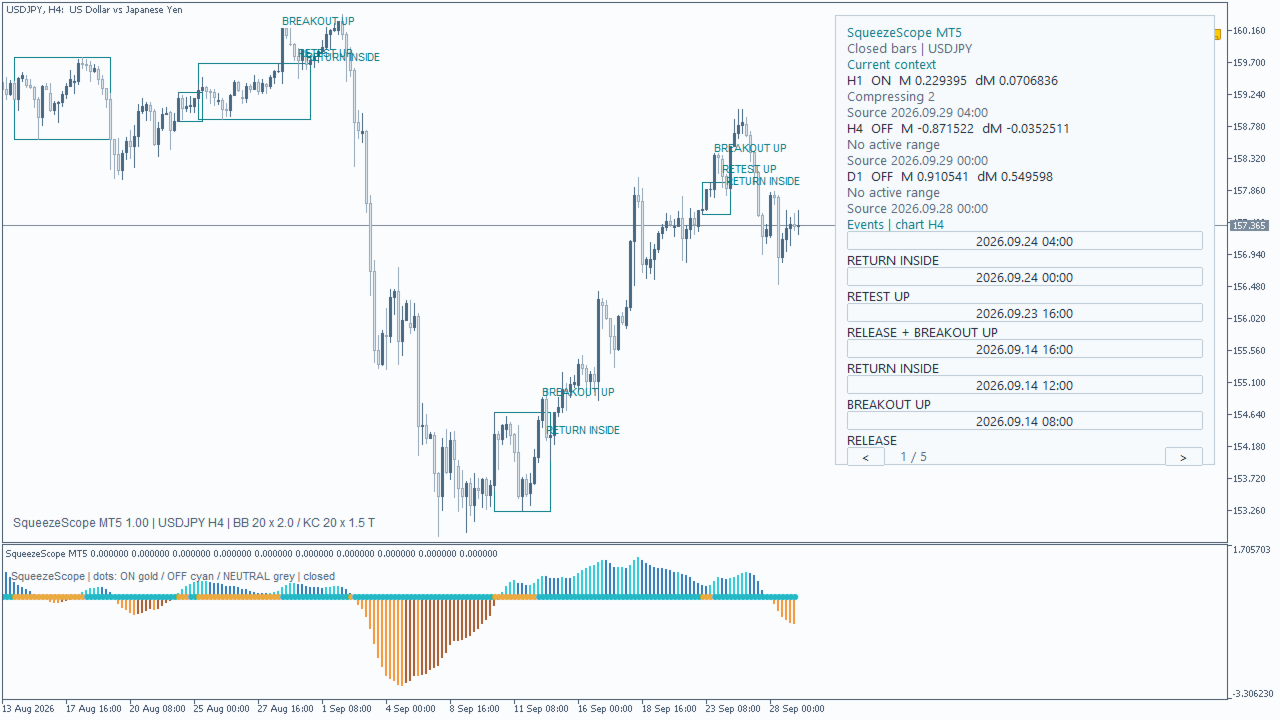
- Separate the stages. RELEASE, BREAKOUT, RETEST, RETURN INSIDE and CROSSED RANGE describe different facts. The log records the time, Close, range boundaries and reason, so the sequence can be reviewed without reconstructing it across charts.
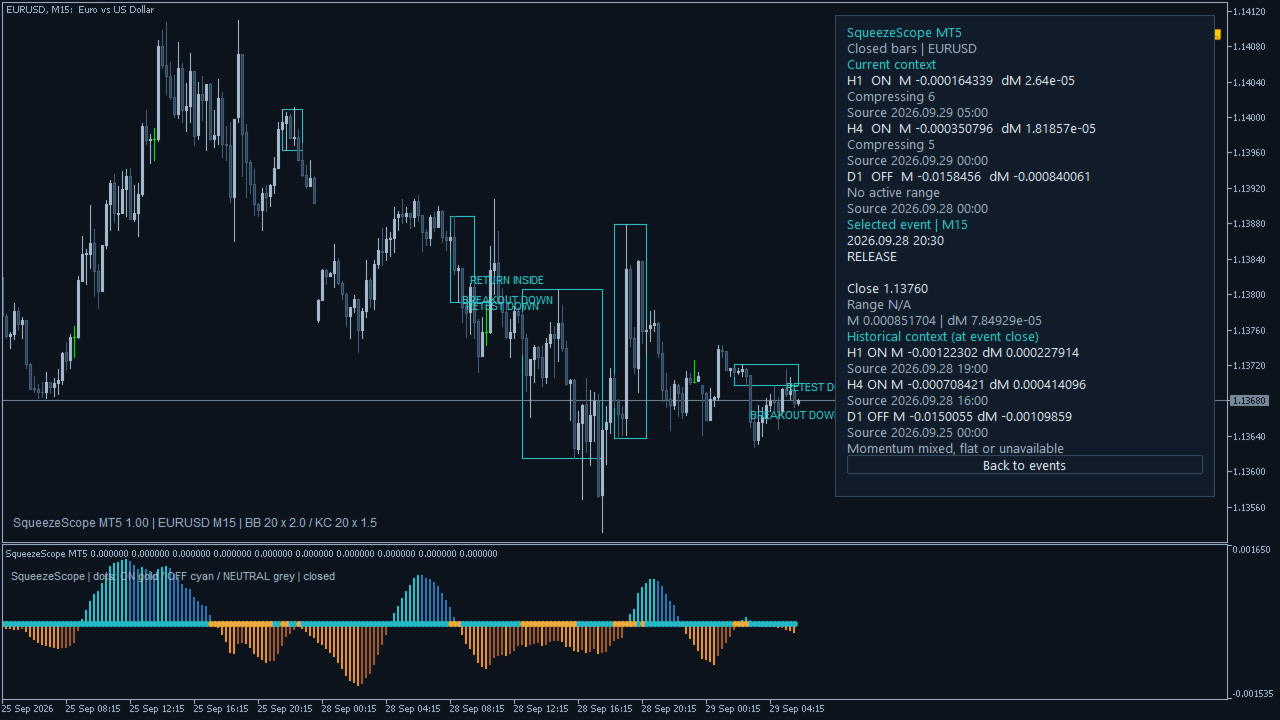
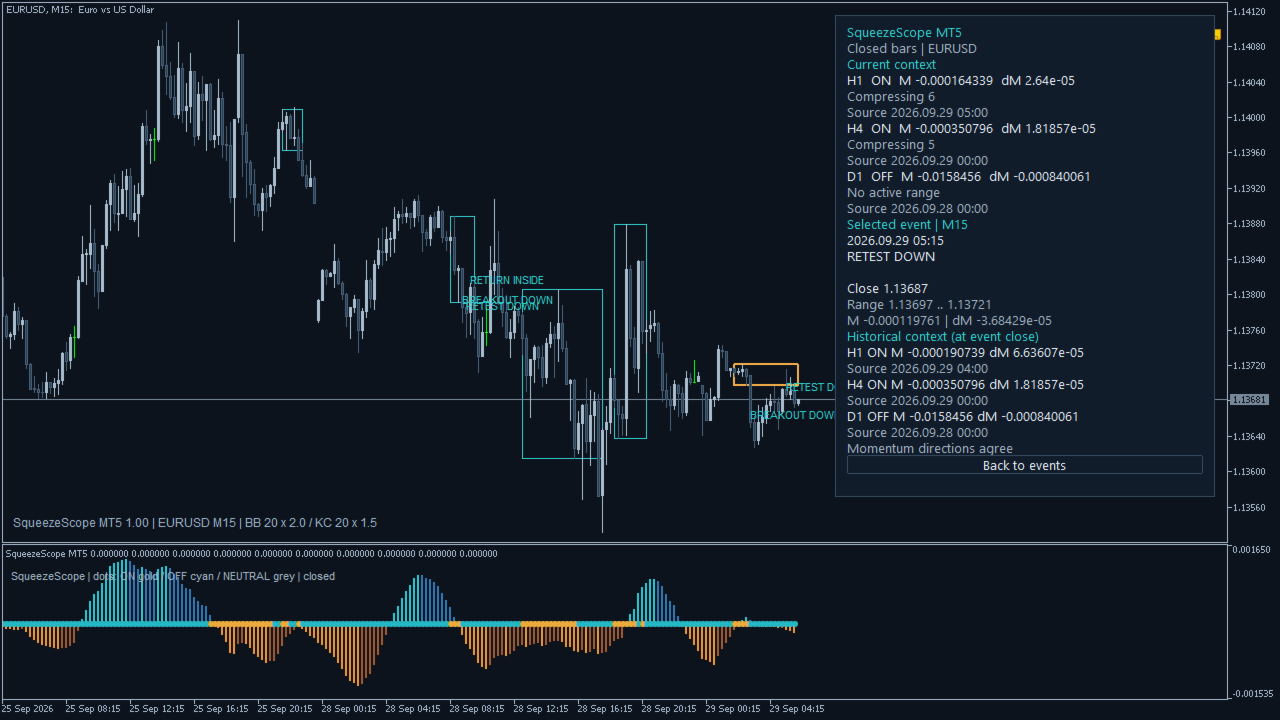
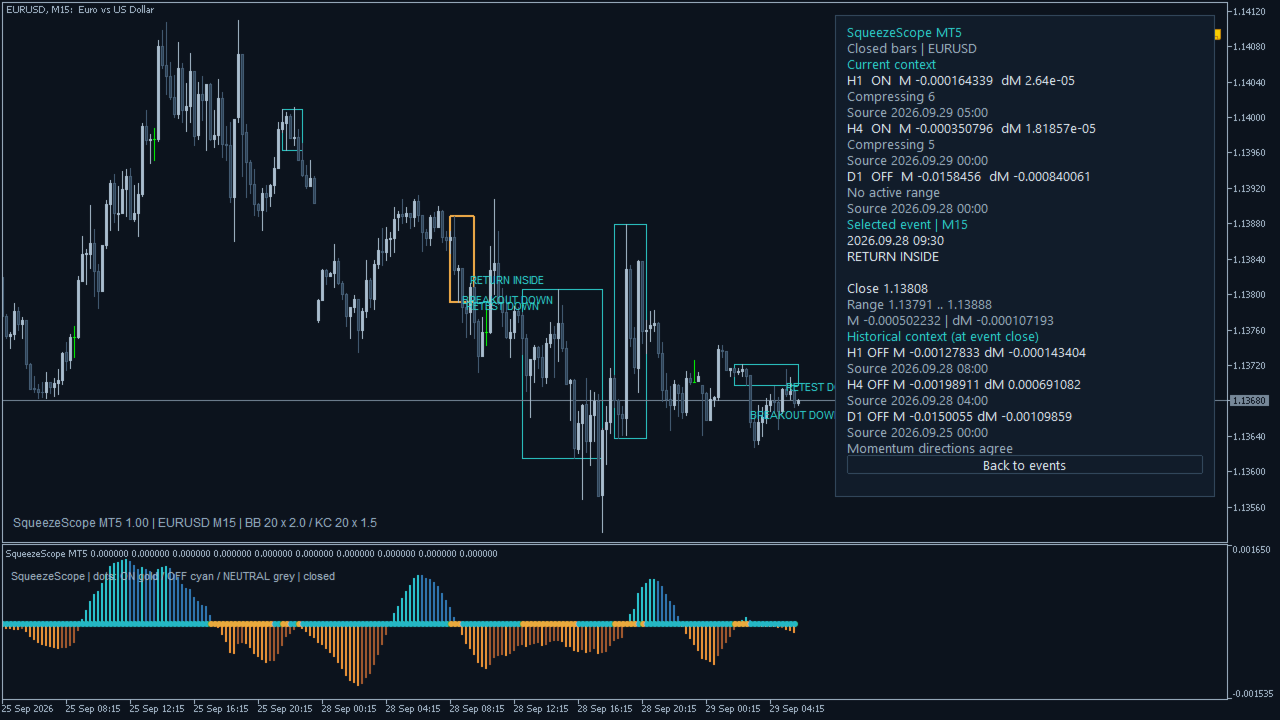
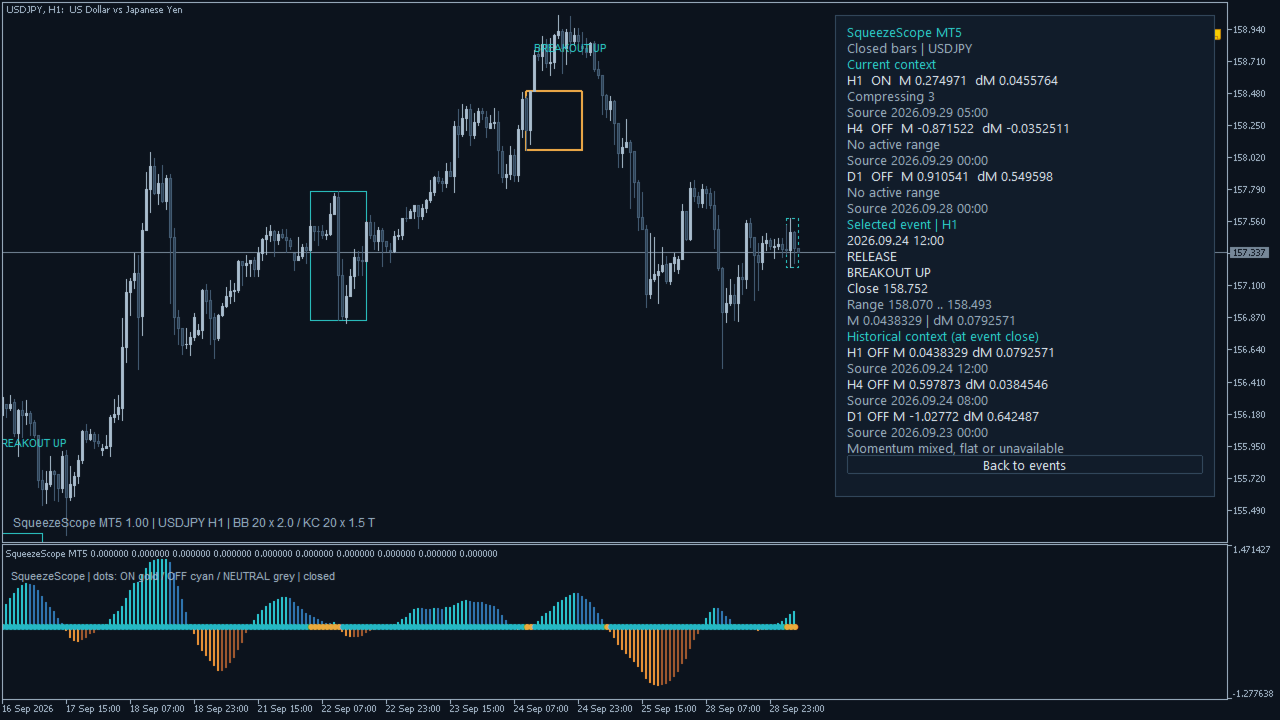
- Read the context of a past event. Select a chart event to view the last confirmed bars of three configurable periods as of that event, including squeeze state, numerical momentum and its change. Defaults are H1, H4 and D1. These historical values are separate from the current panel.
What the labels mean
RELEASE means a direct ON-to-OFF transition of Bollinger Bands relative to the Keltner Channel. ON-to-NEUTRAL-to-OFF does not generate a delayed RELEASE. A release can occur without a price breakout, and a basic release can have no eligible range or no momentum direction yet.
BREAKOUT UP / DOWN requires a candle to close strictly outside the fixed range. A close exactly on the boundary is not a breakout. Price determines the direction independently of the sign of momentum. By default, the exit bar and the next four closed bars are eligible.
RETEST is the first later candle that touches the broken boundary and closes outside in the breakout direction. The breakout candle itself cannot be a retest; a full gap over the boundary without touching it is not a retest.
RETURN INSIDE means a later close inside the range, including either boundary. CROSSED RANGE means a close beyond the opposite boundary. Both end observation. The default observation period is ten closed bars after the breakout. EXPIRED marks the following bar if the relevant window has elapsed; NEW COMPRESSION ends the previous active scenario when a new ON bar appears.
RELEASE and BREAKOUT on the same source candle share a log entry with both labels. A retest is recorded once; observation for a return continues. These labels describe price behavior, not entries, exits or profitable and losing trades.
Momentum and the chart
The calculation uses Bollinger Bands with a close SMA and population standard deviation, and a Keltner Channel with a close SMA and an SMA of True Range. High-Low range is an option. This KC calculation does not use Wilder-smoothed ATR. Momentum is the endpoint of a linear regression, not its slope.
The separate window contains the momentum histogram and ON/OFF/NEUTRAL zero-line markers. The price chart shows a forming range and the five latest fixed ranges. A current three-period panel is separate from the selected event's historical card. The event log holds up to 30 chart events, six per page. Selecting an older retained event temporarily highlights its range; with ShowBoxes=false, its numerical card remains available.
The interface and notifications are in English and use a blue-orange palette. Choose Auto, Light or Dark themes, one of four panel corners and a font size from 8 to 16.
Inputs and setup
- BbPeriod / BbMultiplier: 20 / 2.0. KcPeriod / KcMultiplier: 20 / 1.5. Periods accept 2–500; multipliers must be finite and positive.
- UseTrueRange: true; false uses High-Low.
- MinCompressionBars: 2, from 1–100. BreakoutWindowBars: 5, from 1–100, including the exit bar. FollowThroughBars: 10, from 1–100, starting after the breakout.
- PanelTf1 / PanelTf2 / PanelTf3: H1 / H4 / D1; CURRENT follows the chart period.
- HistoryBars: 5000, from 500–100000 output bars. Mathematical warmup is requested in addition.
- ShowPanel / ShowBoxes / ShowEventLog: true / true / true. Hiding these elements keeps the public buffers available.
- Theme / PanelCorner / FontSize: Auto / Right upper / 10.
- PopupAlerts / PushAlerts: false / false. AlertChart / AlertPanel: true / false.
- AlertRelease: false. AlertBreakout / AlertRetest / AlertReturn: true / true / true. AlertReturn covers RETURN INSIDE and CROSSED RANGE.
Attach the indicator to the symbol and period you want to study, then allow all required history to load. For mobile push, configure and test your own MetaQuotes ID in the terminal's Notifications settings before enabling PushAlerts. A delivery channel and the relevant source and event switches must all be enabled.
Notifications concern new confirmed events. Installation, input changes, restart, reconnection and history resynchronization rebuild the display without replaying historical messages. Duplicate periods share a source within one instance. Push attempts are spaced at least 6.1 seconds apart per instance; other programs also use terminal limits. Delivery failures are logged without automatic retries. EXPIRED and NEW COMPRESSION appear in the log without separate notifications.
Data and limits
All values and events use closed bars. All 12 public buffers are EMPTY_VALUE at shift 0; read shift 1 for the latest confirmed bar. Buffers expose momentum and its color, zero-line value and color, squeeze state, release flag and bias, fixed upper/lower boundaries, workflow state, event bitmask and breakout direction.
A historical snapshot uses only period bars known to have closed by the event's availability time, determined by the next actual source bar. Missing history is shown as N/A with a reason, never filled with present-day values. At default periods, momentum needs 39 source bars; its first actual bar-to-bar change needs 40.
The local event log is reconstructed from broker history. It is limited by HistoryBars, the available causal history and the latest 30 events. A scenario whose beginning is outside the processed range is removed with its dependent records instead of receiving a shortened range. Broker history corrections, changed inputs or an expanded calculation range can rebuild records and snapshots. This is not a permanent archive or an HTML/CSV export.
Version 1.00 is scoped to manual analysis of one chart symbol with three period contexts. It does not trade, manage orders, scan multiple symbols or estimate profitability. No claim of greater signal accuracy or returns is made.