Obsidian Scalper Pro
- Indicators
-
Evgenii Sutulov
 Premium components
1. https://www.mql5.com/en/market/product/201632 - Rotation Manager Console - Version: 1.0
- Activations: 20
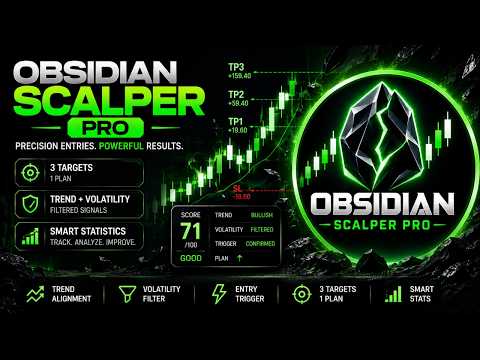
An arrow tells you to buy. Obsidian Scalper Pro tells you where to buy, where the stop goes, where the three targets are, how big the position should be for your risk, and how good the setup is out of 100. Every signal arrives as a finished trade plan drawn on the chart, and a built in statistics window shows the honest result of the last hundred of them, win rate with a confidence interval and all. Every decision is made on a closed bar, so the history you are looking at is the history you would have traded.
The indicator shows its best on gold (XAUUSD) M30, and it can be used on any other symbol and timeframe.
Want the strategy that goes with it? After your purchase, message me here on MQL5 and I will send it to you.
What it does
Obsidian Scalper Pro finds pullback entries inside an established trend and hands you a ready plan for each one. Entry, SL, TP1 and TP2, with an optional TP3, drawn as levels and shaded zones directly on the chart, with price tags and R:R ratios on them. A lot size computed from your risk percentage and the actual stop distance of that exact signal, using the loss tick value so it stays correct on CFDs and on cross currency accounts. And a Score from 0 to 100 for every signal, plus a live readiness figure on the panel that says how good a setup would be right now.
Three layers, one decision
Direction comes first: an ATR trailing line and two moving averages have to agree. Then the volatility filter, which blocks signals in dead compressed markets through an ATR regime test and a squeeze veto, and the panel says which of the two spoke rather than leaving you with a silent chart. Then the trigger: a pullback release confirmed on a closed bar.
An optional higher timeframe filter adds a fourth opinion, and it has three settings rather than a checkbox: off, a score bonus that keeps every signal, or a hard filter that only allows trades with the higher trend. The higher value is always taken from the last closed higher bar, so nothing repaints.
Honest statistics, built in
The statistics window covers the last N closed signals: win rate with a 95% confidence interval, TP1, TP2 and TP3 reach rates, gross points won and lost, profit factor, expectancy in points and in R, the longest winning and losing streaks, and a breakdown by session across Tokyo, London and New York. Small samples are marked as small. Every figure is gross and the panel says so, because a number that quietly nets out spread is a number you cannot check.
No repainting, and you can verify it
Every signal is decided on a closed bar and never moves afterwards. Reload the chart and the same history produces the same signals. That is the whole claim, and it is the kind that can be tested in a minute rather than believed.
The panel
A canvas panel on the price chart, draggable, collapsible, closeable, with a second window for the statistics that opens collapsed so two panels never cover half your chart on a first run. Trend speed and entry sensitivity are presets rather than raw periods, because the numbers underneath are a balance that was measured together. Sessions are a whitelist across Tokyo, London and New York, with the broker GMT offset detected from the server clock or set by hand. Targets are given in R. Alerts have one master switch, per event cooldown, and four channels: popup, sound, push to the mobile terminal, and e-mail.
A value moved on the panel takes effect at once, on a closed market too: the history is recomputed there and then rather than waiting for the next tick. Three colour themes, one of them colour blind safe. Your layout and settings are remembered per chart, and a chart that has never carried this indicator inherits the last arrangement rather than starting from the compiled defaults.
Reading it from an EA
Fourteen buffers, all readable through iCustom and CopyBuffer, and the plan sits at the front of the map where a strategy expects it: 0 Buy, 1 Sell, 2 SL, 3 TP1, 4 TP2, 5 TP3, 6 Score, 7 Entry, 8 Signal, 9 Direction. The drawn trend line follows as a value at 10 with its colour index at 11, and the trend cloud is the pair at 12 and 13. Every row appears in the Data Window under its own label.
Buy and Sell keep buffers 0 and 1, which is where a strategy expects them. Signal is a one bar event, plus one on a buy and minus one on a sell, so a repeated value never looks like a fresh entry. The levels are different: they are the plan in force, written on every bar from the signal to the bar the plan closed on, so an EA reading bar N gets the stop and the targets it should be holding at bar N without walking backwards to find them. Bars with no plan in force hold EMPTY_VALUE, which is distinguishable from a real price of zero.
⚠ This map is the MetaTrader 5 one and it is not the MetaTrader 4 one. MetaTrader 4 draws at most eight buffers, so there the drawn series take the front of the map and the plan data moved to 7 through 14. Buy and Sell agree on both platforms; everything else moved. An expert written for one edition must be pointed at the right list.
⚠ The parameter list is also longer here. A MetaTrader 5 input group occupies an iCustom slot exactly like a real parameter, and MetaTrader 4 has no groups at all, so this edition's call has six slots the MetaTrader 4 one does not. iCustom is positional and this failure is silent: the indicator loads, returns a handle and computes from numbers nobody chose. Count the list for the platform you are calling.
Honest limits
This is a scalping system for a trending market. In a range the trend layer will keep changing its mind, the volatility filter will block a good deal of it, and what gets through will be the worst of both. The panel tells you when it is blocking and why; it does not tell you that the market is worth trading today.
The Score is a ranking of setups against each other, not a probability. A 90 is a better setup than a 60 by the engine's own measure, and it is not a ninety percent chance of anything.
The statistics are the honest result of this engine on the history your broker gave you, gross of spread and commission, on the settings currently in force. Change a setting and they are the statistics of a different system. No profit figure, win rate or backtest result is claimed here beyond what the window computes in front of you.
The lot size is arithmetic on your risk percentage and the stop distance, and it is a suggestion the indicator draws. It places no orders and manages no positions.