Level Reaction
- Indicators
-
Artem Koliada
 MQL4/MQL5 Developer 💻 | Turning trading strategies into profitable code. Expert Advisors (EA) & Custom Indicators for MT4/MT5. Let's automate your trading
 - Version: 1.10
- Updated: 4 September 2026
- Activations: 8
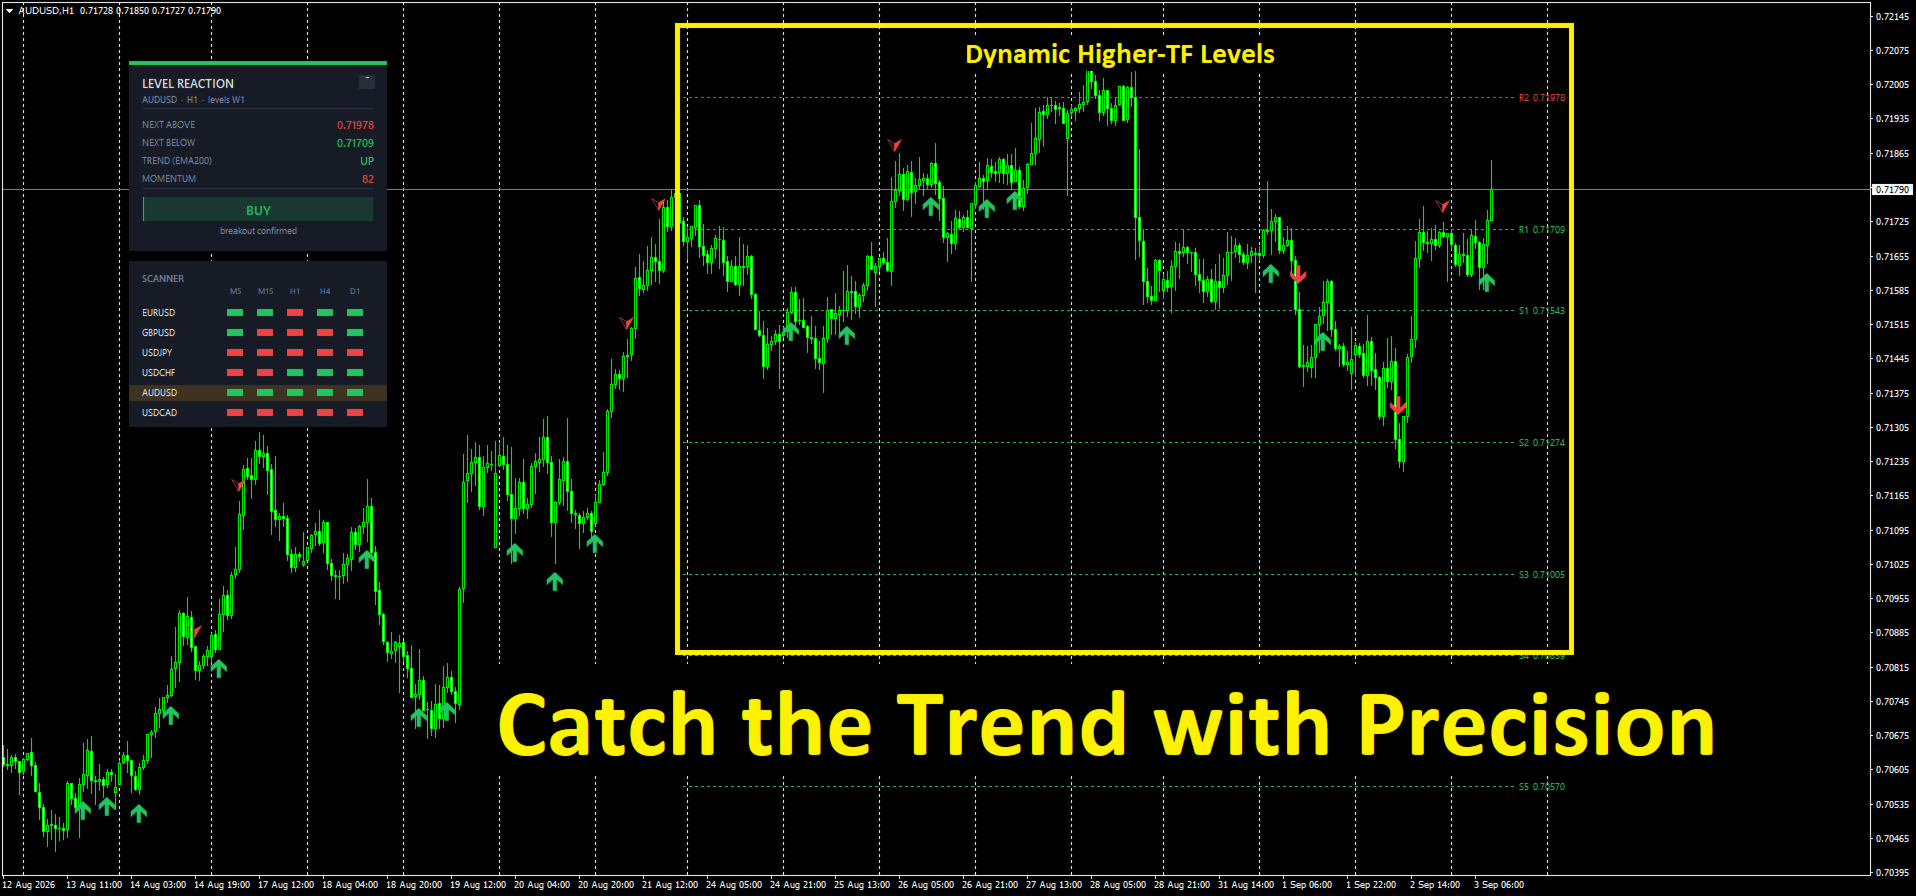
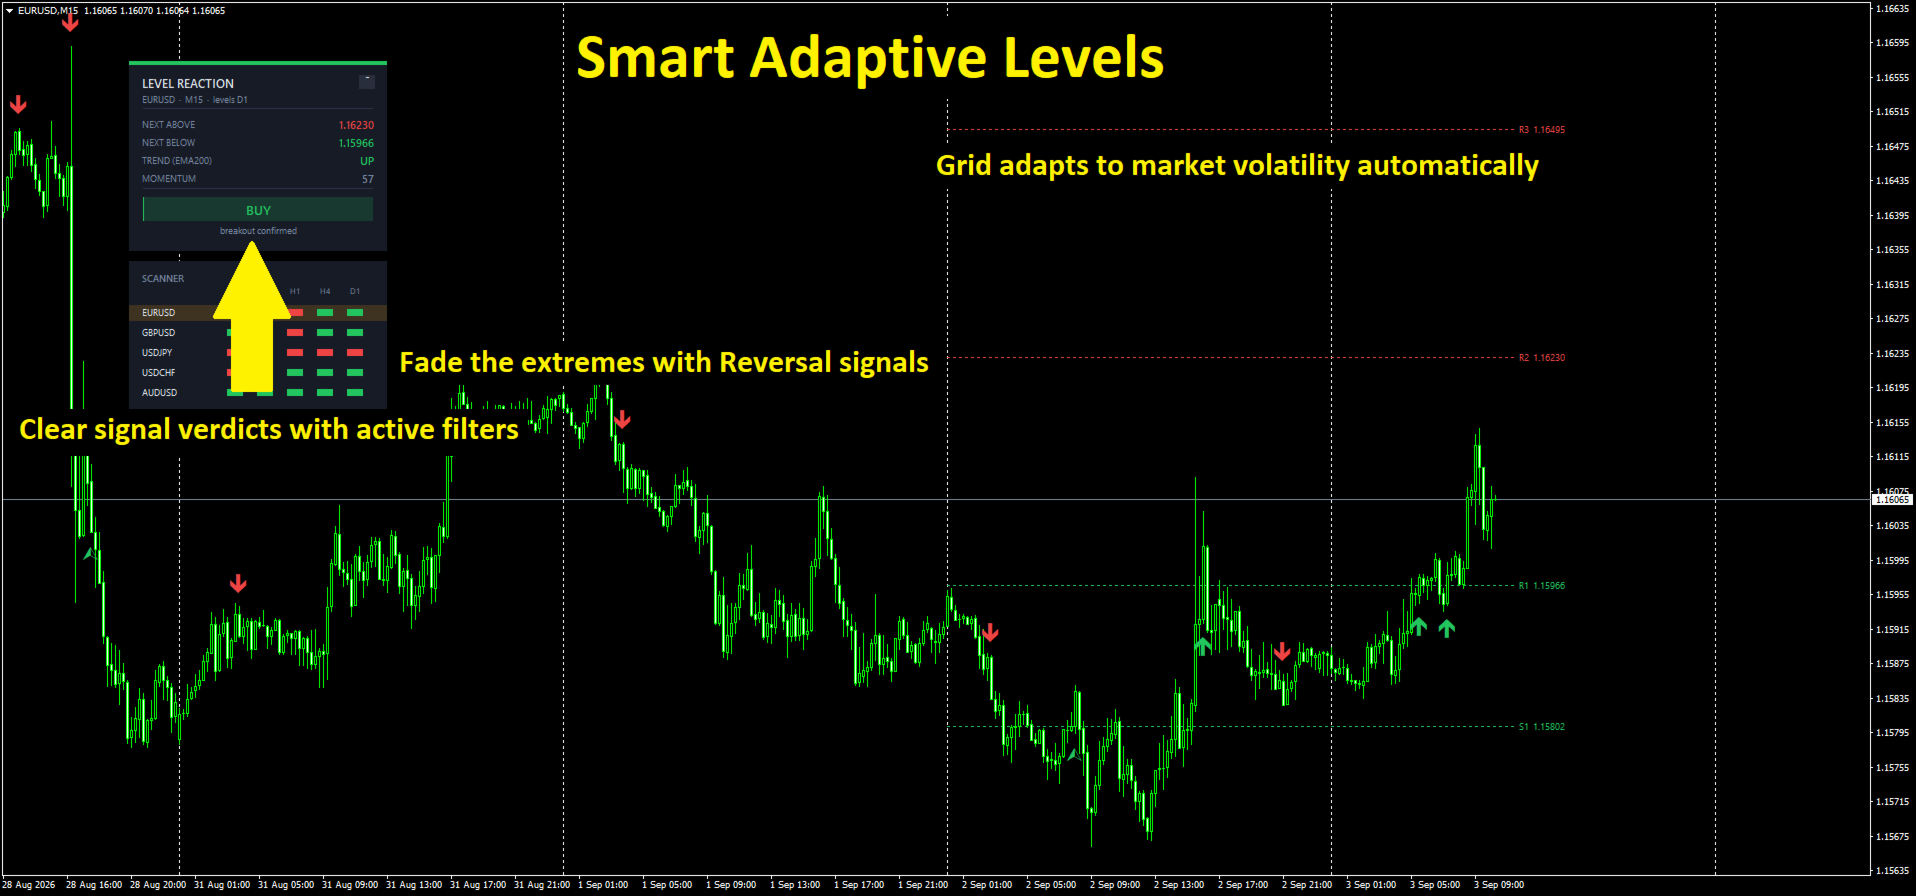
Level Reaction plots support and resistance levels from the higher timeframe and marks two kinds of price reaction to them: a breakout continuation and a reversal at the level. It works on any symbol and any timeframe available in your terminal.
How the levels are built
At the start of each higher-timeframe bar, the indicator takes the prior bar's high, low and close and derives five resistance levels and five support levels around that close. The spacing between levels adapts to how wide the prior bar's range was: a wide range produces a tighter grid, a narrow range produces a wider grid, so the levels stay proportional to recent volatility instead of using a fixed pip distance. The higher timeframe is chosen automatically from your chart period — for example, a chart on M5, M15 or M30 uses the daily bar; H1 and H4 use the weekly bar; D1 and above use the monthly bar. Lines are drawn only for the period they belong to, not stretched across the whole chart history.
Two signal types
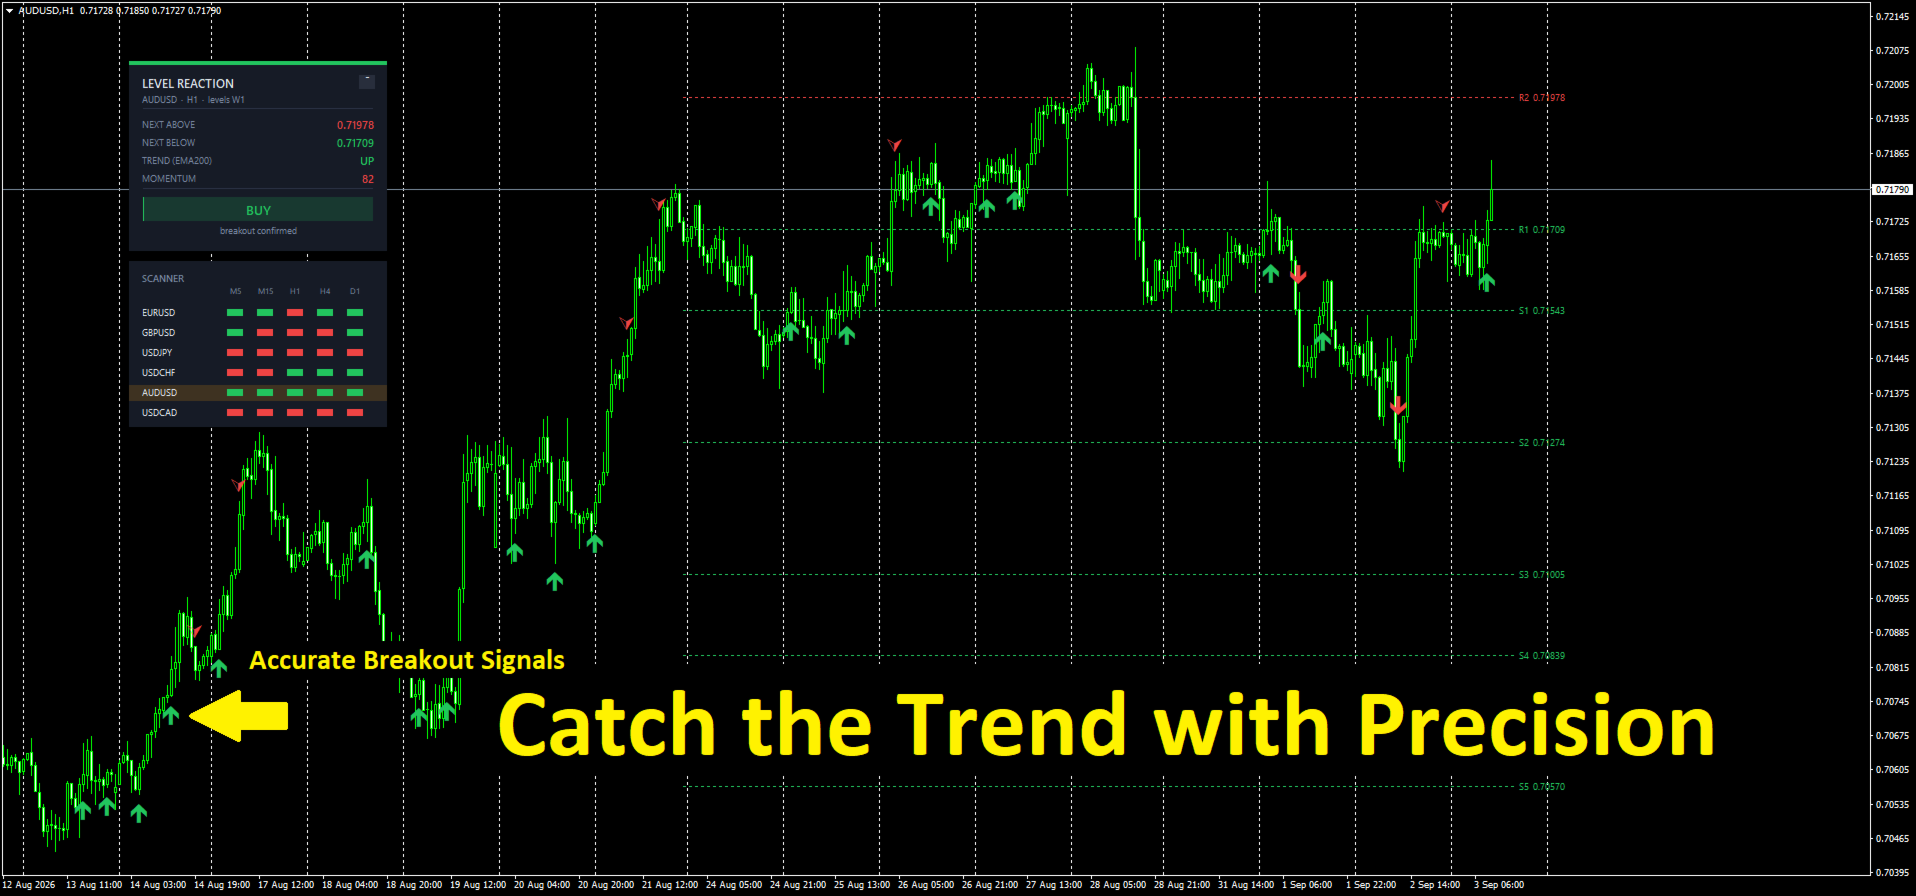
A breakout signal fires when price closes through a level in the direction of the trend filter (EMA). Signals are only generated on the crossing bar itself, not on every bar price happens to sit beyond the level, which keeps the chart free of repeated arrows while price consolidates near a line.
A reversal signal fires when price touches a level while a weighted stochastic reading (a blend of a fast, medium and slow stochastic) shows an extreme reading on the correct side — overbought at resistance, oversold at support. Each level can only fire one reversal signal per higher-timeframe period, so the same level does not repeat the same signal while price keeps testing it.
Both signal types can be switched off independently. A cooldown setting enforces a minimum number of bars between any two signals, which is useful on lower timeframes where price can otherwise chop around a level.
Optional filters
A higher-timeframe bias filter can require every signal to agree with the trend on a separate, higher timeframe before it is allowed to fire. A session filter restricts signals to a chosen hour range in server time, including ranges that wrap past midnight.
Information panel
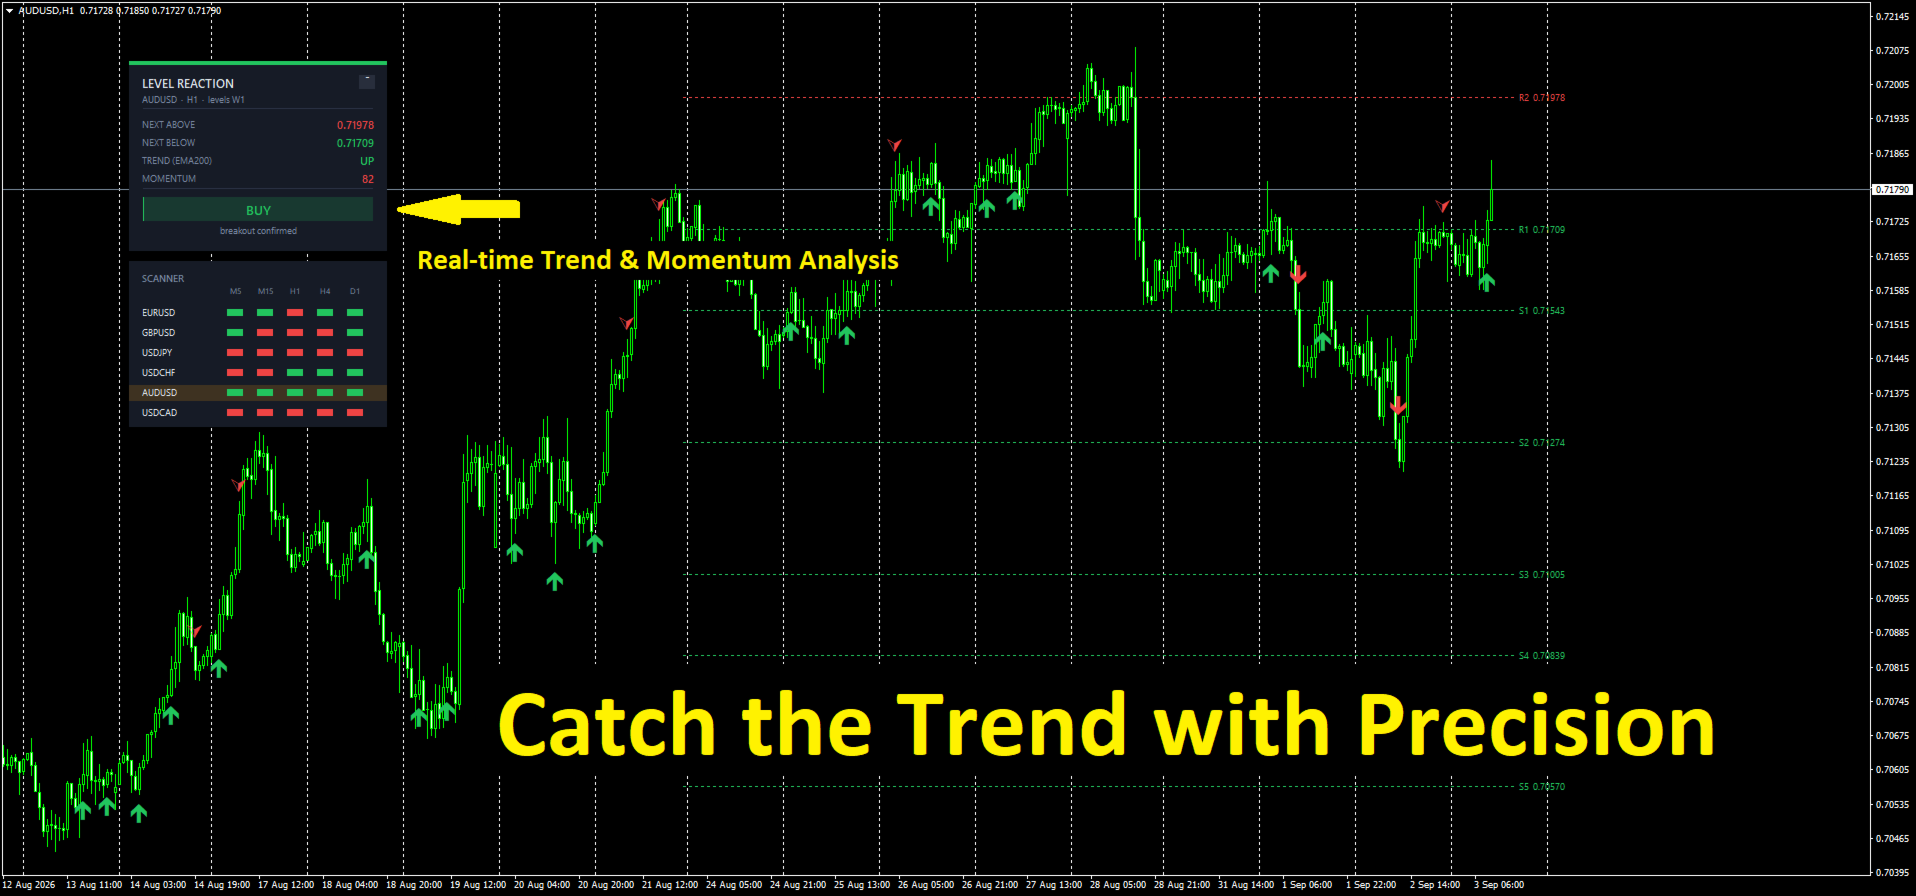
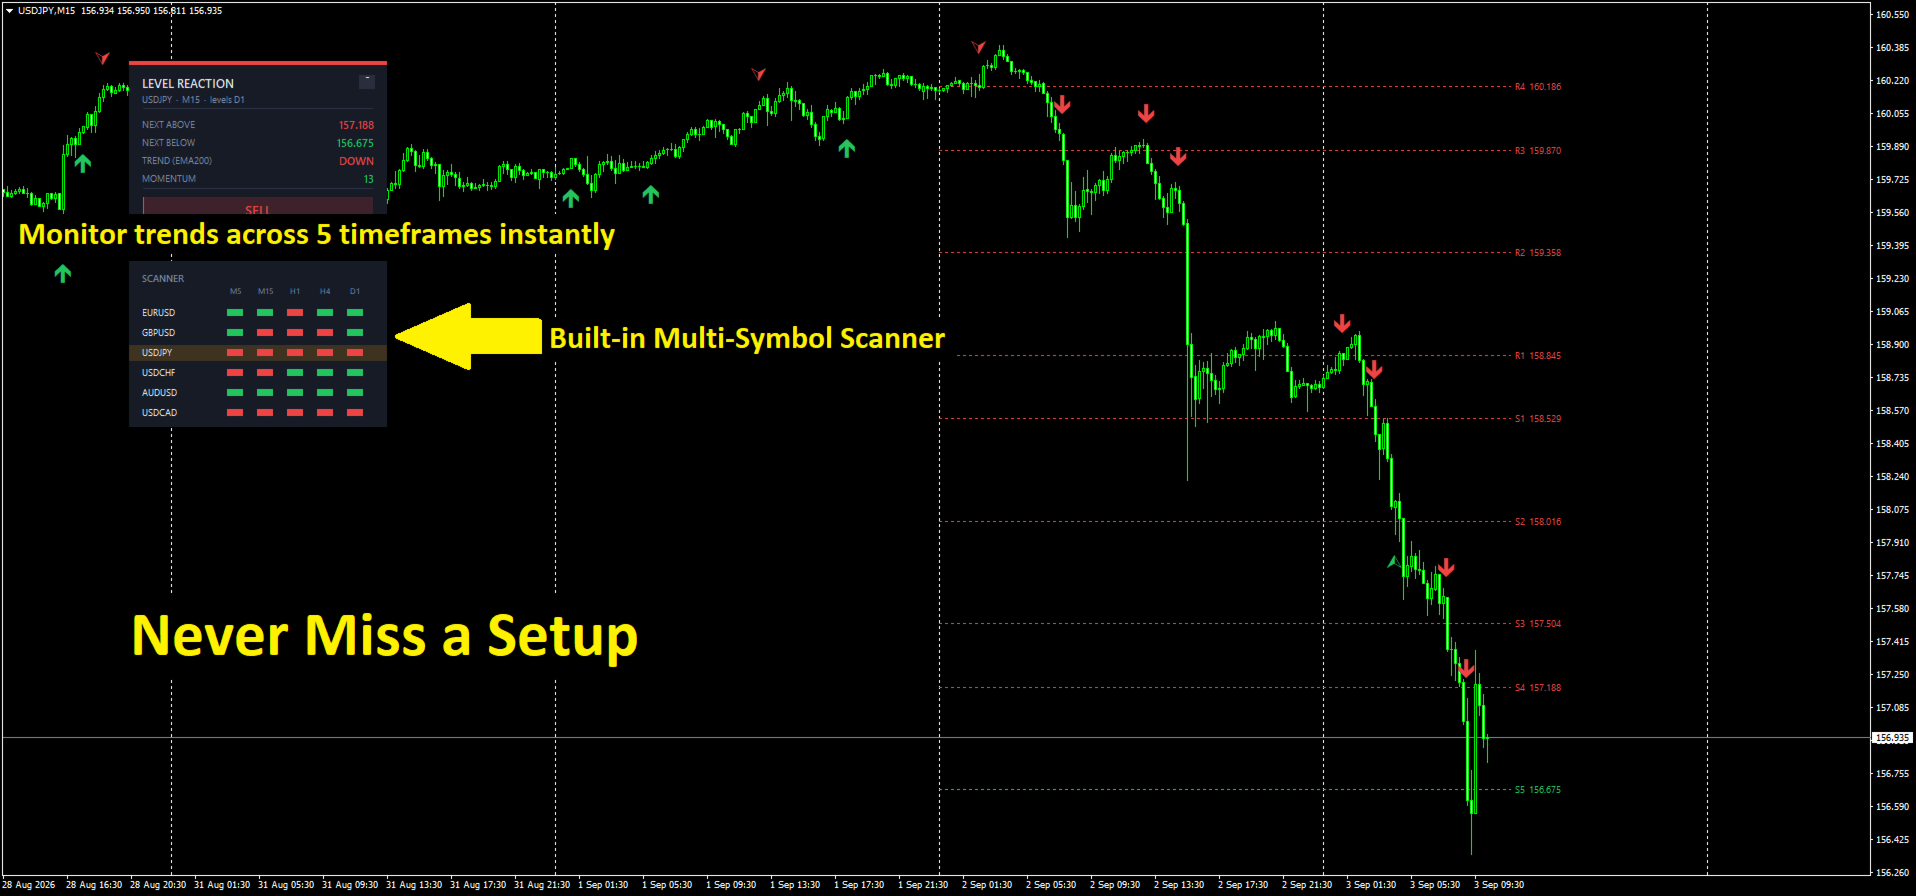
The panel shows the nearest level above and below the current price, the trend direction relative to the EMA filter, the current weighted momentum reading, and the last verdict with a short status line. Active filters are listed under the verdict so it is clear why a signal did or did not fire. The panel can be collapsed to a small header and dragged anywhere on the chart; its position is remembered between sessions.
Multi-symbol scanner
Below the panel, an optional scanner lists a set of symbols you define and shows the trend direction on five configurable timeframes for each one, using color blocks rather than numbers for a quick visual read. It works from a single chart — you do not need to attach the indicator to every symbol separately. Clicking a row switches the current chart to that symbol. The scanner resolves broker-specific symbol suffixes and prefixes automatically, so a plain name such as EURUSD in the symbol list still works on brokers that use names like EURUSD.pro or mEURUSD.
Notes
All levels and signals are calculated from closed bars only; nothing is repainted after a bar closes. The indicator does not place trades, manage positions, or connect to any external service — it is a charting and alerting tool. Test it on your own symbols and timeframes in the Strategy Tester before using it on a live chart, since level spacing and signal frequency vary by instrument and volatility regime.