PA Hunter
- Indicators
-
Artem Koliada
 MQL4/MQL5 Developer 💻 | Turning trading strategies into profitable code. Expert Advisors (EA) & Custom Indicators for MT4/MT5. Let's automate your trading
 - Version: 1.0
- Activations: 8
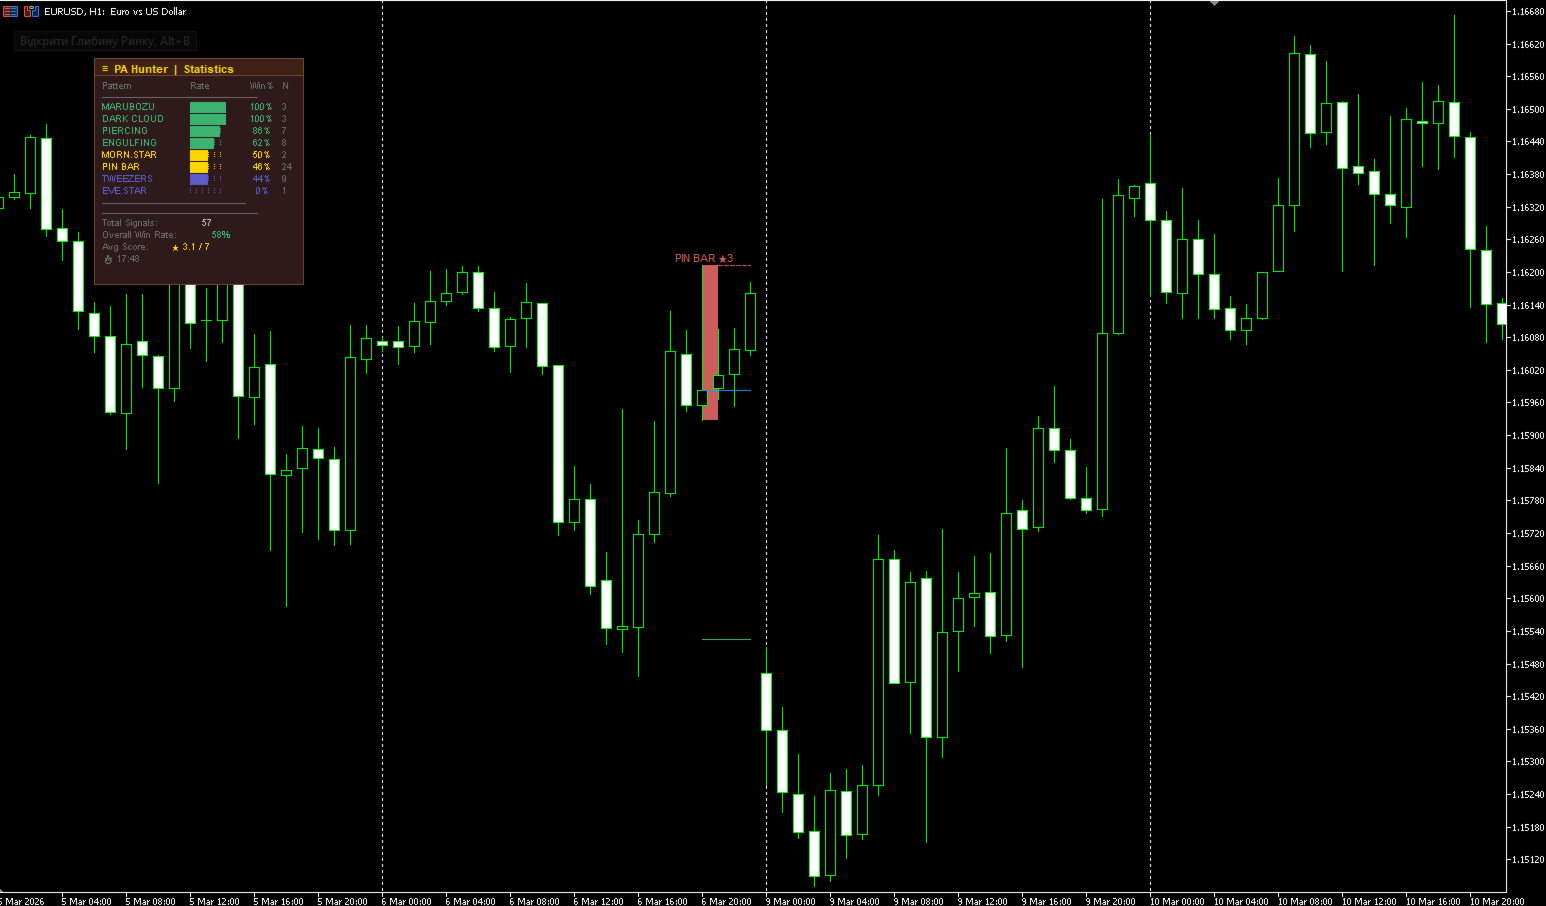
PA Hunter detects 13 classical Price Action patterns on any symbol and timeframe, filters them using built-in context rules and an AI model trained on real historical signals.
How It Works
The indicator scans price data for the following patterns:
Reversal patterns: Pin Bar, Engulfing, Morning Star, Evening Star, Railway Tracks, Tweezer Tops/Bottoms, Piercing Line, Dark Cloud Cover, Three Soldiers, Three Crows
Continuation/Neutral: Inside Bar, Doji, Marubozu
Each detected signal passes through a multi-layer filter system before being displayed on the chart.
Signal Quality Score (0–7 stars)
Every signal receives a quality score based on seven criteria:
- Proximity to Support/Resistance zone
- S/R zone confluence (swing + volume)
- EMA trend alignment
- Candle size relative to ATR
- Tick volume confirmation
- Multi-timeframe EMA agreement
- Position in price range
Support and Resistance Zones
The indicator automatically identifies two types of zones:
- Swing zones — based on swing highs and lows
- Volume zones — based on horizontal volume clusters
When both methods confirm the same level, the zone is marked as a confluence zone with higher strength rating.
AI Filter (ONNX)
An embedded LightGBM model trained on 9,000+ real historical signals filters out low-probability setups. The model analyzes pattern type, market context, time of day, volatility and trend direction.
At confidence threshold 0.55, historical win rate on test data: 82%
The AI model can be disabled to view all signals without filtering.
Statistics Dashboard
A movable statistics panel displays real-time signal performance:
- Win rate per pattern type
- Visual progress bars
- Total signals evaluated
- Average signal score
The panel can be dragged to any position on the chart and remembers its location across sessions and timeframe switches.
TP/SL Levels
Each signal displays three horizontal lines:
- Blue solid — entry level (pattern close price)
- Green dashed — take profit (calculated per pattern logic)
- Red dotted — stop loss
Take profit levels are calculated using classical Price Action rules specific to each pattern type.
Parameters
Pattern Settings
- Chart Labels Language — English / Spanish / Ukrainian
- Show Pin Bar — enable/disable Pin Bar signals
- Show Engulfing — enable/disable Engulfing signals
- Show Inside Bar — enable/disable Inside Bar signals
- Show Doji — enable/disable Doji signals
- Show Morning/Evening Star — enable/disable Star patterns
- Show Railway Tracks — enable/disable Railway Tracks
- Show Tweezer Tops/Bottoms — enable/disable Tweezers
- Show Marubozu — enable/disable Marubozu
- Show Piercing/Dark Cloud — enable/disable Piercing and Dark Cloud
- Show 3 Soldiers/3 Crows — enable/disable Three Soldiers and Three Crows
Smart Filters
- Filter small candles (noise) — removes signals on candles smaller than average
- Only signals at swing extremes — shows signals only at local price extremes
- Bars for swing extreme detection — lookback period for swing detection
- EMA trend alignment filter — requires signal direction to match EMA trend
- EMA period — period for trend EMA (50 recommended)
- Bull only after downmove, Bear after upmove — trend context filter
- Bars to determine trend context — range for context analysis
- Minimum signal score to display — filters out low-quality signals (0–7)
- Maximum bars to analyze — limits historical scan depth
Support and Resistance Zones
- Show S/R zones on chart — enable/disable zone display
- Bars for swing high/low detection — swing detection window
- S/R zone lookback depth — how far back to search for zones
- Volume profile bars — bars used for volume analysis
- Zone merge distance — merges nearby zones within N × ATR
- Zone transparency — visual transparency of zones
- Zone border width — border line width
- Show only strong zones — display only zones with strength 3+
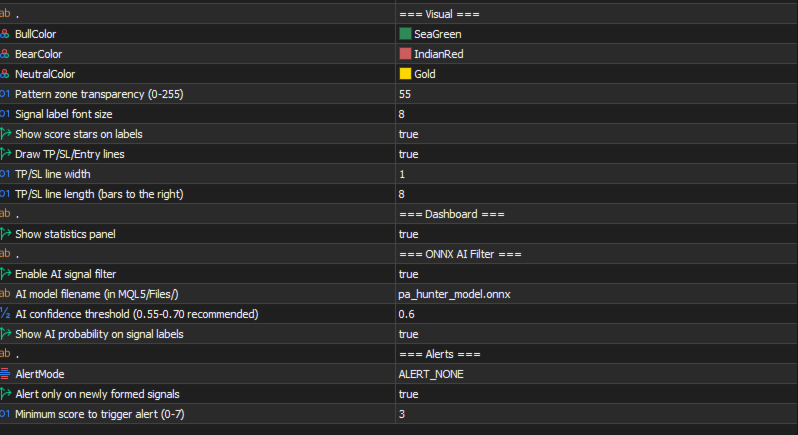
Visual Settings
- Bullish signal color
- Bearish signal color
- Neutral signal color
- Pattern zone transparency
- Signal label font size
- Show score stars on labels
- Draw TP/SL/Entry lines
- TP/SL line width
- TP/SL line length (bars)
Statistics Dashboard
- Show statistics panel
AI Filter (ONNX)
- Enable AI signal filter
- AI model filename — file must be placed in MQL5/Files/ folder
- AI confidence threshold — signals below this value are not displayed
- Show AI probability on signal labels
Alerts
- Alert mode — None / Popup / Push / Both
- Alert only on newly formed signals
- Minimum score to trigger alert
Installation
- Copy PA_Hunter.mq5 to MQL5/Indicators/ folder
- Copy all .mqh files to MQL5/Include/ folder
- Copy pa_hunter_model.onnx to MQL5/Files/ folder
- Attach the indicator to any chart
The AI model file (pa_hunter_model.onnx) must be present in the MQL5/Files/ folder for the AI filter to work. Without it, the indicator operates in standard mode displaying all filtered signals.