
Strategy Ledger Pro
- 유틸리티
-
Abdullah Uygar Tuna
 알고리즘 트레이딩, 퀀트 분석 및 실용적인 MetaTrader 5 도구 개발에 주력하는 IT 전문가입니다.
Strategy Ledger와 Strategy Ledger Pro의 개발자입니다. 두 제품은 복잡한 거래 내역을 명확한 성과 인사이트와 자산 곡선 분석으로 전환해 주는 인기 있는 읽기 전용 MT5 분석 대시보드입니다. - 버전: 4.43
- 업데이트됨: 13 10월 2026
- 활성화: 10
이제 한국어로 이용할 수 있습니다.
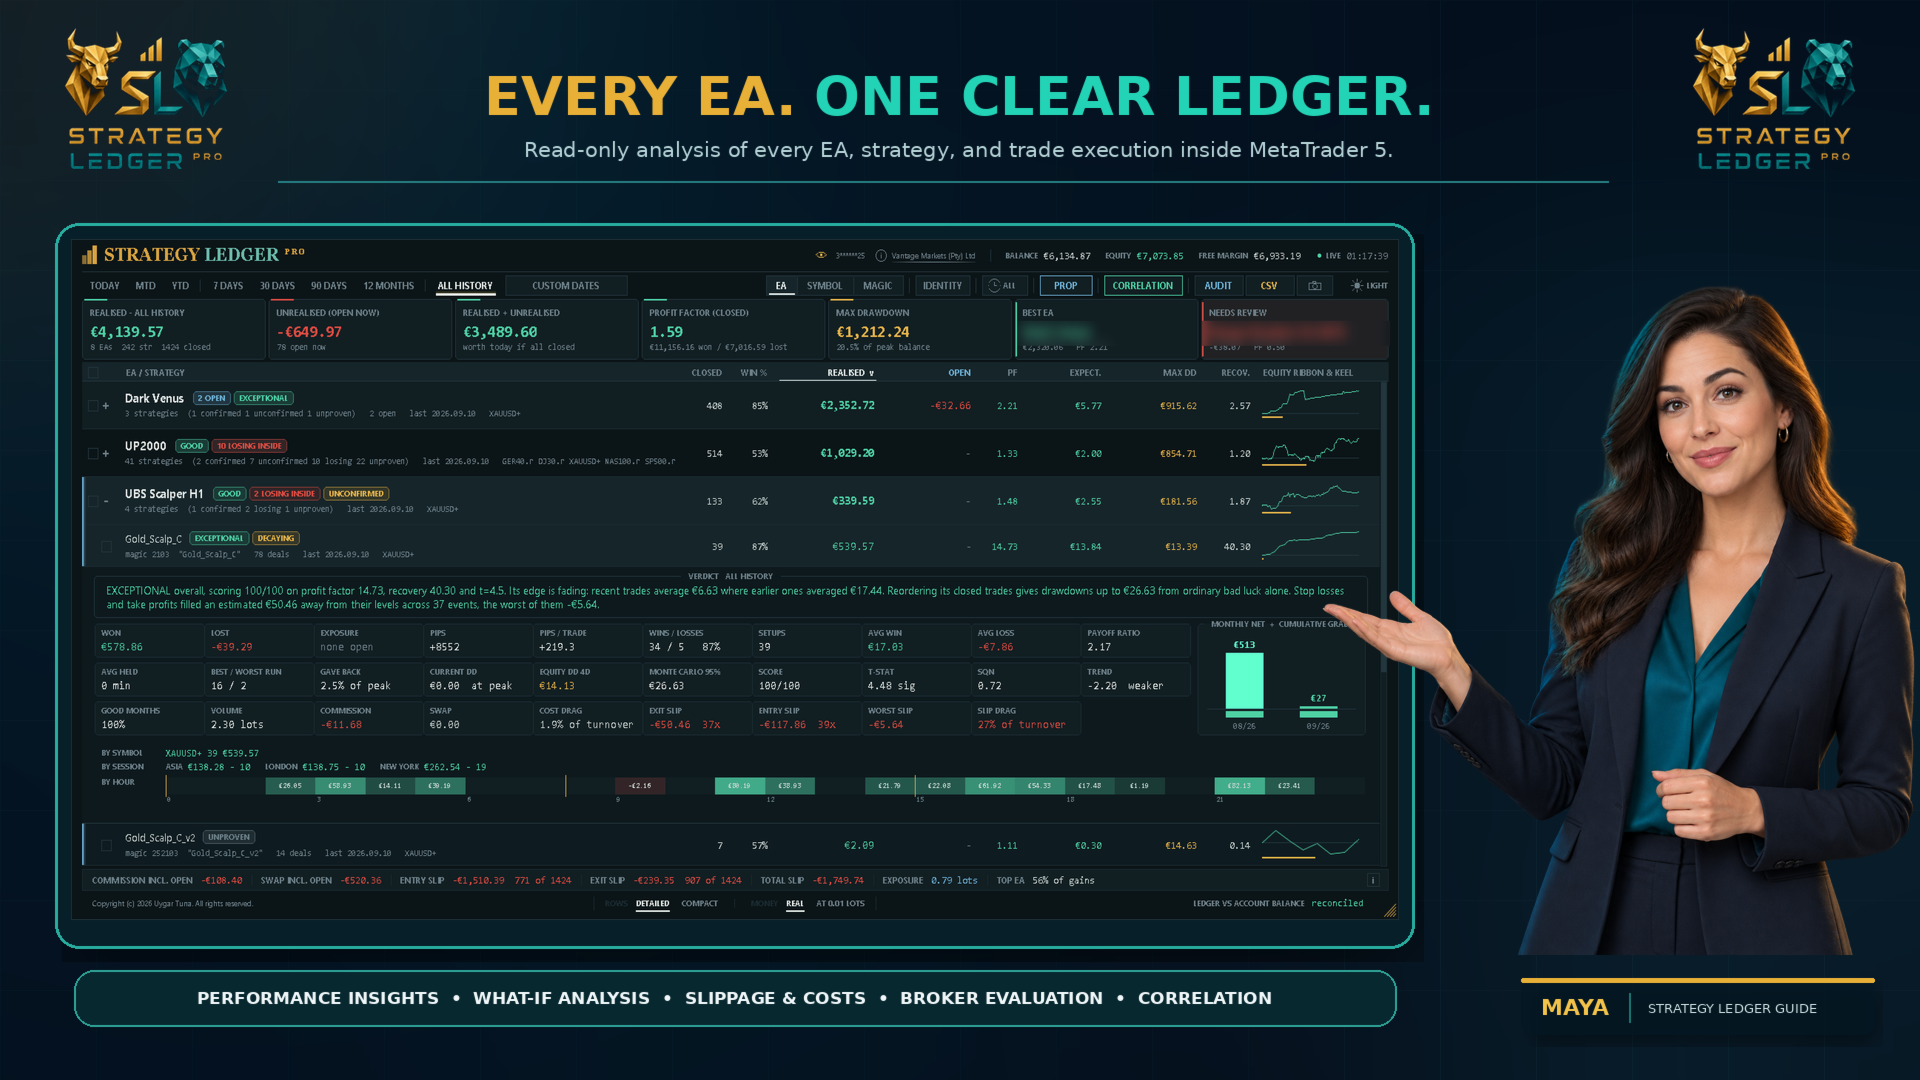
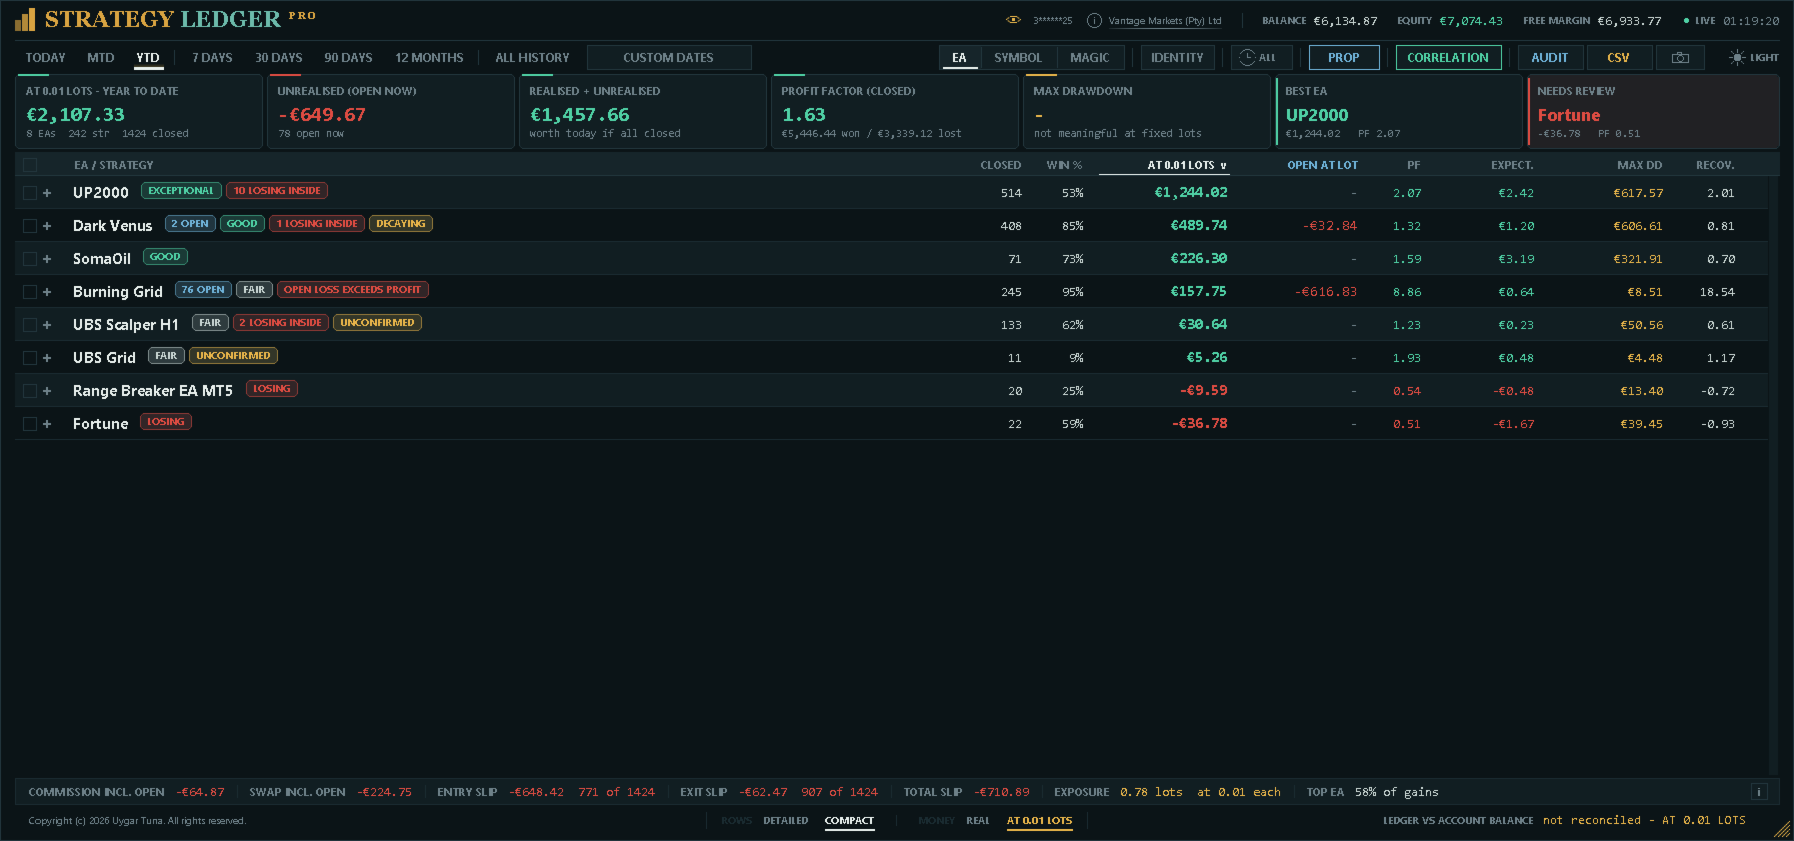
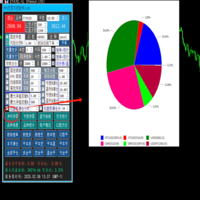
Strategy Ledger Pro는 MetaTrader 5용 읽기 전용 계좌 분석 패널입니다. 계좌 성과를 전문가 어드바이저(EA), 전략, 심볼, 매직 넘버별로 나누어 각각이 실제로 얼마나 기여하는지 보여줍니다.
패널은 11개 언어를 지원합니다: English, Français, Deutsch, Español, Italiano, Português, Русский, Türkçe, 中文, 日本語, 한국어.
데모를 다운로드하기 전에. Market은 모든 유료 제품의 데모를 전략 테스터에서만 실행합니다. 이 패널은 사용자 자신의 계좌 거래를 분석하는데, 전략 테스터에는 읽을 계좌 기록이 없으므로 데모는 빈 패널로 열리고 그 사실을 표시합니다. 이는 데모 방식에 따른 것이며 제품의 제약이 아닙니다.
이 설명의 동영상에서 실계좌에서 작동하는 패널을 확인할 수 있습니다.
모든 기능을 설명한 자세한 매뉴얼(영문)과 토론 및 공지를 위한 AureusAI Trading Suite 그룹이 마련되어 있습니다.
MetaTrader는 계좌 전체에 대해 하나의 잔고만 보여줍니다. 여러 EA가 함께 거래할 때 그 잔고로는 각 EA의 기여를 알 수 없습니다. Strategy Ledger Pro는 계좌 기록을 읽고, 청산된 포지션을 재구성하여 전략별로 배정한 뒤, 그 결과를 하나의 패널에 보여줍니다.
이 제품은 주문을 열거나 수정하거나 청산하지 않습니다. 거래 전략을 포함하지 않으며, 지표를 만들지 않고, 차트 가격을 읽지 않습니다.
주요 기능
- EA, 개별 전략, 심볼 또는 매직 넘버별 성과.
- 기본 기간, 사용자 지정 날짜 범위, 아시아·런던·뉴욕 세션 필터.
- 실현 및 미실현 손익, 보유 포지션, 거래 통계, 핍, 낙폭, 자산 곡선.
- 수수료, 스왑, 비용 부담, 추정 진입·청산 슬리피지와 그 합계.
- 고정 규칙에 따른 성과 등급, 서면 요약, 상태 표시.
- 셋업: 함께 진입했거나 바스켓으로 함께 청산된 포지션은 신뢰도 지표에서 하나의 결정으로 계산됩니다.
- 계좌와 각 행의 실시간 자산 낙폭 추적.
- 이름 변경, 그룹화, 이동, 숨기기, 복원, 펼치기, 정렬을 대화식으로 수행.
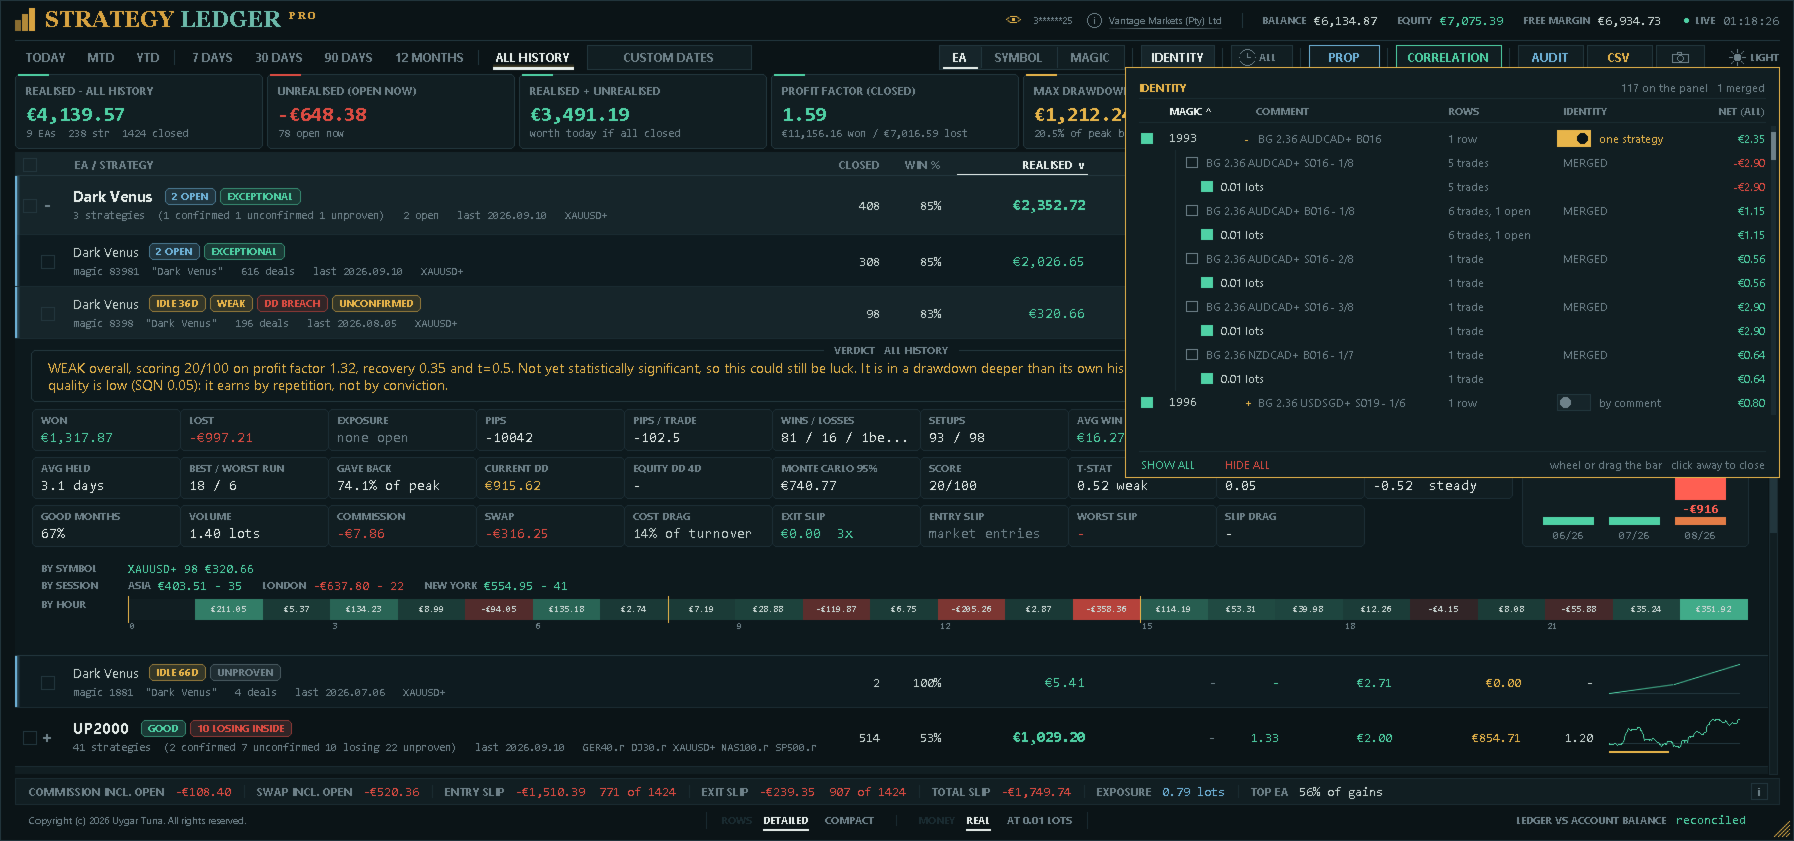
- 식별 설정: 매직 넘버를 하나 또는 여러 전략으로 지정하고, 매직 넘버나 랏 크기를 그 가치를 표시한 채 패널에서 제외.
- 고정 랏 모드: 모든 거래를 하나의 랏 크기로 다시 계산하며, 가정 시나리오임을 명확히 표시.
- 모든 전략의 세션별, 시간대별 성과.
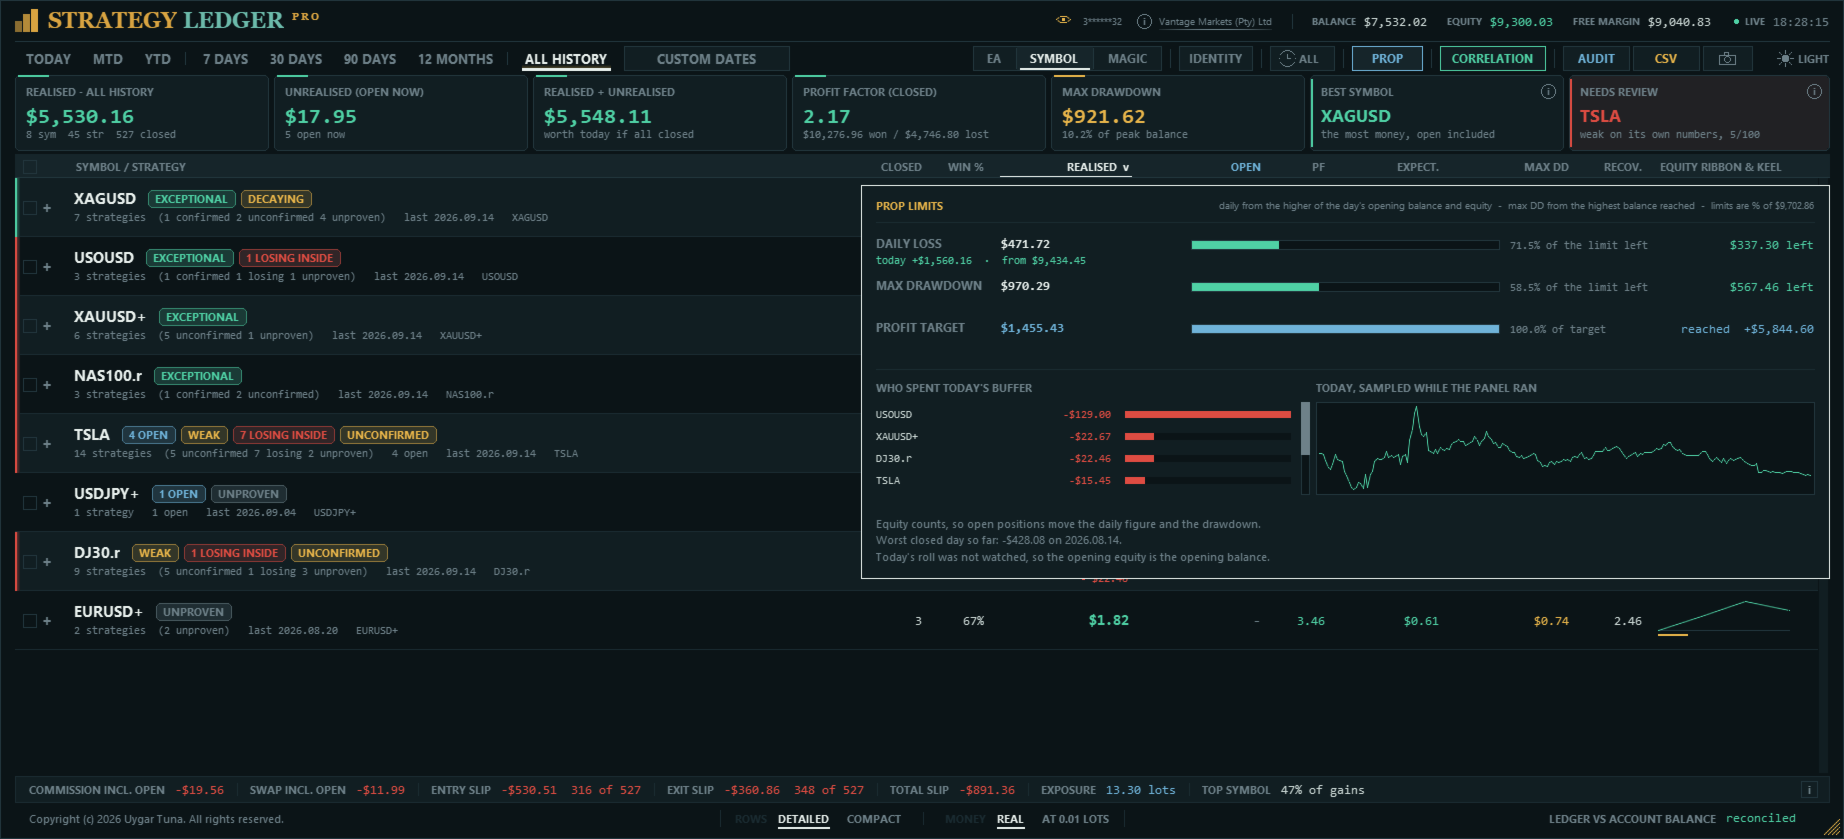
- 프롭 펌 한도: 일일 손실, 최대 낙폭, 수익 목표와 각 항목의 남은 여유.
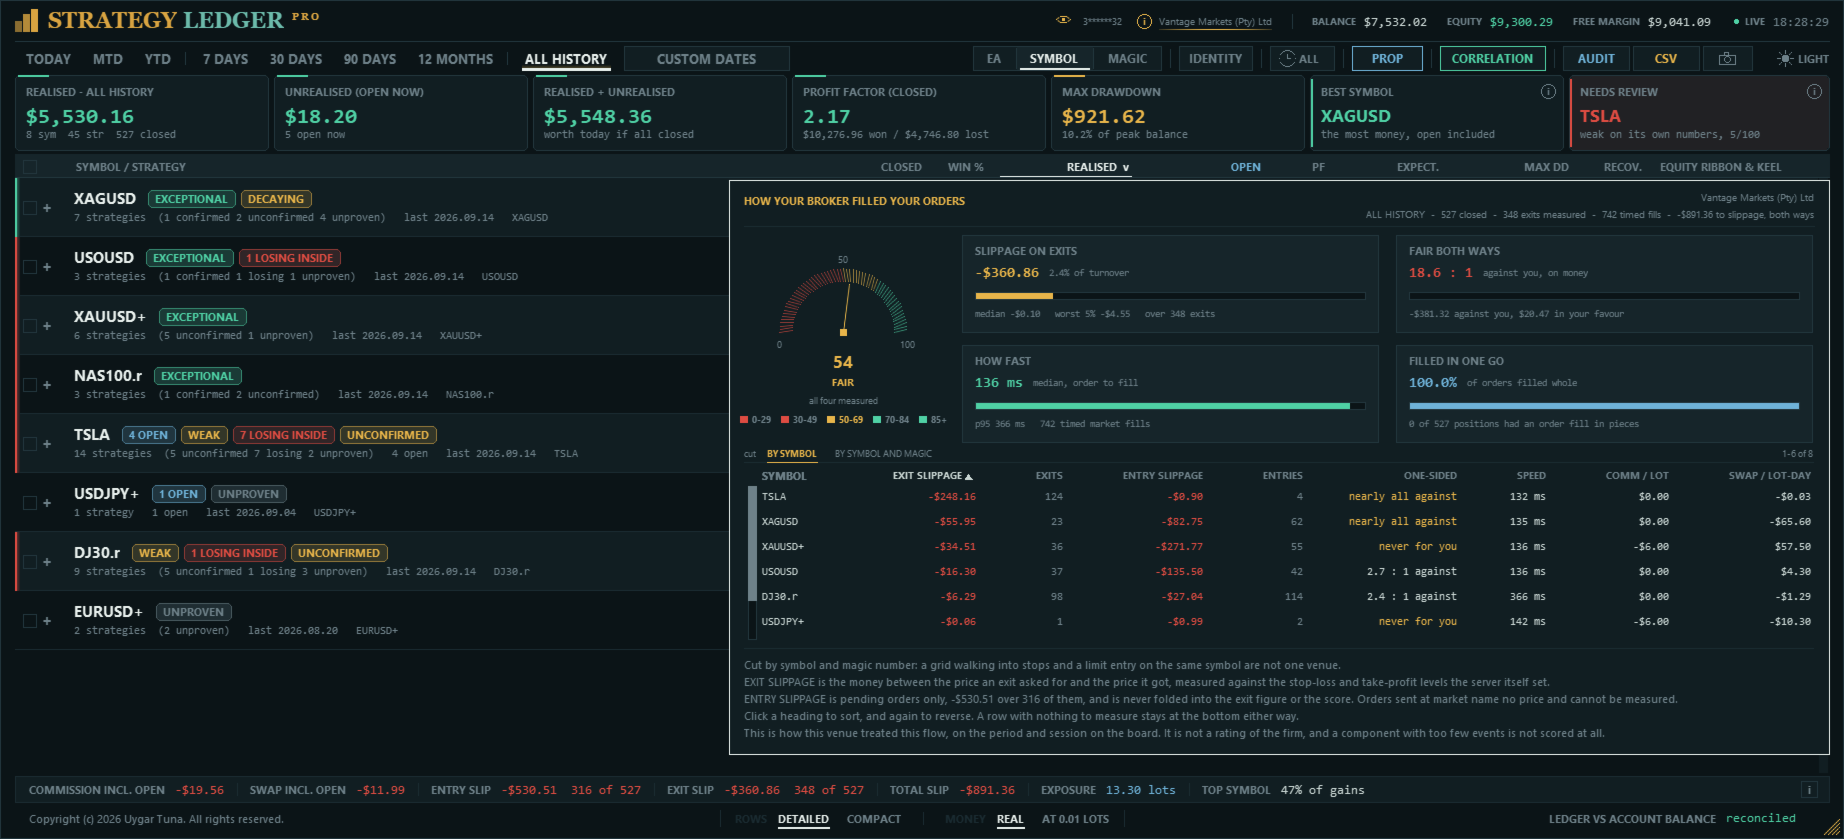
- 체결 보고서: 체결 비용, 유리한 체결과 불리한 체결이 같은 빈도로 일어나는지, 체결 속도, 랏당·랏-일당 비용.
- 거래일 시작 이후 각 행의 변화를 보여주는 일일 변화 표시.
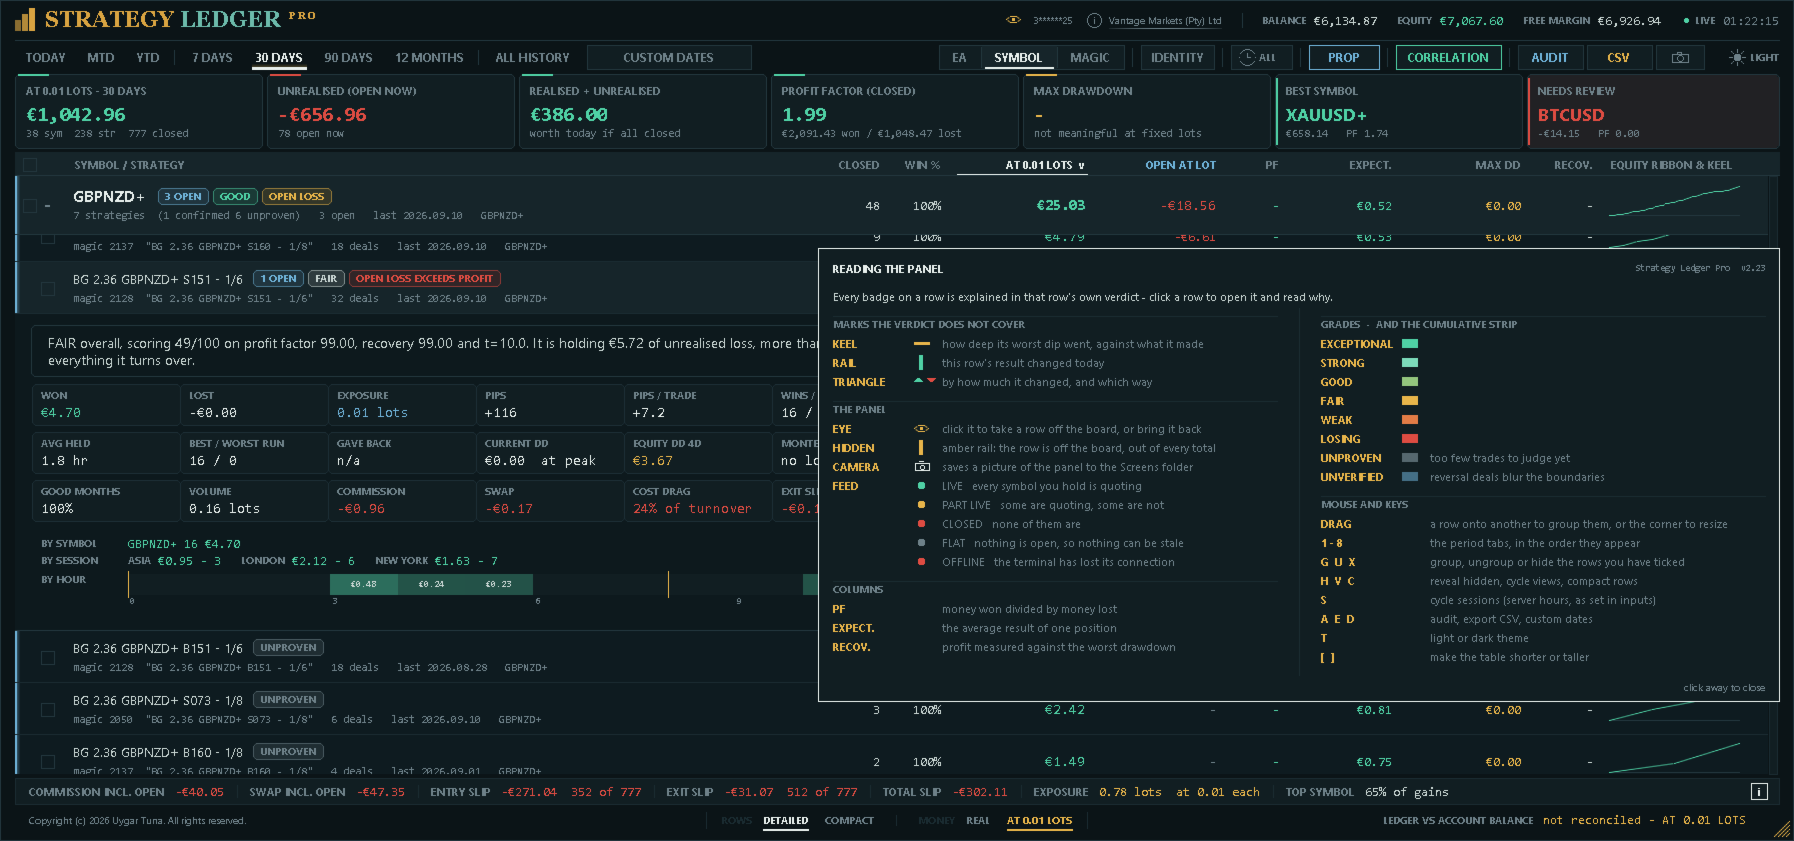
- 모든 표시, 열, 키보드 단축키를 설명하는 패널 내 가이드.
- 일별 청산 성과를 바탕으로 한 EA, 전략 또는 심볼 간 상관관계.
- 등급 기록: 거래 기록으로 재구성한 각 행의 월별 등급.
- 전략 테스터 보고서: 하나 이상의 HTML 보고서를 같은 패널에서 확인. 시뮬레이션으로 표시되며 계좌와 절대 섞이지 않습니다.
- 공유 카드: 클릭 한 번으로 계좌 번호와 브로커 이름이 없는 EA 성과 이미지를 저장.
- 설정에서 한 번만 선택하면 되는 11개 언어 인터페이스.
- CSV 형식의 상세 지표 및 감사 내보내기, PNG 형식의 패널 스크린샷.
계좌 데이터 구성 방식
Strategy Ledger Pro는 개별 체결이 아닌 완료된 포지션을 셉니다. MetaTrader는 하나의 포지션을 여러 체결로 열거나 닫을 수 있습니다. 패널은 이러한 체결을 포지션 식별자로 묶고, 청산 수량이 진입 수량과 일치할 때 하나의 거래로 기록합니다. 부분 청산은 같은 포지션의 일부로 남습니다.
각 성과에는 손익, 수수료, 각종 비용, 스왑이 포함됩니다. 입금, 출금, 크레딧, 정정, 보너스, 요금, 이자, 배당, 세금은 브로커가 계좌 기록에 표시하는 경우 계좌 대조에 포함됩니다. 각 포지션에는 랏 크기와 무관한 핍 단위 성과(평균 청산가 대비 평균 진입가)도 함께 표시됩니다.
전략은 보통 매직 넘버와 진입 체결의 정리된 코멘트로 식별됩니다. 이 방식은 하나의 매직 넘버로 여러 내부 전략을 운용하는 EA도 지원합니다. MQL5 시그널에서 복사한 거래는 시그널 이름을 딴 하나의 전략으로 묶입니다. 매직 넘버가 0인 수동 거래와 모바일 거래도 포함할 수 있습니다.
모든 포지션이 별개의 결정은 아닙니다. 하나의 신호로 네 개의 포지션을 연 EA는 한 번 결정한 것이고, 바스켓을 한꺼번에 청산한 그리드는 하나의 결과를 낸 것입니다. 따라서 같은 매직 넘버와 심볼로 짧은 시간 안에 진입한 포지션이나, 래더(한 방향으로, 진입가가 한 순서로 늘어선 형태)로 함께 청산된 포지션은 하나의 셋업으로 계산됩니다. 금액 지표는 항상 포지션 단위로 계산하고, 신뢰도 지표(통계적 신뢰도, 최소 표본, 등급, 점수, 몬테카를로 낙폭)는 셋업 단위를 사용하여, 하나의 결정으로 연 바스켓이 40개의 독립된 결과로 취급되지 않도록 합니다.
하단에서는 재구성한 실현 손익과 잔고 거래를 MetaTrader가 보고하는 잔고 및 크레딧과 비교하며, 차이가 있으면 표시합니다. 네팅 계좌의 반대 매매 체결은 거래 경계를 불확실하게 만들 수 있으므로, 해당 행은 “미확인”으로 표시되고 등급을 받지 않습니다.
보기, 기간, 정리
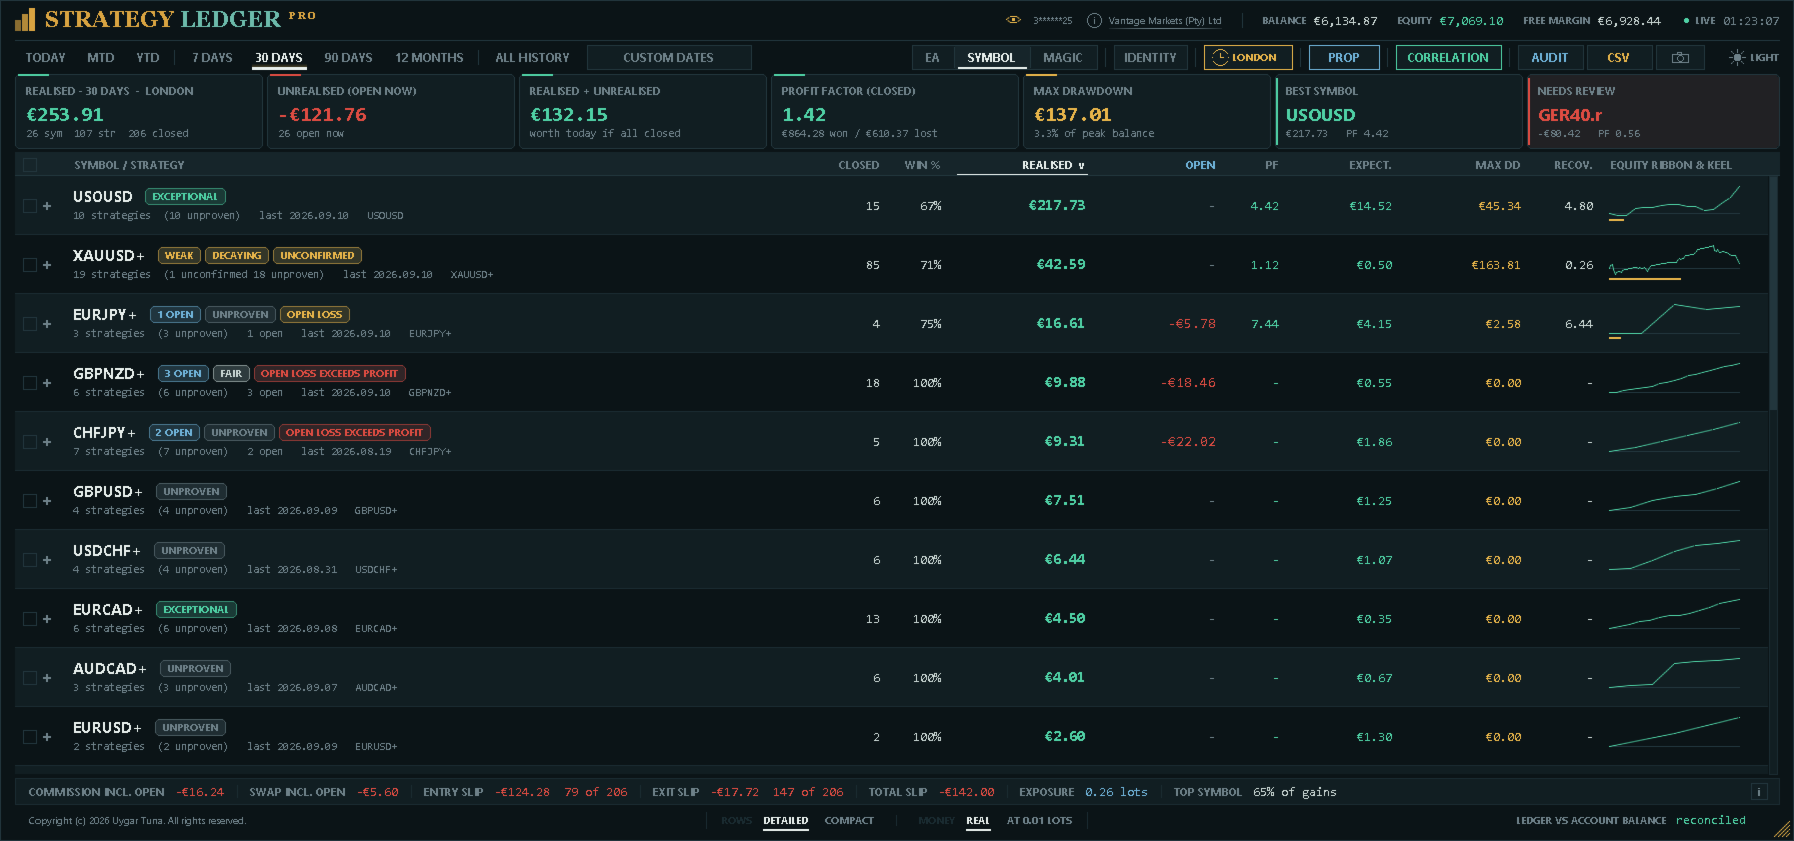
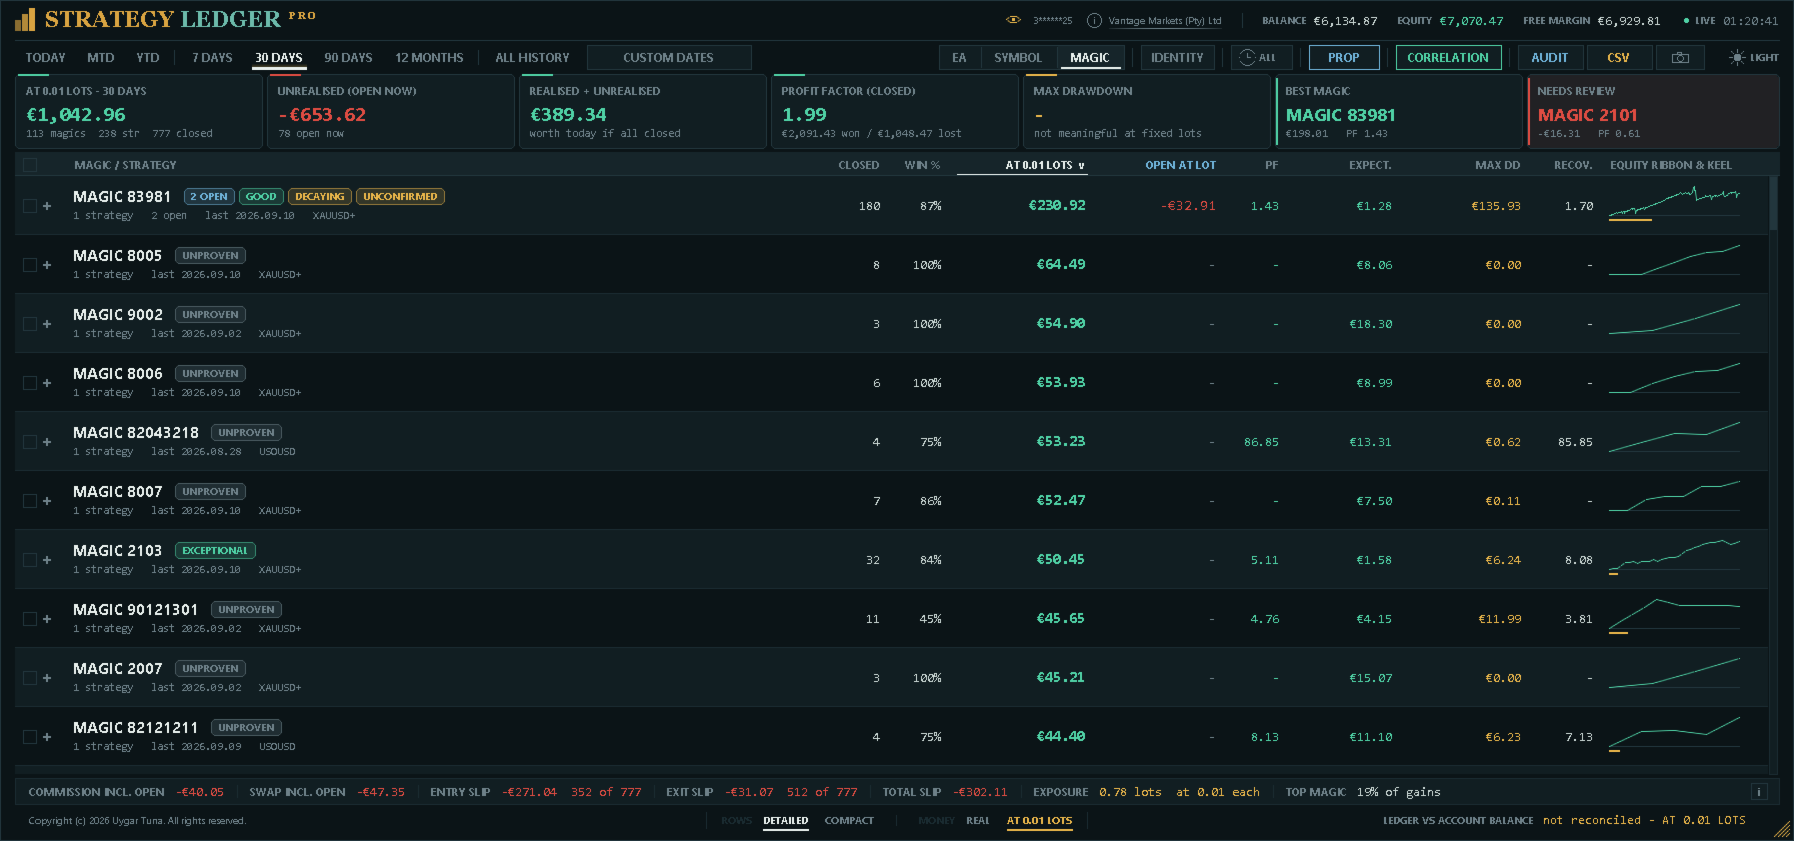
EA 보기는 전략을 배정된 EA 아래에 묶습니다. 심볼 보기는 같은 데이터를 종목별로 묶습니다. 매직 보기는 각 EA가 보낸 번호별로 묶고 그 아래에 코멘트를 전략으로 표시하며, EA의 코멘트가 예상과 다르게 동작할 때 확인하는 곳입니다. 여러 행을 동시에 펼쳐 둘 수 있습니다.
사용할 수 있는 기간은 오늘, 이번 달, 올해, 7일, 30일, 90일, 12개월, 전체 기간, 사용자 지정 날짜 범위입니다. 포지션은 청산 시각 또는 진입 시각 기준으로 기간에 배정할 수 있습니다.
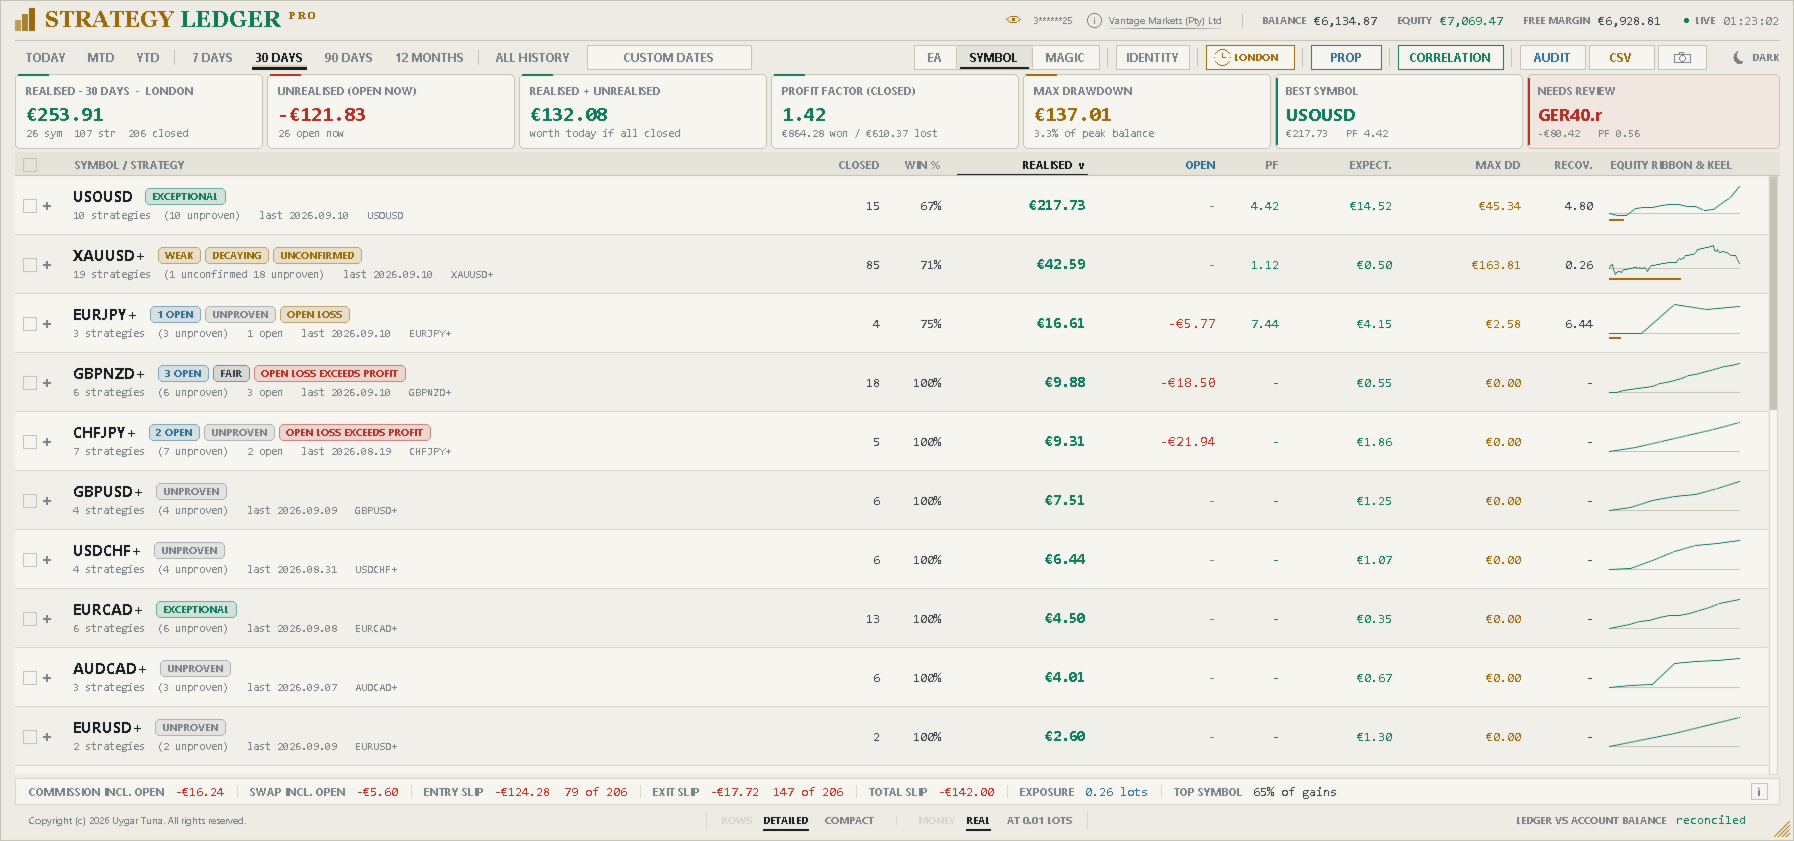
헤더의 시계로 어떤 보기와 기간에서든 패널 전체를 하나의 거래 세션(아시아, 런던, 뉴욕)으로 좁힐 수 있습니다. 포지션은 진입한 세션에 속합니다. 세션 시작 시각은 서버 시간 기준 설정값이며, 기간 표시에는 어디서든 적용 중인 세션이 나타납니다.
이름은 체결 코멘트에서 학습하거나 직접 지정할 수 있습니다. 전략은 이름 변경, 선택 항목으로 그룹 만들기, 다른 EA로 끌어 옮기기, 병합, 분리가 가능합니다. 체크한 선택 항목에 속한 행을 끌면 선택 전체가 이동합니다. 동일한 코멘트는 매직 넘버를 넘어 병합할 수 있으며, 따로 두어야 하는 코멘트를 위한 예외 목록도 있습니다.
행은 하나씩 또는 선택 단위로 숨겼다가 나중에 복원할 수 있습니다. 각 EA 행의 오른쪽 끝에는 전용 열에 두 개의 컨트롤이 있습니다. 행을 숨기고 이후 복원용으로 호박색으로 바뀌는 눈 아이콘과, 해당 행의 공유 카드를 저장하는 카메라입니다. 둘 다 항상 흐리게 표시되며 마우스를 올리면 밝아집니다. 숨긴 행은 보기마다 따로 저장되며, 표시된 합계와 필터링된 잔고 곡선에서 제외됩니다. 모든 전략이 숨겨진 EA는 수치가 없으므로 아무것도 표시하지 않으며, 아직 집계되는 행들 아래에 배치되어 그 행들이 바뀌어도 위치가 움직이지 않습니다.
열은 이름, 성과, 수익 팩터, 청산 포지션 수, 낙폭, 기대값 기준으로 정렬할 수 있습니다.
식별 설정
식별 상자에는 계좌의 모든 매직 넘버가 해당 행, 전체 기간 성과, 스위치와 함께 표시됩니다. “코멘트별”이 기본 규칙으로, 전략은 매직 넘버와 그 코멘트의 조합입니다. “단일 전략”은 해당 매직 넘버의 모든 코멘트를 하나의 행으로 합치며, 코멘트에 진단 정보나 그리드 단계 번호를 적는 EA를 위한 설정입니다. 개별 코멘트는 다시 독립된 행으로 되돌릴 수 있습니다. MQL5 시그널은 시그널 규칙에 따라 이미 하나의 전략이므로 이 스위치가 제공되지 않습니다.
각 매직 넘버는 코멘트별로 펼쳐지고, 각 코멘트 아래에는 랏 크기가 작은 것부터 거래 수와 성과와 함께 표시됩니다. 랏 크기도 매직 넘버처럼 패널에서 제외할 수 있으며, 두 코멘트에 있는 같은 크기는 따로 제외할 수 있습니다. 제외한 항목은 모두 제거된 거래와 금액과 함께 상자 하단에 표시되므로, 개선된 성과가 그 대가 없이 표시되는 일은 없습니다. 매직 넘버와 랏 크기 필터는 일시적인 렌즈로, 저장되지 않으며 함께 해제됩니다. 식별 스위치와 개별 행 지정은 결정 사항으로, 레이아웃과 함께 기억됩니다.
고정 랏 모드
하단의 스위치는 모든 청산 거래와 보유 포지션을 하나의 랏 크기(설정값, 기본 0.01)로 진입한 것처럼 다시 계산합니다. 그리드의 래더는 평평해져, 우위가 진입에 있었는지 아니면 포지션 크기에만 있었는지가 드러납니다. 시그널은 복사할 때의 크기로 얼마를 벌었을지를 보여줍니다. 화면의 모든 금액이 가정이 되므로, 패널은 금액이 표시되는 모든 곳에서 이를 알립니다. 실현 손익 제목과 요약의 첫 칸에 랏 크기가 표시되고, 대조 줄은 “미대조”로 표시되며, 내보내기에는 재계산임을 나타내는 이름과 표시가 붙고, 감사는 실행되지 않으며, 등급 기록과 자산 추적은 일시 중지되고, 아무것도 저장되지 않습니다. 이 모드는 패널을 적용할 때마다 꺼진 상태로 시작합니다. 고정 랏은 크기를 맞출 뿐 위험을 맞추지는 않으며, 핍은 가격 움직임만 맞춥니다.
대시보드와 전략 상세
헤더에는 계좌, 브로커, 잔고, 자산, 여유 증거금, 서버 시간, 시세 상태가 표시됩니다. 시세 상태는 “실시간”, “일부 실시간”, “장 마감”, “무포지션”, “오프라인”으로 표시되어, 현재 갱신되지 않는 수치를 최신 수치로 오해하지 않도록 합니다. 계좌 번호 옆의 눈 아이콘으로 번호를 가릴 수 있어 공유용 스크린샷에 유용합니다.
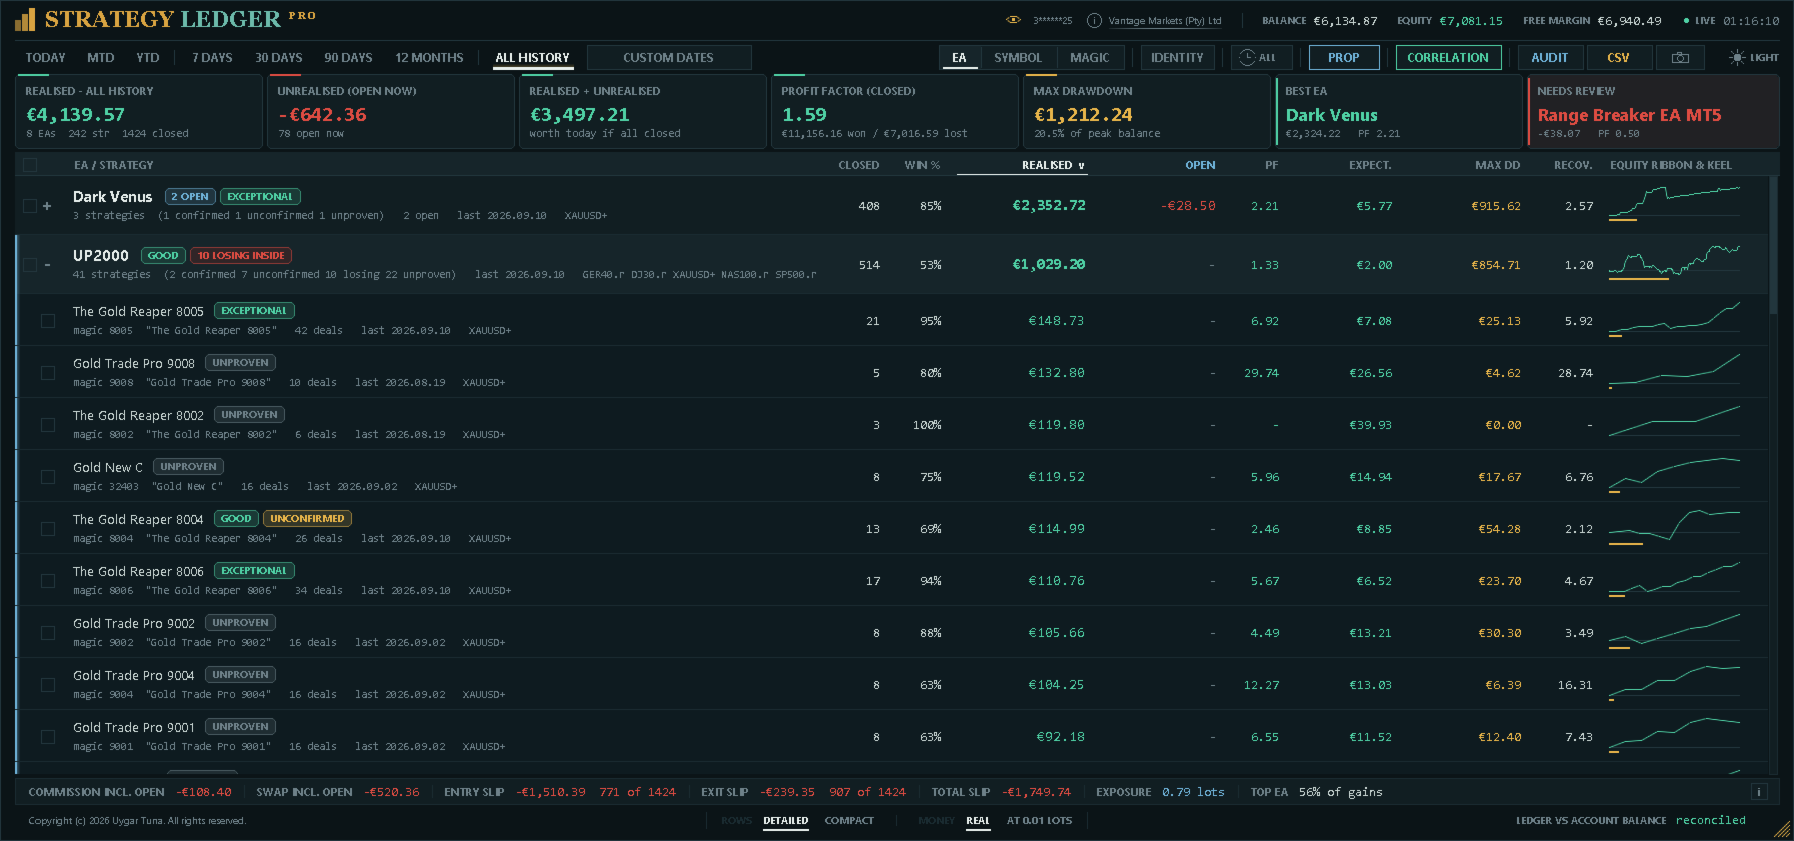
요약에는 실현 손익, 현재 미실현 손익, 그 합계, 청산 포지션의 수익 팩터, 잔고 최대 낙폭, 현재 가치 기준으로 가장 강한 행, 그리고 패널의 주의 규칙에 따라 검토 대상으로 선정된 행이 표시됩니다. 마지막 두 카드는 선정 이유를 보여주며, 각각의 표시를 누르면 근거가 된 규칙이 열립니다. 검토 대상 행은 주의 점수의 각 요소와 획득 점수 및 근거를, 가장 강한 행은 적용된 규칙과 그 대상 수치를 보여줍니다.
표에는 청산 포지션 수, 승률, 실현 손익, 미실현 손익, 수익 팩터, 기대값, 청산 포지션 최대 낙폭, 회복 지수, 낙폭 경로가 포함된 작은 자산 곡선이 표시됩니다. 숨긴 행이 있을 때 이 수치들은 표시 중인 선택 항목을 나타냅니다.
거래일 시작 이후 변화한 행에는 색상 테두리와 방향 표시, 변화 금액이 나타납니다. 손실 거래나 낙폭이 없어 분모가 없는 비율은 숫자 대신 대시로 표시됩니다.
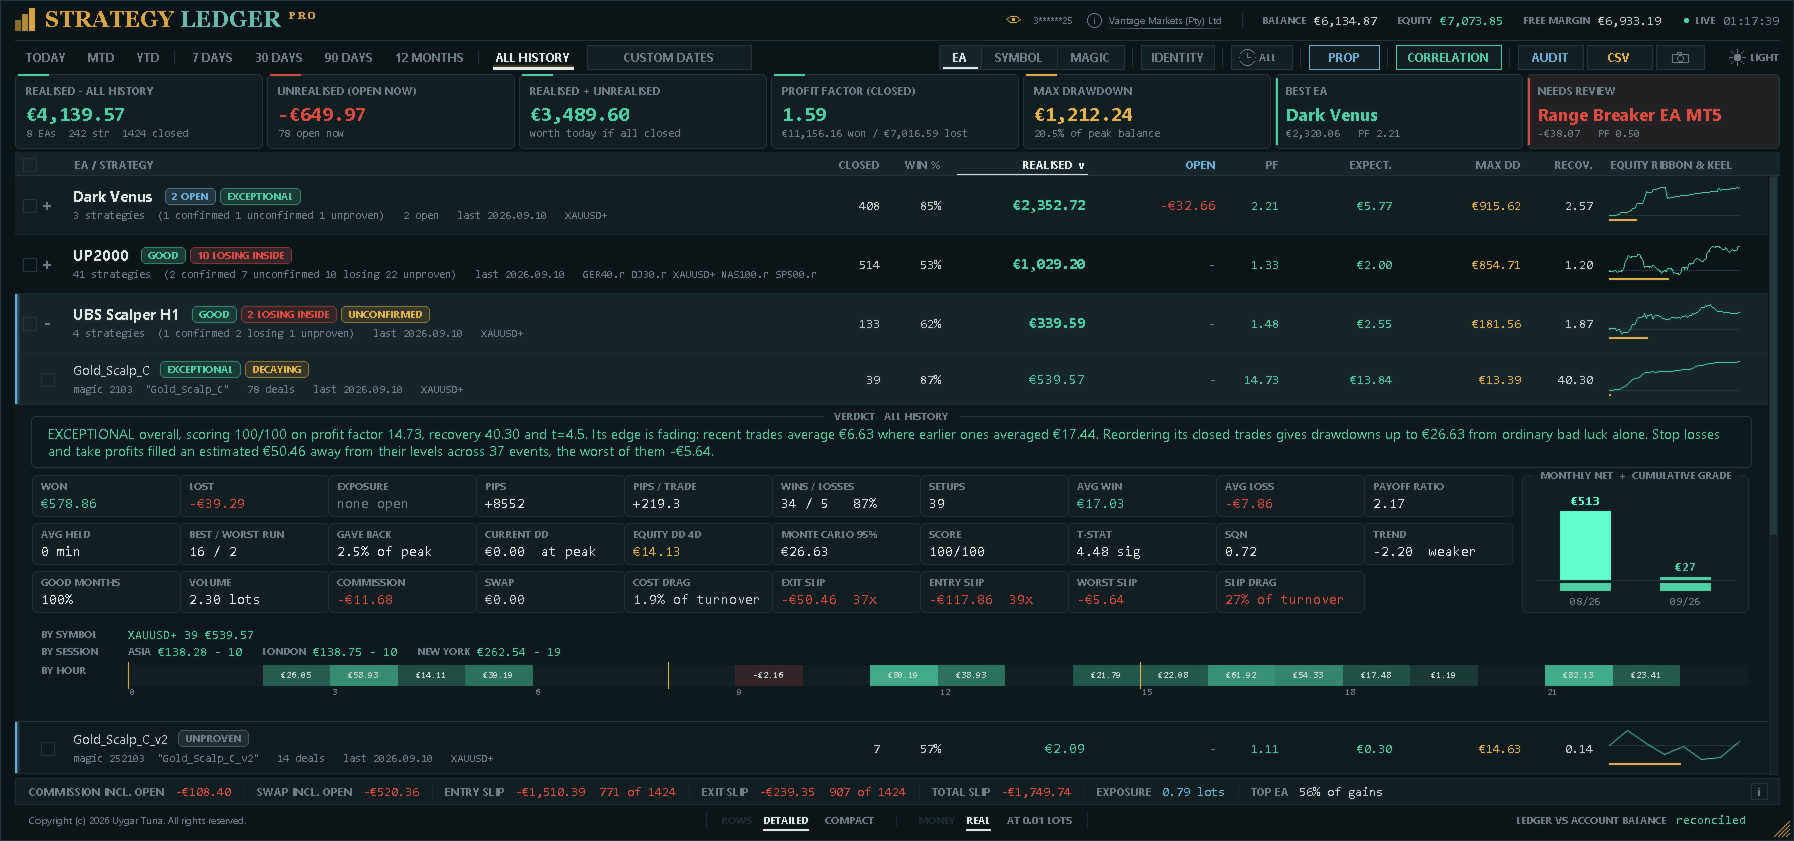
펼친 상세에는 총수익과 총손실, 보유 포지션, 핍과 거래당 핍, 수익·손실 거래 수, 셋업, 평균 보유 시간, 평균 수익과 평균 손실, 손익비, 최장 연승과 연패, 낙폭 비율, 현재 낙폭, 최장 회복 기간, 거래량, 수익 월 비율이 포함됩니다.
최장 회복 기간은 해당 행의 누적 청산 손익이 이전 고점 아래에 머물렀던 가장 긴 구간, 즉 한 고점에서 다음 고점까지의 기간입니다. 포지션 보유 시간이 아닙니다. 거래가 몇 분 만에 끝나는 EA도 몇 주 동안 고점 아래에 있을 수 있습니다. 아직 고점을 회복하지 못한 구간은 오늘까지 계산되며 “현재까지”로 표시됩니다.
상세에는 점수, 통계적 신뢰도, System Quality Number, 최근 성과 추세, 몬테카를로 낙폭 추정, 실시간 자산 낙폭, 수수료, 스왑, 비용 부담, 진입·청산 슬리피지, 최악의 측정 슬리피지, 슬리피지 부담도 표시됩니다. 월별 순익 차트, 심볼별 내역, 각 세션에서의 성과, 하루 각 시간의 손익에 따라 색칠된 24칸 띠도 포함됩니다.
등급과 위험 표시
점수는 통계적 신뢰도, 수익 팩터, 회복 지수를 결합합니다. 각 요소는 평균 전에 상한이 적용됩니다. 청산 포지션 통계에는 미실현 손실이 포함되지 않으므로, 미실현 손실이 점수를 제한할 수 있습니다.
기본 최소 표본은 20개 셋업이며, 이에 못 미치는 행은 “미검증”으로 표시됩니다. 나머지 등급은 점수와 설정한 손실 기준에 따라 “손실 중”부터 “탁월”까지입니다. 등급은 기록된 계좌 데이터를 설명하는 것이며, 거래 신호나 예측이 아닙니다.
상태 표시는 보유 포지션, 청산 거래 없음, 비활성, 손실 성과, 미실현 손실, 실현 수익보다 큰 미실현 손실, 최근 성과 약화, 통계적 확인 부족, 섞은 기록 추정치를 넘는 낙폭, 수익 EA 안의 손실 전략, 청산 포지션 낙폭을 크게 웃도는 실시간 자산 낙폭을 나타냅니다. 행을 펼치면 해당 표시와 그 행의 수치로 작성된 설명이 나타납니다.
세션과 시간대
세션 필터는 패널 전체에 적용되며, 각 전략의 상세에도 세 세션의 성과가 나란히 표시되어 아무것도 바꾸지 않고 비교할 수 있습니다. 그 아래 24칸(포지션이 진입한 서버 시간의 각 시간마다 한 칸)은 그 시간의 손익에 따라 색칠되고 금액이 표시되며, 둘이 일치하도록 세션 경계도 표시됩니다.
둘 다 기록된 성과를 설명하는 것입니다. 몇 건의 거래만으로 강해 보이는 세션이나 시간대는 가설일 뿐이며, 그렇게 읽히도록 거래 수가 수치 옆에 표시됩니다.
프롭 펌 한도
일일 손실, 최대 낙폭, 수익 목표는 계좌 통화나 비율로 입력할 수 있으며, 패널은 각 항목의 남은 여유를 막대로 보여주는데, 여유가 줄어들수록 호박색을 거쳐 빨간색으로 바뀝니다. 한도를 넘은 경우 음수의 잔여 금액이 아니라 “위반”으로 표시됩니다.
회사마다 낙폭을 측정하는 방식이 다르므로, 하나의 설정으로 두 한도를 모두 다룹니다. 초기 잔고 기준의 고정 방식, 도달한 최고 잔고 기준의 추적 방식, 관측된 최고 자산 기준의 추적 방식입니다. 일일 한도는 같은 규칙을 하루 안에서 적용하며 날짜와 함께 초기화됩니다. 기준은 당일 시작 잔고, 당일 시작 잔고와 자산 중 높은 값, 또는 당일 최고 자산입니다. 일일 행에는 그날의 현재까지 성과도 표시되며, 상자에는 카운트다운의 기준 수치가 나타납니다.
자산을 사용하므로 보유 포지션이 일일 수치에 영향을 줍니다. 날짜가 바뀌는 순간의 자산은 기록으로 재구성할 수 없으므로 패널이 실행 중일 때 기록합니다. 기록되지 않은 경우 상자에 그 사실이 표시되며, 체결 기록으로 정확히 재구성되는 당일 시작 잔고를 대신 사용합니다.
체결 보고서
헤더의 브로커 이름을 누르면 사용자의 주문이 어떻게 체결되었는지에 대한 보고서가 열립니다. 다이얼은 거래 업체가 통제하는 네 가지 요소를 각각 25점으로 평가합니다. 계좌 전체 거래 대금 대비 슬리피지 비용, 유리한 체결과 불리한 체결이 같은 빈도로 일어나는지, 브로커가 주문을 받고 체결하기까지 걸린 시간, 주문이 나누어 체결된 빈도입니다. 각 요소는 자체 막대와 그 원인을 설명하는 문장과 함께 표시됩니다.
다이얼 아래에는 같은 수치가 심볼별로, 랏당 수수료와 랏-일당 스왑과 함께 표시됩니다. 청산 슬리피지는 서버가 직접 설정한 손절·익절 수준을 기준으로 측정되므로 목표 가격을 알 수 있습니다. 진입 슬리피지는 대기 주문에서 측정되며, 시장가 주문은 요청 가격이 없어 측정할 수 없습니다. 체결 속도는 주문 자체의 타임스탬프에서 가져옵니다.
이는 이 계좌에서의 체결을 설명하는 것이지 회사에 대한 평가가 아니며, 보고서에도 그렇게 명시되어 있습니다. 슬리피지는 대부분 전략의 특성이며(역지정가로 진입하는 돌파 전략은 어디서든 슬리피지를 부담합니다), 수수료와 스왑은 사용자가 선택한 계좌 유형에 따라 달라집니다.
낙폭, 비용, 슬리피지
청산 포지션 낙폭으로는 포지션을 보유하는 동안의 전체 움직임을 알 수 없습니다. Strategy Ledger Pro는 1초마다 실시간 자산을 기록하여, 계좌, 각 EA, 각 전략에 대해 이전 고점 대비 관측된 최대 하락을 저장할 수 있습니다. 추적은 이 기능을 처음 켠 시점부터 시작되며 시작일이 표시됩니다. 기록은 행의 수명을 따르며, 기간 탭, 숨김 상태, 고정 랏 모드에 영향받지 않습니다. 보기를 바꿔도 낙폭이 기록되지 않습니다.
실시간 추적이 꺼져 있으면, 상세에 청산 성과를 섞어 얻은 95번째 백분위 낙폭 추정치를 표시할 수 있습니다. 개별 포지션이 아닌 셋업 단위로 섞으므로, 한 덩어리로만 일어날 수 있었던 바스켓은 한 덩어리로 모델링됩니다. 이 추정치와 모든 등급은 과거 데이터만을 설명합니다.
수수료와 스왑은 따로 표시되며, 각각 보유 포지션에 이미 부과된 금액을 포함합니다. 필요한 데이터가 있으면 비용 부담은 총 거래 대금 대비 비율로 표시됩니다.
청산 슬리피지는 청산 주문에 요청 가격이 있을 때(손절, 익절, 대기 주문 청산 포함) 추정됩니다. 진입 슬리피지는 요청 진입가가 있는 대기 주문에 대해 추정됩니다. 시장가 주문에는 비교할 요청 가격이 없으므로 패널은 이용 불가 또는 일부만 측정됨으로 표시합니다. 두 수치 모두 청산된 포지션 중 몇 건을 측정했는지 표시하여, 일부 표본이 전체로 읽히지 않도록 합니다. 합계도 표시되지만, 두 요소가 같은 포지션의 서로 다른 부분 집합을 다루므로 건수는 붙지 않습니다. 값은 심볼의 현재 틱 가치로 계좌 통화로 환산됩니다.
상관관계
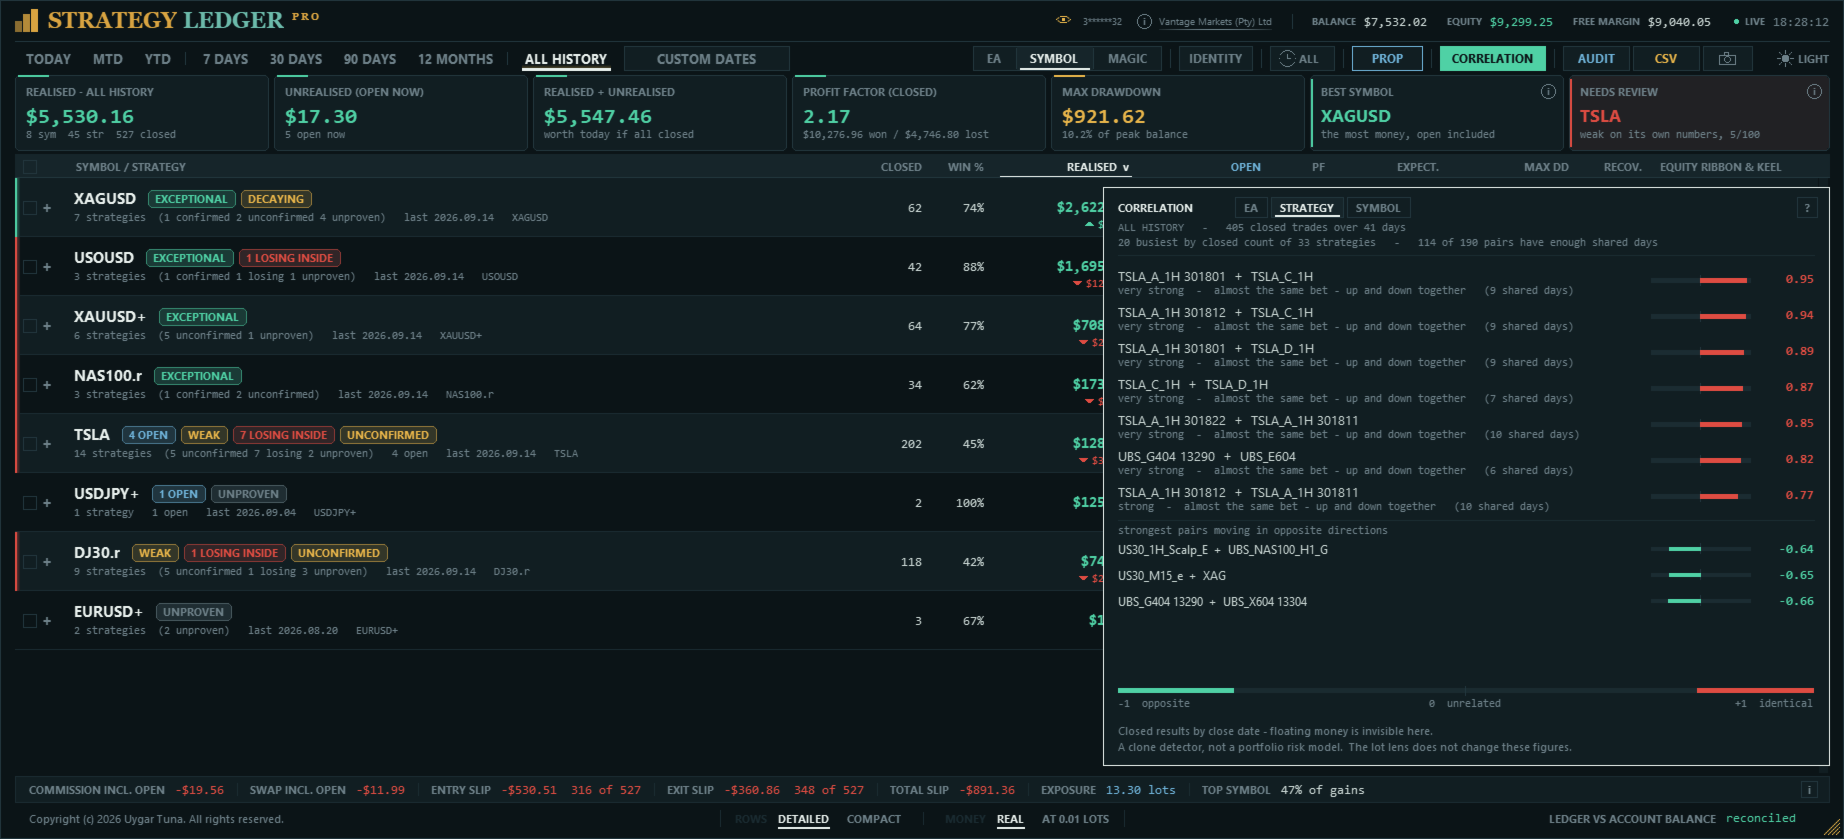
각 행은 따로 측정되므로, 여러 EA가 각각은 견실해 보여도 같은 시장 상황에 반응하고 있을 수 있습니다. 상관관계 목록은 행을 따로 채점하는 대신 서로 비교하여, 어떤 행들이 같은 날 같은 방향으로 움직이는지 보여줍니다.
각 행의 청산 성과는 일별로 합산됩니다. 그런 다음 두 행을 둘 다 거래한 날들에 대해 비교하며, 한쪽만 거래한 날은 비교 근거가 없으므로 제외됩니다. 표시되는 수치는 피어슨 상관계수로, +1(동일한 움직임)에서 0(무관)을 거쳐 -1(반대 움직임)까지의 값을 가집니다.
목록은 EA, 매직 넘버, 개별 전략, 심볼에 대해 만들 수 있습니다. 청산 포지션이 가장 많은 20개 행만 비교하며, 두 행이 공유한 거래일 수가 설정한 최소 표본 이상일 때만 해당 쌍을 표시합니다. 반대로 움직이는 쌍은 계속 보이도록 따로 나열됩니다.
계산은 목록을 열 때 실행되고 이후 하루 최대 한 번, 그리고 대상 행이 바뀔 때마다 다시 실행됩니다. 목록 안의 설명 패널에는 방법, 사용 기간, 포함된 행과 거래 수, 계수의 일반적인 해석 구간이 표시됩니다.
등급 기록
행의 상세를 펼치면 월별 순익 차트 아래에 같은 달에 맞춘 월별 블록 띠가 표시됩니다. 각 블록은 그 행이 해당 월말에 받은 등급을 보여줍니다.
블록은 누적 방식입니다. 한 달만으로는 등급을 매길 만큼 청산 포지션이 충분한 경우가 드물기 때문에, 각 블록은 그달만이 아니라 그 월말까지 청산된 모든 포지션으로 계산됩니다. 따라서 현재 “탁월” 등급인 행도 기록 초반에는 미정인 달이 표시될 수 있으며, 이는 당시 결론을 내리기에 청산 포지션이 너무 적었음을 뜻합니다.
설치 이전의 달은 실시간 데이터와 같은 계산으로 계좌 기록에서 재구성되므로, 처음 사용할 때부터 띠가 채워져 있습니다. 패널 실행 중에 기록된 달은 재구성으로 대체되지 않습니다.
전략 테스터 보고서
패널은 전략 테스터에서 저장한 보고서를 읽습니다. 보고서를 HTML로 MQL5\Files\StrategyLedgerPro\Backtests에 저장하고, 헤더의 BACKTEST를 누른 뒤, 하나 이상의 보고서를 체크하여 불러옵니다. 각 보고서는 패널에서 보고서 이름을 딴 하나의 EA가 되며, 코멘트는 전략이 되고 심볼은 심볼 보기에서 나뉘어 표시됩니다. 실거래와 완전히 같은 방식입니다. 여러 보고서를 함께 불러올 수 있습니다.
보고서가 패널에 있는 동안 헤더에는 “시뮬레이션”과 함께 보고서 수, 전략과 심볼, 포함된 날짜, 매직 넘버의 출처가 표시되며, 패널 상단에 금색 선이 나타납니다. 하단에서는 재구성한 포지션을 보고서 자체의 잔고 열과 센트 단위까지 대조합니다. 백테스트의 경우 카드에는 보고서 잔고, 테스트 기간, 연환산 수익률, 이전 고점 아래 머문 최장 기간, 여러 보고서일 때는 회복 지수가 가장 좋은 보고서가 표시됩니다. 기간 탭은 보고서의 마지막 청산 시점부터 계산되므로, “12개월”은 테스트의 마지막 1년입니다.
실계좌와 백테스트는 절대 함께 표시되지 않습니다. 보고서로 전환하면 모든 화면에서 계좌가 대체되고, 다시 돌아오면 복원됩니다. 보고서에서 읽은 어떤 내용도 계좌의 이름, 그룹, 숨긴 행, 자산 기록, 프롭 표시에 기록되지 않으며, 보고서 자체의 이름과 숨긴 행은 별도의 파일에 저장됩니다. 체결, 지연 시간, 슬리피지, 당일 프롭 표시는 백테스트에서 측정할 수 없으며, 이를 보여줄 상자에는 그 사실이 표시됩니다. 보고서에는 포지션 식별자가 없으므로, 청산은 수량으로, 그다음 테스터 자체의 손익 수치로 진입과 짝지어집니다. 추정으로 짝지어진 경우가 있으면 그 수가 헤더에 표시됩니다.
Market 데모가 실행되는 전략 테스터 안에서는 패널이 보고서 선택 화면을 보여주지만 보고서를 불러오지는 않습니다. 실계좌나 데모 계좌에서 사용하세요.
공유 카드
각 EA 행의 카메라로 공유 카드를 저장할 수 있습니다. 화면에 표시된 기간의 해당 EA 성과를 담은 1240 × 844 크기의 이미지 한 장으로, 바로 게시할 수 있습니다. 거래 비용(수수료와 스왑, 그리고 총수익 대비 비율)을 포함한 순손익, 최장 연승과 연패, 자산 곡선, 10가지 핵심 지표, 최근 12개월, 세션별·요일별·시간대별 성과, 그리고 판정이 표시됩니다.
카드에는 계좌 번호와 브로커 이름이 없으므로, 사용자를 식별할 수 있는 정보가 없습니다. 각 카드에는 해당 기간과 데이터 출처(실계좌, 전략 테스터 보고서, 고정 랏 재계산)가 명시되어, 시뮬레이션 결과가 실제 결과로 읽히는 일이 없습니다.
카드는 MQL5\Files\StrategyLedgerPro\Cards에 날짜별 폴더로 저장되며, 파일 이름에는 EA 이름, 기간, 시각이 들어갑니다. 기존 카드는 덮어쓰지 않습니다. 각 카드에는 기본적으로 Strategy Ledger 마크가 들어가며, 설정에서 끌 수 있습니다.
카드를 게시하기 전에 각 플랫폼의 규정을 확인하세요. MQL5.com에서는 이러한 제품 이미지를 사이트에 게시하는 것을 허용하지 않으므로, 카드는 개인 채널에서 공유하세요.
언어
패널 언어는 입력 매개변수의 첫 번째 설정에서 선택합니다: English, Français, Deutsch, Español, Italiano, Português, Русский, Türkçe, 中文, 日本語, 한국어. 패널에 레이블로 표시되는 모든 것이 이 설정을 따릅니다. 헤더, 기간 탭, 요약 카드, 열 제목, 상세 상자, 배지, 하단, 상관관계 및 식별 상자, 공유 카드입니다. 용어는 직역이 아니라 각 시장의 트레이더가 실제로 쓰는 말을 사용하며, 중국어, 일본어, 한국어는 Windows가 해당 언어용으로 제공하는 글꼴로 표시됩니다.
서면 판정, 각 행의 두 번째 줄, 이름 변경 안내는 아직 영어로 표시됩니다. 내보내기, 파일 이름, 로그는 스크립트와 지원 도구가 어떤 언어에서도 똑같이 읽을 수 있도록 항상 영어로 유지됩니다.
내보내기
지표 내보내기는 표시 중인 그룹과 전략을 성과, 통계, 핍, 셋업, 비용, 슬리피지, 등급, 서면 요약과 함께 기록합니다. 새로 고칠 때마다 자동으로 내보낼 수도 있습니다.
감사 내보내기는 재구성한 청산 포지션, 보유 포지션, 기간 및 숨김 상태, 그리고 포지션과 체결의 독립적인 대조 결과를 나열합니다. 누락된 기록이나 계산 차이를 조사하기 위한 것입니다.
스크린샷 버튼은 그 순간 열려 있는 패널 창을 포함하여 패널을 PNG 이미지로 저장합니다. 내보내기와 스크린샷은 계좌 번호 아래의 서로 다른 폴더에 저장되며, 공유 카드는 위에서 설명한 전용 폴더에 저장됩니다.
레이아웃과 저장되는 설정
패널은 다크 및 라이트 테마, 마우스 휠 스크롤, 너비와 표 높이 조정, 차트 자동 맞춤, 디스플레이 배율, 수동 글자 크기 조정, 선택형 실시간 시계를 지원합니다. 패널이 좁아지면 열이 단계적으로 사라집니다. 헤더에서는 컨트롤이 줄어드는 대신 정해진 순서대로 통째로 물러납니다. 카메라, CSV, AUDIT, CORRELATION, PROP, IDENTITY, 세션 시계, 기간 지정, 테마 전환 순이며, 기간 탭이 마지막까지 남고 그 위에 다른 것이 그려지는 일은 없습니다. 키보드 단축키는 커서가 패널 위에 있을 때 패널에 작동하고, 차트 위에서는 차트가 키를 사용합니다.
하단이나 키보드에서 간략한 행 높이를 선택하면 두 번째 줄과 자산 곡선이 빠지고 약 두 배의 행을 표시할 수 있습니다.
행 이름을 바꾸면 커서가 나타납니다. 화살표 키로 이동하고, Home과 End로 양 끝으로 가며, Delete로 앞쪽을 지우고, Ctrl과 삭제 키로 단어 전체를 지울 수 있어, 이름 앞부분만 고칠 때 나머지를 다시 입력할 필요가 없습니다.
하단에서 여는 패널 내 가이드는 각 표시를 표에서 보이는 모양 그대로 보여주고, 약어 열의 의미, 마우스 동작, 키보드 단축키를 설명합니다. 배지는 해당 행의 서면 요약에서 각각 설명되므로 가이드에서는 반복하지 않습니다.
이름, 그룹, 숨긴 행, 펼친 행, 정렬, 기간, 세션, 테마, 행 높이, 패널 크기, 식별 결정은 기억되도록 할 수 있습니다. 패널이 열릴 때의 보기는 설정으로 지정합니다. 상태와 실시간 자산 기록은 계좌와 서버별로 따로 저장됩니다. 예전 이름 및 레이아웃 파일은 있을 경우 복사됩니다. 예전 자산 기록은 전용 설정을 켠 경우에만 가져옵니다.
입력 매개변수는 그룹으로 나뉘어 알기 쉬운 말로 작성되어 있습니다. 언어, 이름과 그룹화, 시그널 감지, 수동 거래, 셋업 시간 창, 기간 기준, 시작 기간, 세션 시각, 프롭 펌 한도, 정렬, 테마, 패널 위치와 크기, 차트 맞춤, 실시간 시계, 레이아웃 저장, 통계 요약, 최소 표본, 몬테카를로 실행 횟수, 실시간 자산 추적, 상태 기준값, 고정 랏 크기, 공유 카드 마크, 자동 내보내기, 글자 크기, 진단 로그, 예전 자산 기록 가져오기를 제어합니다.
설정 방법과 제한 사항
- MetaTrader의 기록 탭에서 전체 기록을 선택합니다.
- Strategy Ledger Pro를 별도의 차트에 적용합니다. 심볼과 시간 프레임은 상관없습니다.
- 첫 번째 입력 매개변수에서 한국어를 선택합니다.
- 첫 스캔 후 대조 줄을 확인합니다.
패널은 계좌의 거래를 읽으므로 실계좌나 데모 계좌에서 작동합니다. 전략 테스터에는 읽을 계좌 기록이 없으므로, 패널은 그 사실을 표시하고 더 이상 작업하지 않습니다. 그곳에서는 보고서 선택 화면을 보여주지만 보고서를 불러오지는 않습니다.
완전한 결과를 얻으려면 완전한 계좌 기록이 필요합니다. 누락된 브로커 기록, 특이한 체결 구조, 네팅 계좌의 반대 매매는 차이나 미확인 행을 만들 수 있습니다.
슬리피지 값은 추정치입니다. 환산에는 체결 시점이 아닌 심볼의 현재 틱 가치를 사용합니다. 주문에 요청 가격이 지정되지 않은 경우 슬리피지를 측정할 수 없습니다.
실시간 자산 낙폭, 당일 최고점, 관측된 최고 자산은 패널이 실행되는 동안 기록되며, 실행되지 않은 기간에 대해서는 재구성할 수 없습니다. 체결 기록으로 재구성하는 수치(잔고, 청산 성과, 잔고 낙폭)는 정확합니다.
EA가 거래마다 다른 코멘트를 쓰면 코멘트마다 별도의 전략 행이 생깁니다. 흔한 번호와 주문 참조는 자동으로 제거되며, 식별 상자에서 해당 매직 넘버를 하나의 전략으로 지정할 수 있고, 남은 행은 수동으로 그룹화할 수 있습니다.
같은 계좌에 이전에 설치하며 저장한 이름, 그룹, 숨긴 행, 자산 기록은 유지됩니다. 같은 계좌에서 패널 두 개를 동시에 실행하는 것은 권장하지 않습니다. 서로 저장된 레이아웃을 덮어쓰기 때문입니다.
질문, 제안, 문제 보고는 제품 댓글, MQL5 개인 메시지 또는 AureusAI Trading Suite 채널로 보내 주세요. 대부분의 업데이트는 누군가의 댓글에서 시작됩니다. 계산 차이를 보고할 때는 감사 내보내기 파일을 첨부해 주세요.

















































I’ve been using Strategy Ledger Pro and it’s a really useful tool if you run multiple EAs or strategies on the same MT5 account. It makes it much easier to see what is actually performing well and what isn’t, rather than just looking at the overall account result. I particularly like being able to break things down by strategy, EA and symbol, and the extra stats give a much clearer picture of drawdown and expectancy. It’s also read-only, which I like, because it doesn’t interfere with any trades. Very practical tool and definitely useful for anyone running a portfolio of automated strategies.