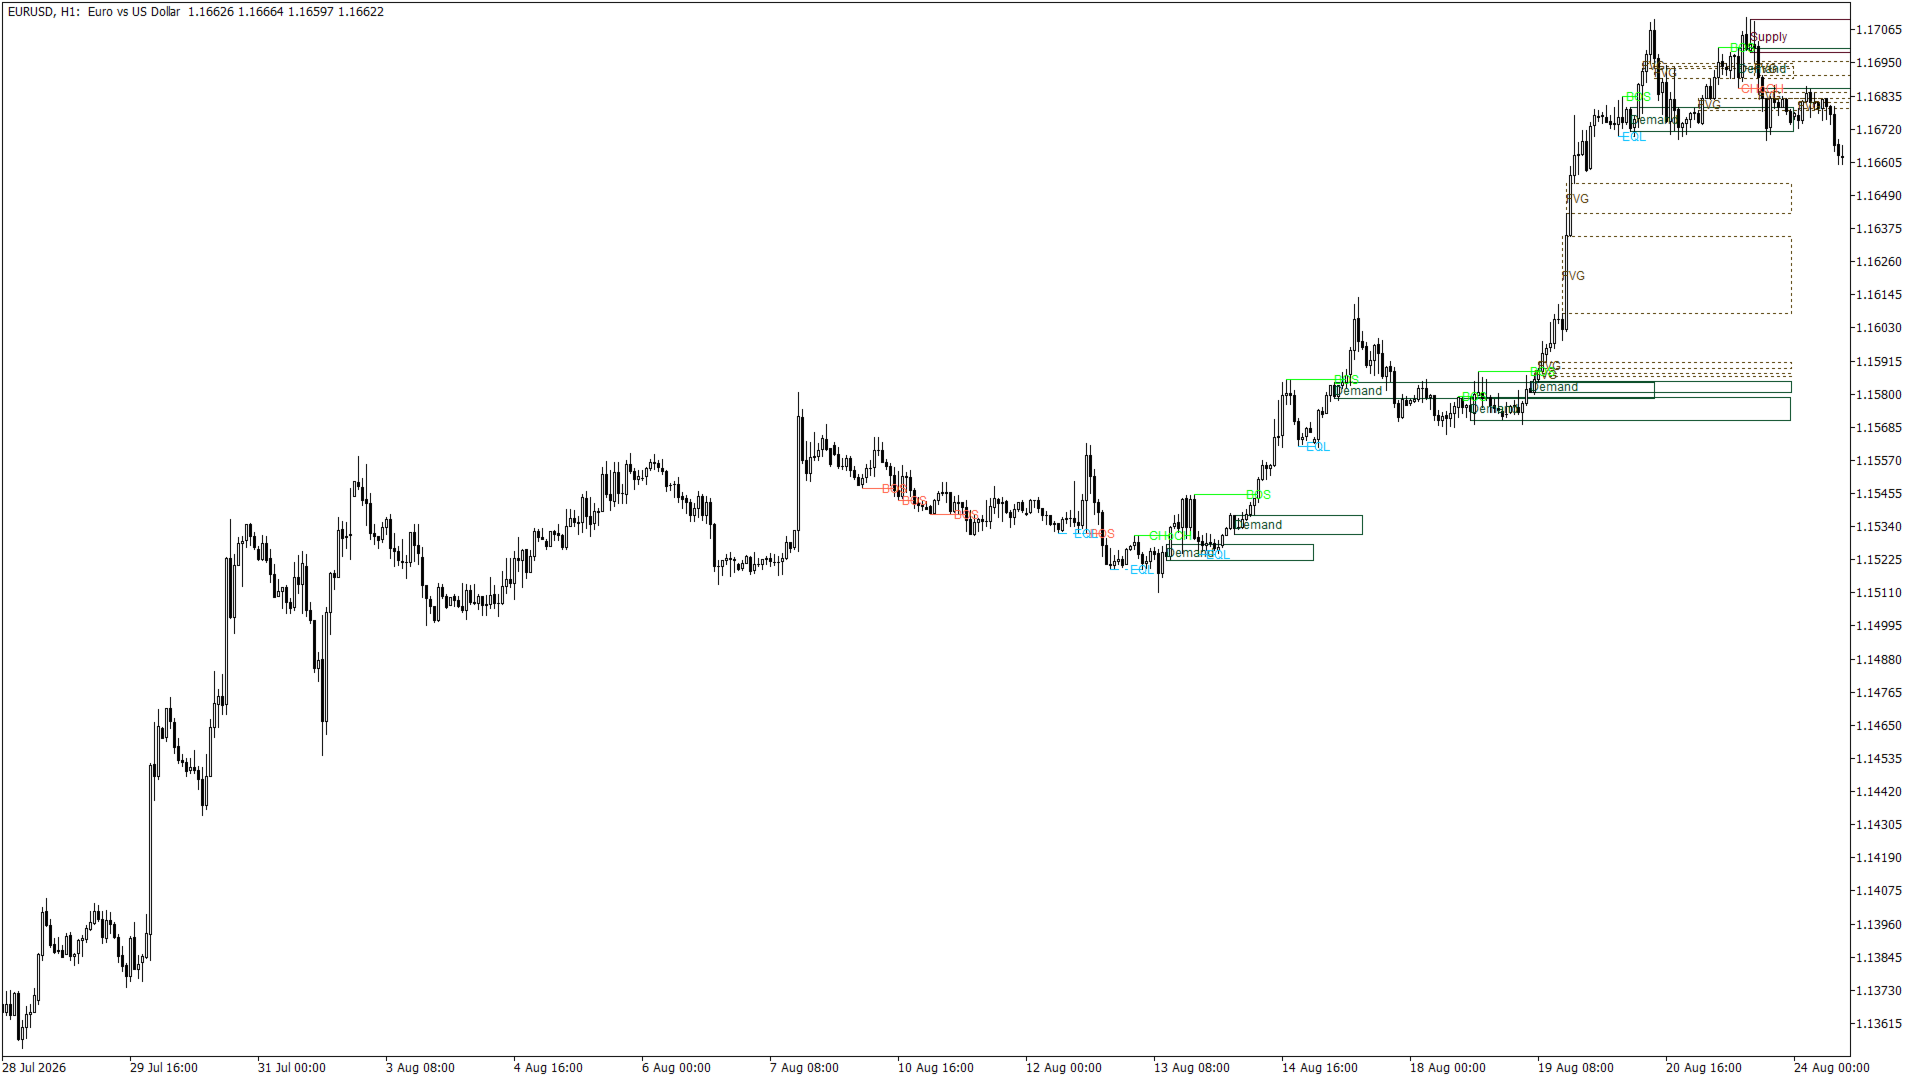
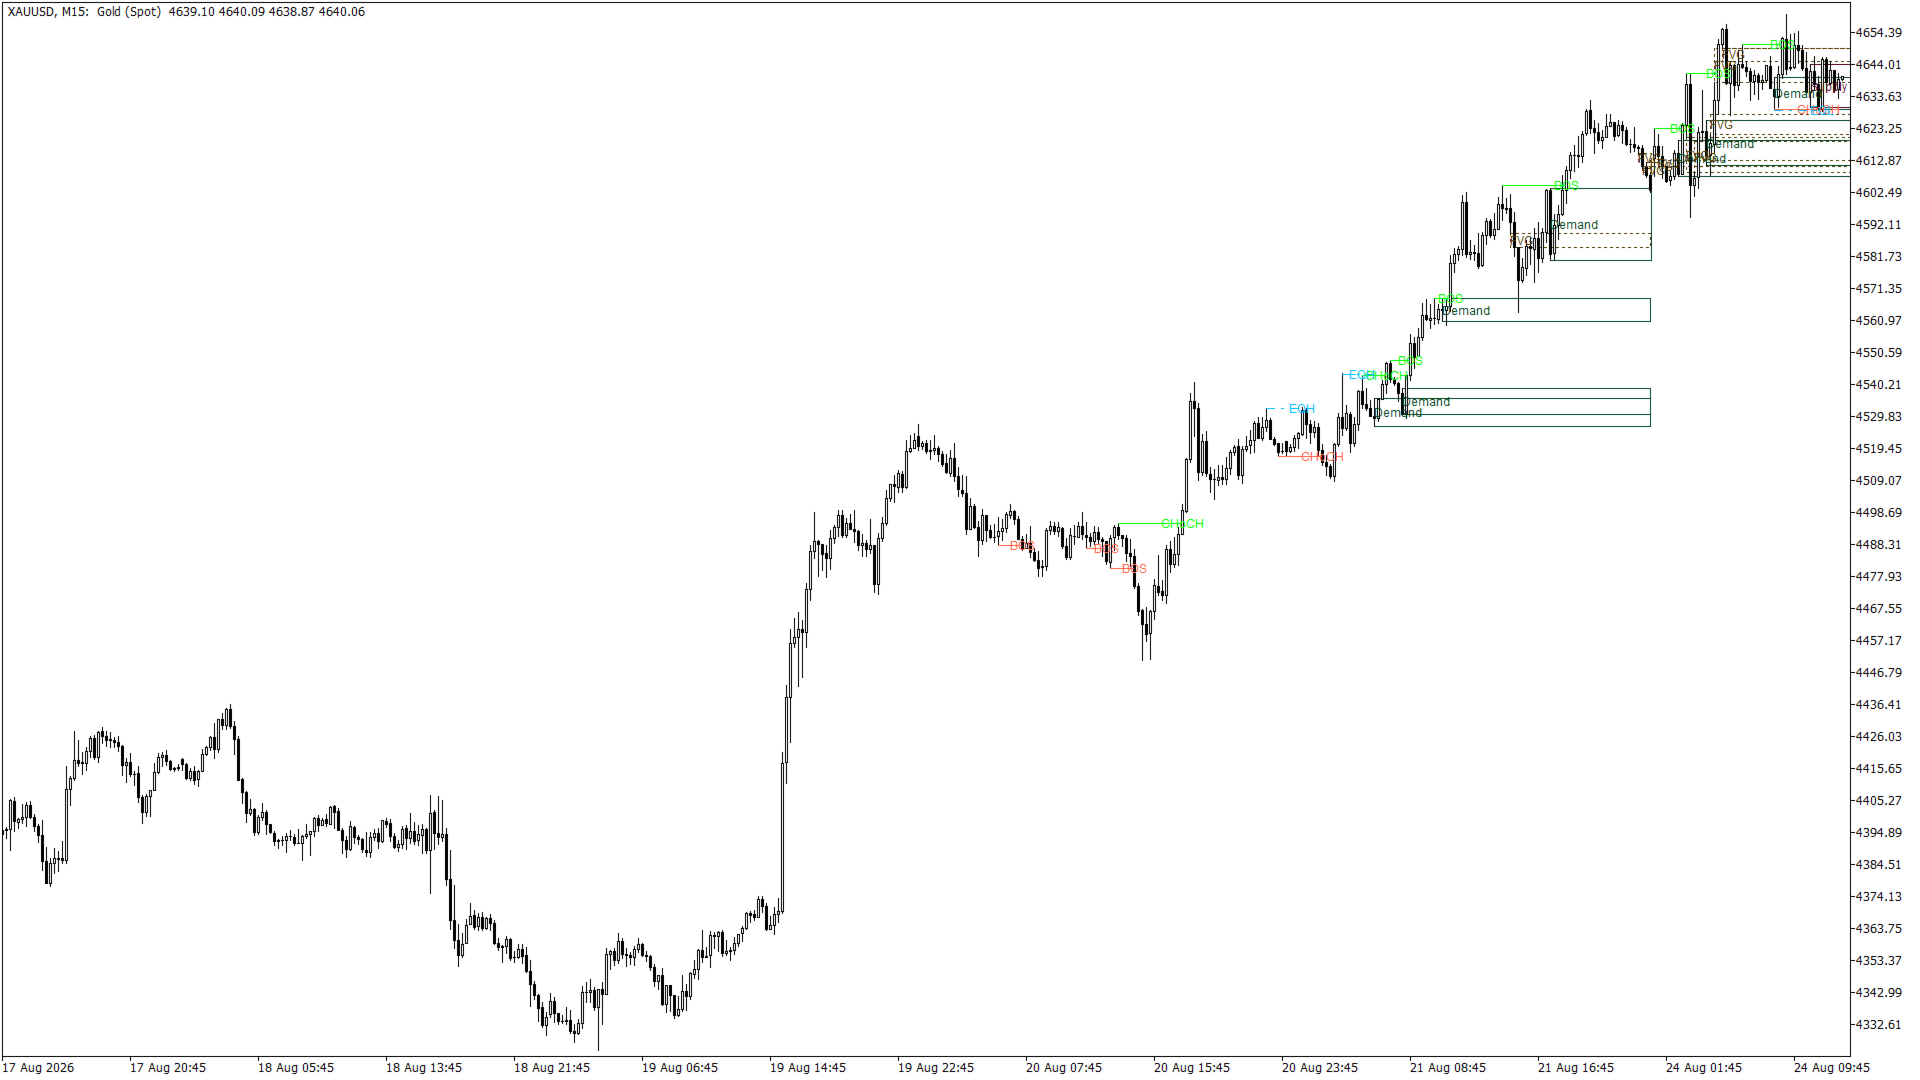
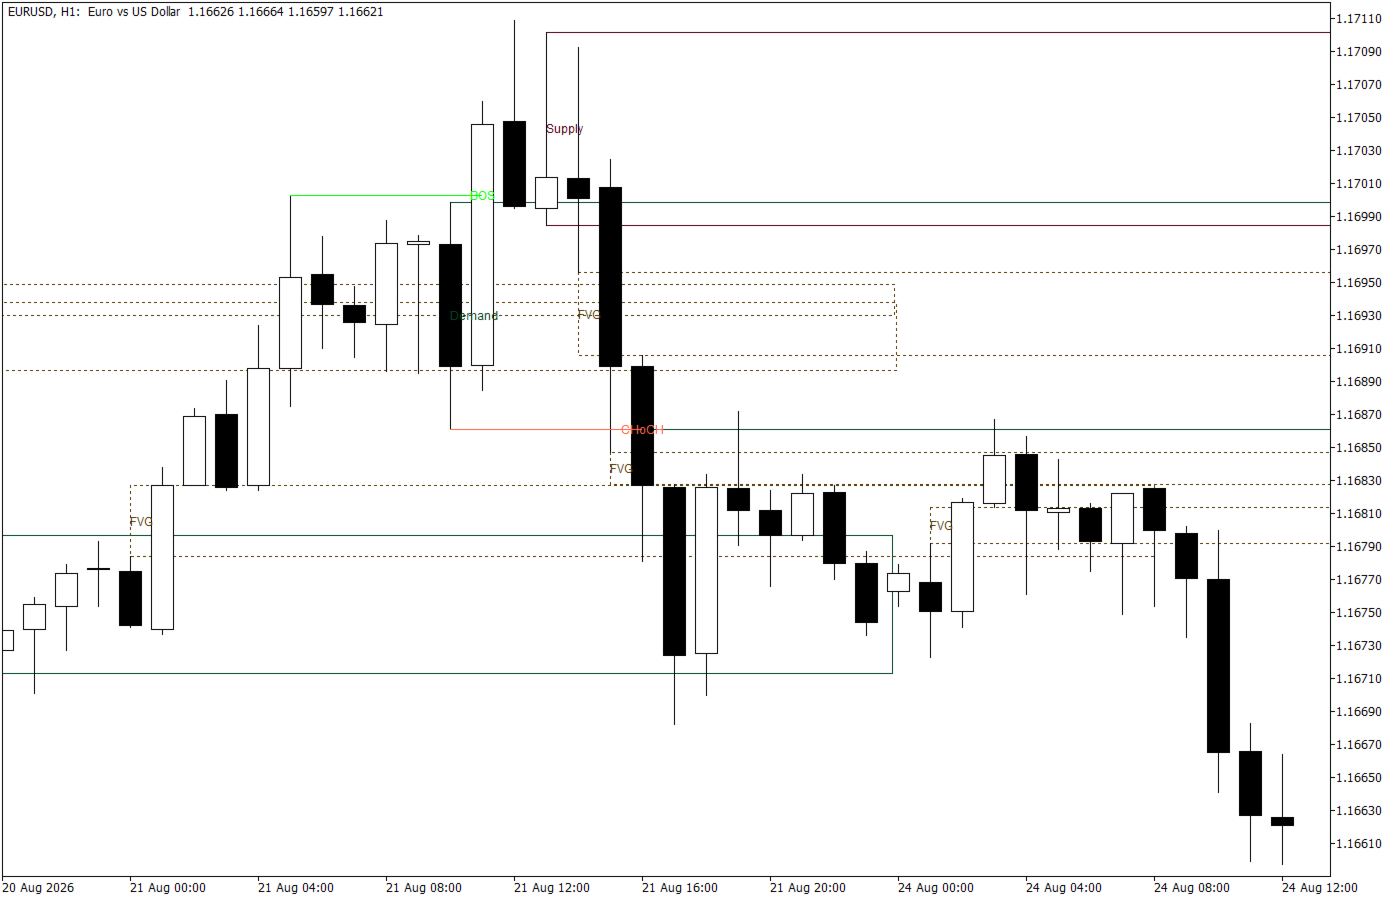
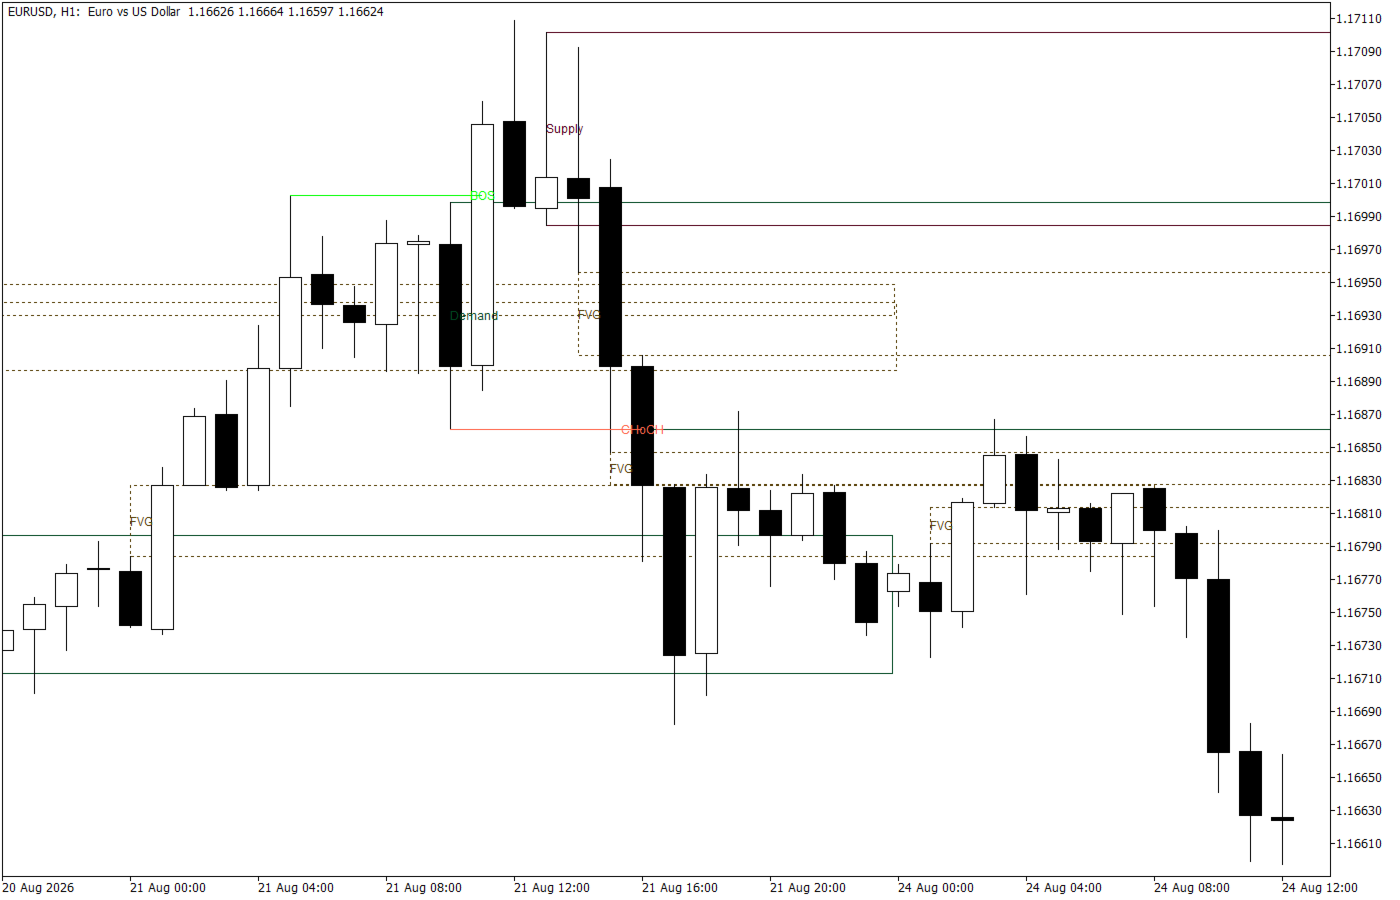
Deep Water Structure Map
- Indicators
-
Yogeswaran Suppiah
 Independent MetaTrader developer based in Malaysia, publishing chart analysis tools for discretionary traders. On MQL5 since 2015.
 - Version: 1.12
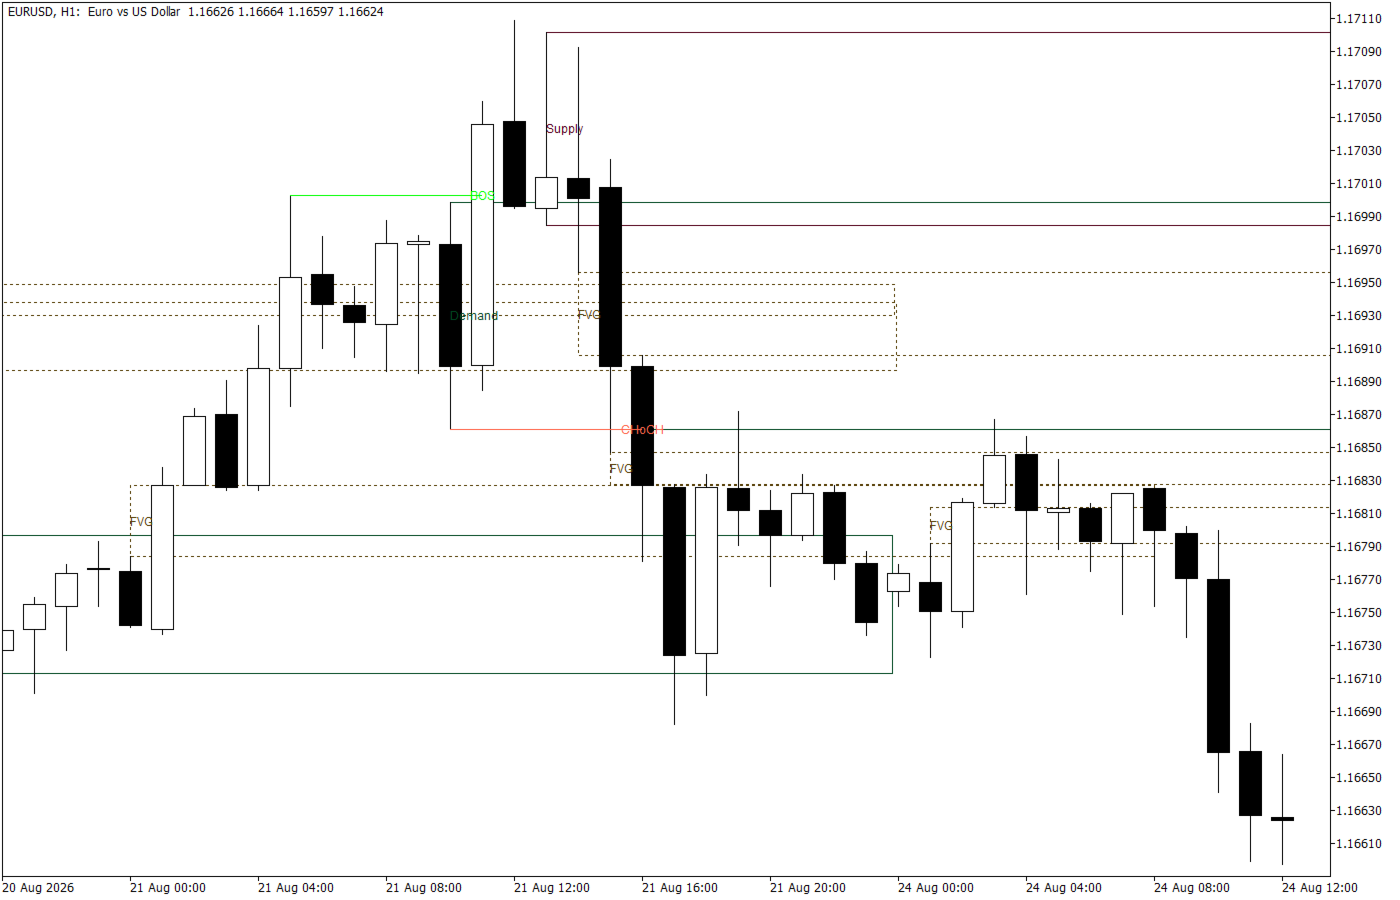
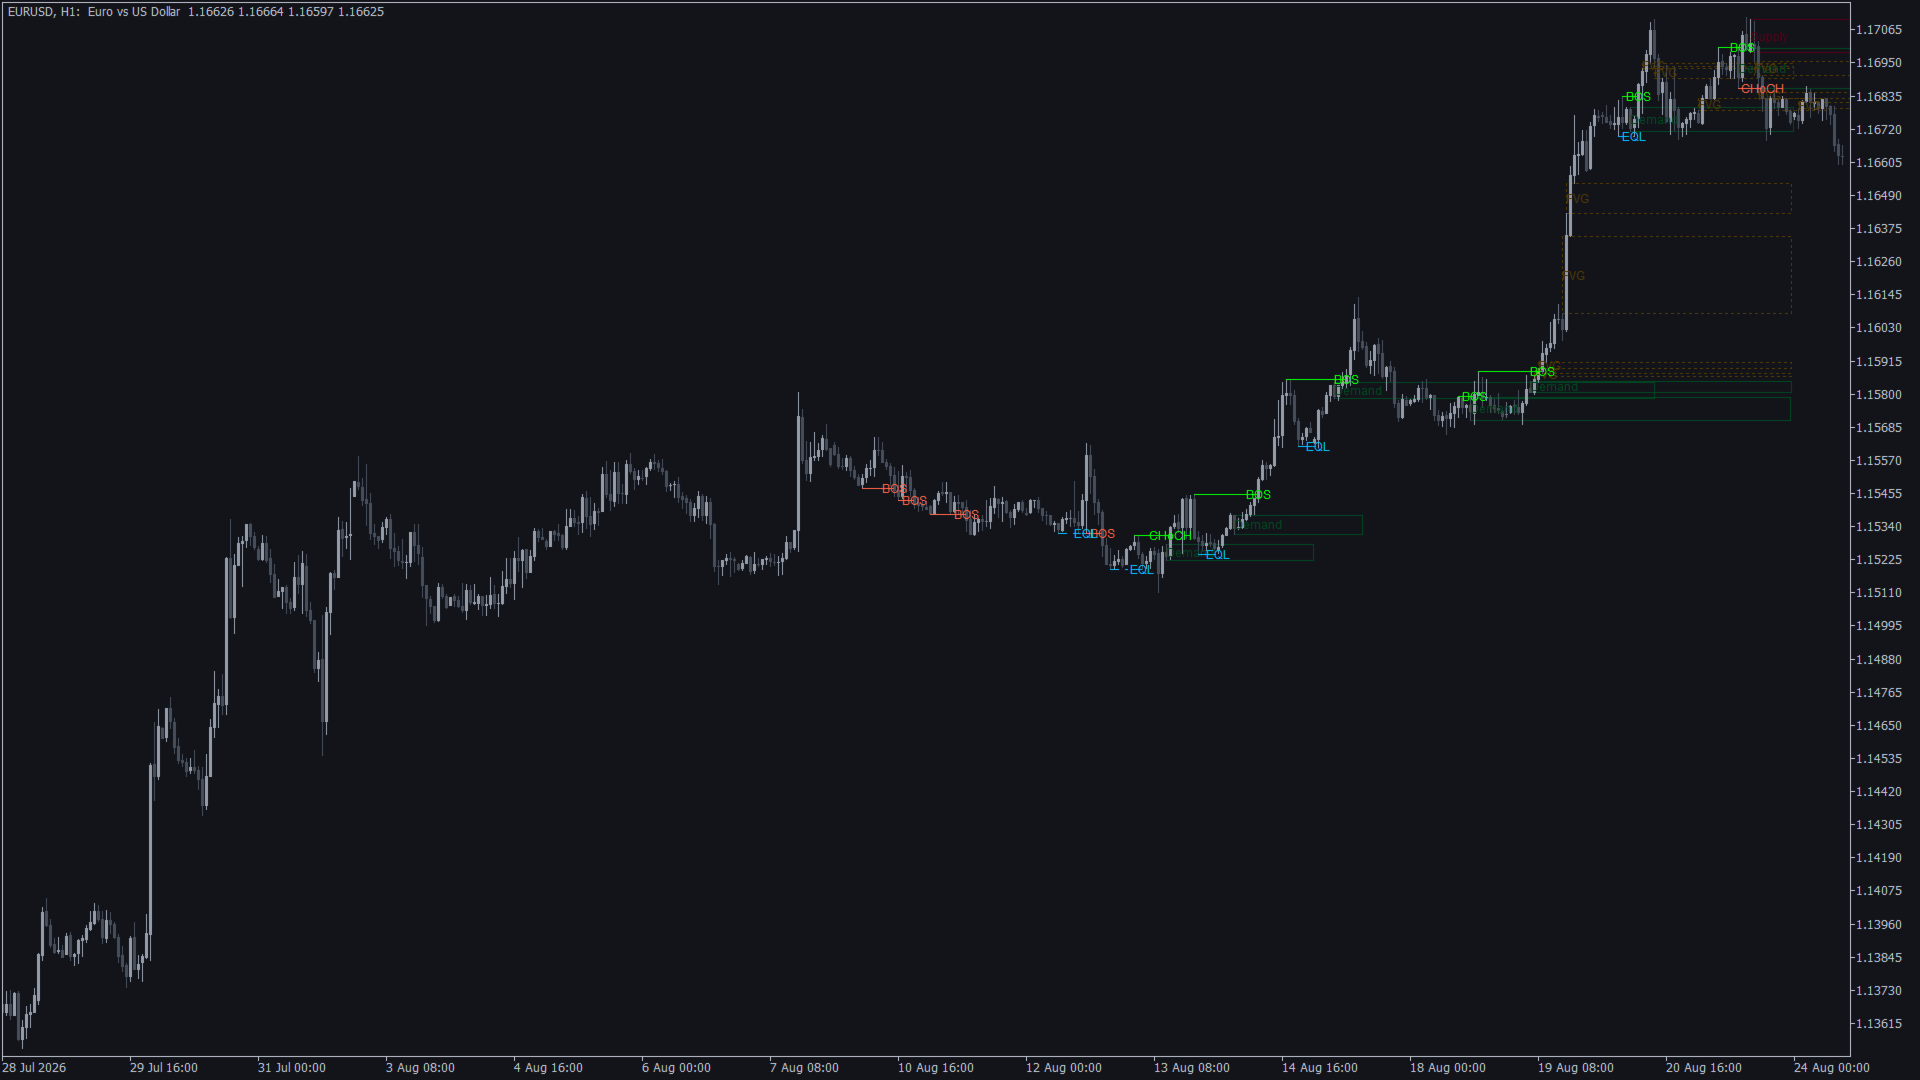
Free, with no functional restrictions. It marks market structure on closed bars: breaks of structure and changes of character, supply and demand zones, fair value gaps, equal highs and lows, and the swing pivots the rest is built from.
By default it draws on the close of a bar rather than on every tick, and it caps how many of each mark it keeps. Marks are computed from closed bars only, so nothing drifts or re-positions while the current bar is still forming, and the chart does not slow down as the session goes on.
What it marks
- BOS, a break of structure, where a swing high or low is taken and the trend continues
- CHoCH, a change of character, where that break happens against the prevailing direction
- Supply and demand zones, taken from the last opposite candle before the move that broke structure
- Fair value gaps, where price moved so fast it left an unfilled range behind
- Equal highs and equal lows, the resting places where stop orders collect
- Swing marks, optional, if you want to see the pivots the rest is built from
Getting started
Attach it to any chart and it runs without configuration. Inputs are grouped as Scan range, What to draw, Limits, Thresholds, Style and Colours. Every element can be switched off on its own, so you can run the whole map or just the one layer you actually trade. Zone fill is off by default, which keeps the boxes as outlines. The default colours are set for a dark chart. On a light background, change the colour inputs to suit.
How far back it marks
It processes the most recent 250 bars by default. Scroll back beyond that window and older bars are unmarked. The map is rebuilt on each closed bar from that window, so the oldest marks drop off as the window slides forward and as the limits fill. That is the design, not a fault. Raise Max bars to scan if you want more history marked, and raise the limits with it.
Why a whale
Price does not move because a chart pattern completed. It moves because someone large had to fill an order, and no one large can fill it in one go. Banks, funds and market makers are the whales here, and retail is the shoal swimming the other way.
A whale cannot hide. Working a big order over time leaves a trace in the structure of the chart: a level that breaks and does not come back, a gap that price walks away from, a band where price was repeatedly turned. Those traces are what this indicator draws. You are not being shown what the whale will do next. You are being shown where it has already been.
What it does not do
- It does not place orders, and it is not a signal service.
- It has no alerts. It is a map, not a notifier.
- It reads price only. It does not read volume, so it cannot tell you whether a break was absorbed or defended.
Questions
Ask in the Comments tab. I read it and I answer there, so the answer stays with the product for the next person who has the same question.
Found something wrong?
Tell me in the Comments tab. Send the symbol, the timeframe and a screenshot of what looks wrong, and I will reproduce it. Confirmed defects are fixed and shipped as a version update, and the version history on this page is the record of that. A report from a real chart at a broker I do not have is worth more to me than any test I can run myself.
WHAT THESE MARKS ARE CALLED ELSEWHERE
The marks this indicator draws are the ones Smart Money Concepts (SMC) and ICT material calls breaks of structure (BOS), changes of character (CHoCH), order blocks, supply and demand zones, fair value gaps (FVG, also called imbalances) and equal highs and lows. Same objects, different vocabulary - the sections above define each mark without assuming you use either. The liquidity layer that sits on top of them - sweeps, stop hunts and traps - is a separate product, Deep Water SMC Liquidity and Trap Map.
Want the rest of the map?
This one draws market structure. The liquidity side - sweeps, traps, spoofed levels, whale flow, and the confluence signals built on them - is a separate product, Deep Water SMC Liquidity and Trap Map. Same engine, same rule that a mark on a closed bar never moves. It rents for a month if you would rather try it than commit.