Dynamic Global Exchange Sessions

Global Exchange Sessions

Global Exchange Sessions is an MQL5 indicator that marks the regular trading hours of the world’s main stock exchanges directly on your chart.

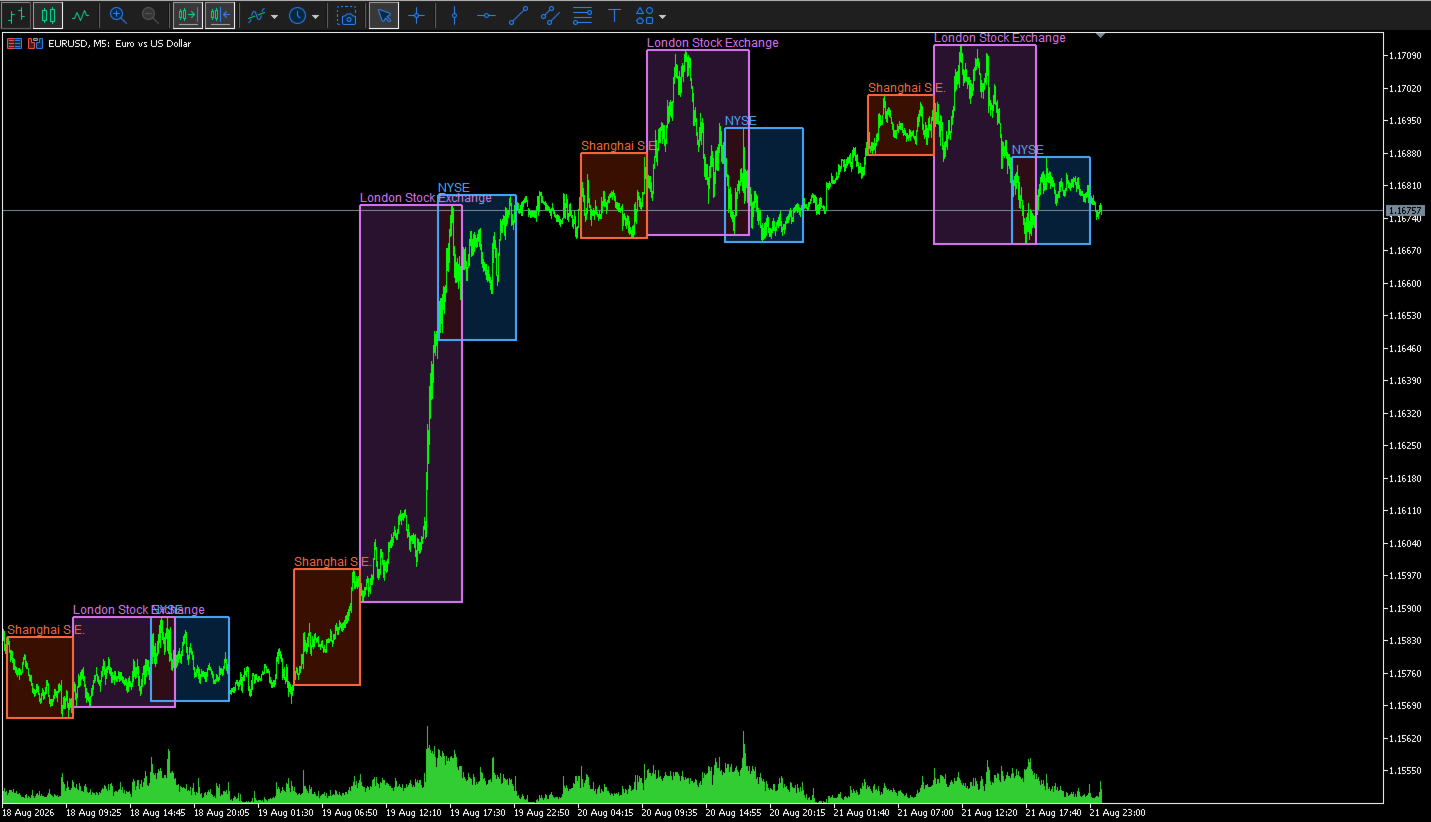
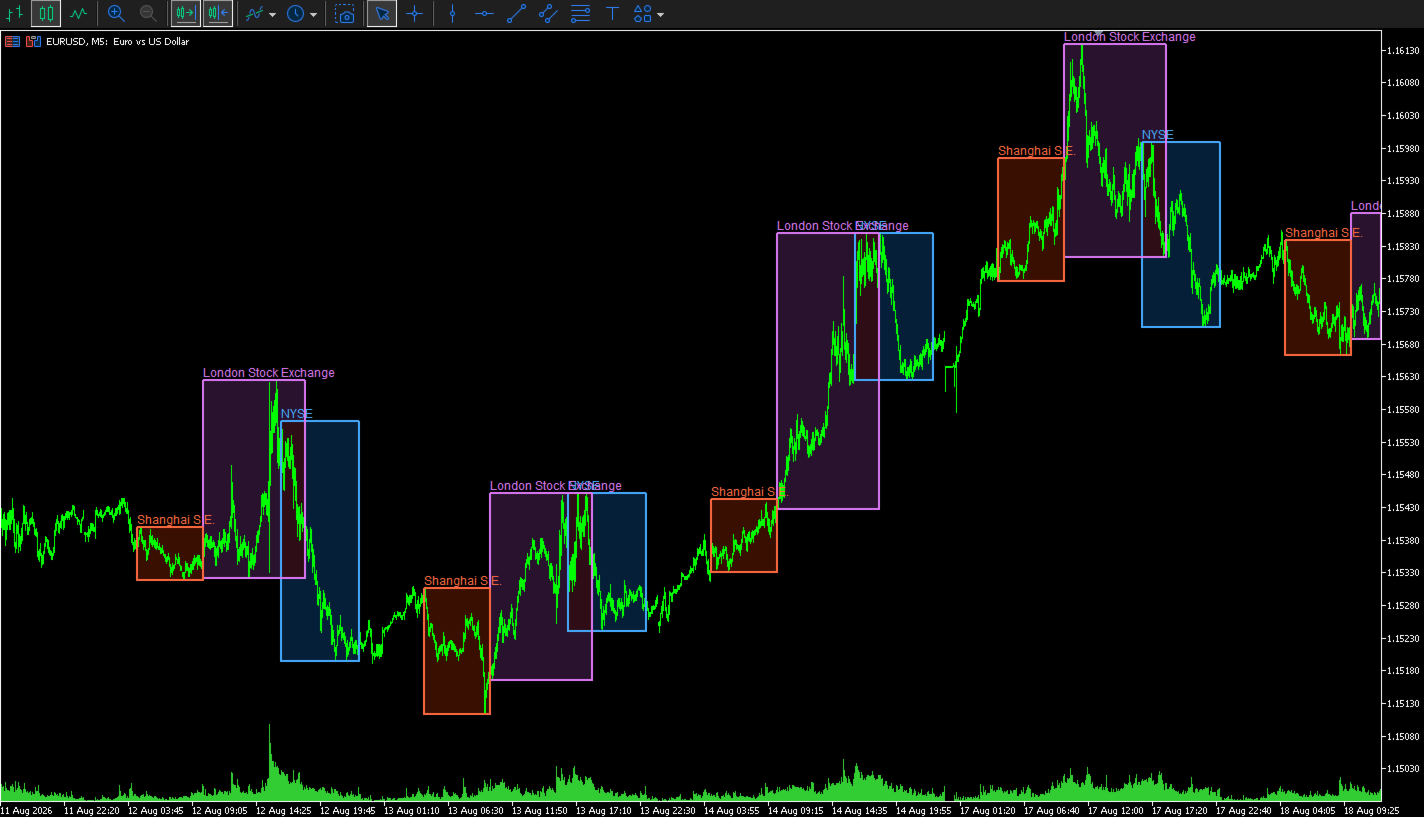
Each session is shown as a colored rectangle. The rectangle starts at the official market open and ends at the official market close. Its upper and lower edges follow the session high and low as new prices arrive.

This makes it easy to see when major equity markets are active, where each session formed its range, and how price reacted when sessions overlapped.

Included exchanges

The indicator supports six stock exchanges:

  • New York Stock Exchange — NYSE

  • London Stock Exchange — LSE

  • Shanghai Stock Exchange — SSE

  • Tokyo Stock Exchange — TSE

  • Hong Kong Stock Exchange — HKEX

  • Euronext

Each exchange can be enabled or disabled separately.

By default, the indicator displays:

  • NYSE

  • London Stock Exchange

  • Shanghai Stock Exchange

Tokyo, Hong Kong, and Euronext are included but disabled by default. You can enable them from the indicator inputs at any time.

Regular session hours

The indicator uses the following regular cash-market hours:

  • NYSE: 09:30–16:00 New York time

  • London Stock Exchange: 08:00–16:30 London time

  • Shanghai Stock Exchange: 09:30–15:00 Shanghai time

  • Tokyo Stock Exchange: 09:00–15:30 Tokyo time

  • Hong Kong Stock Exchange: 09:30–16:00 Hong Kong time

  • Euronext: 09:00–17:30 Central European time

Automatic broker-time conversion

You do not need to calculate the difference between exchange time and broker time.

The indicator reads the broker’s current server time and compares it with GMT. It then converts each exchange session into the time used by your chart.

This is useful because MetaTrader brokers do not all use the same server time. One broker may use UTC, another may use UTC+2, and another may change its server offset during daylight saving time.

Three broker-time modes are available.

Auto Current Offset

This is the default mode.

The indicator calculates the current broker offset from:

TimeTradeServer() - TimeGMT()

The detected offset is used for all displayed sessions.

This mode is suitable when you mainly use the current day or when your broker keeps a fixed UTC offset.

Auto European DST

This mode detects the current broker offset and applies a European daylight-saving schedule to historical dates.

It is useful for brokers that change their server time according to European summer-time rules.

Use this mode when older session rectangles shift by one hour after a daylight-saving change.

Manual Fixed Offset

This mode lets you enter the broker’s UTC offset in minutes.

Examples:

  • UTC: 0

  • UTC+1: 60

  • UTC+2: 120

  • UTC+3: 180

  • UTC-5: -300

This mode is useful when the automatic result does not match your broker or when you use a broker with a fixed server offset.

Exchange daylight saving time

The indicator calculates daylight saving time separately for the exchanges that use it.

It includes:

  • US daylight saving time for NYSE

  • UK daylight saving time for the London Stock Exchange

  • European daylight saving time for Euronext

Shanghai, Tokyo, and Hong Kong use fixed UTC offsets because these locations do not currently change their clocks during the year.

This separate calculation is important during the weeks when the United States and Europe change their clocks on different dates.

Dynamic session highs and lows

The rectangle is not based on a fixed price height.

When a session starts, the indicator reads the price bars inside that session. It finds the highest high and the lowest low, then uses those values as the top and bottom of the rectangle.

While the session is active:

  • A new session high moves the upper edge higher.

  • A new session low moves the lower edge lower.

  • The rectangle keeps its official opening and closing times.

  • The range updates as new price data arrives.

After the session closes, the completed high and low remain visible for the selected history period.

The default calculation timeframe is M1. This gives the indicator a more precise session range, even when it is attached to a higher chart timeframe.

You can change the calculation timeframe if you want to reduce the amount of historical data that MetaTrader must load.

Transparent-style session fills

Each session uses two separate rectangles:

  • A soft background fill

  • A clear foreground border

The fill color is blended with the current chart background. This produces a transparent-style result on both dark and light chart themes.

The default fill opacity is 22%.

You can change the opacity from 0 to 100:

  • 0 makes the fill fully hidden.

  • Lower values create a softer session area.

  • Higher values make the session color stronger.

  • 100 uses the full selected fill color.

The border is not affected by the fill opacity. It remains clear so that the session range is still easy to identify.

By default, fills are drawn behind the candles and borders are drawn in front of the candles.

Session colors

Every exchange has separate fill and border color settings.

The default colors are:

  • NYSE: blue

  • London: purple

  • Shanghai: orange-red

  • Tokyo: yellow

  • Hong Kong: green

  • Euronext: cyan

You can change each color from the indicator inputs.

The fill and border colors do not need to match. For example, you can use a dark blue fill with a bright blue border, or turn the fill off and display only the session outline.

Labels

The indicator can place the exchange name at the upper-left area of each session rectangle.

Labels use the session border color, which helps connect the name with its rectangle.

You can:

  • Show or hide labels

  • Change the label font size

  • Change the label color by changing the session border color

Labels are enabled by default.

Border settings

The session border can be adjusted to match your chart style.

Available settings include:

  • Border color for each exchange

  • Border width

  • Border line style

  • Foreground or background drawing

The default border width is two pixels, which keeps the session outline visible without covering too much price information.

Historical sessions

The History Days input controls how many calendar days the indicator processes.

The default value is 10 days.

A higher value displays more historical sessions, but it also requires more price data and more chart objects.

For normal intraday use, a value between 5 and 20 days is usually sufficient.

Only Monday-to-Friday session dates are processed. Weekend sessions are not drawn.

Refresh rate

The indicator checks active sessions at a regular interval.

The default refresh interval is five seconds.

It also updates when:

  • A new price calculation occurs

  • The chart changes

  • The chart scale or visible area changes

A shorter refresh interval gives faster visual updates but causes MetaTrader to process the session data more often.

Main inputs

General settings

InpHistoryDays

Sets the number of historical calendar days to process.

InpHighLowTimeframe

Sets the timeframe used to calculate each session high and low. The default is M1.

InpRefreshSeconds

Sets the update interval in seconds.

InpShowLabels

Shows or hides exchange names.

InpLabelFontSize

Sets the label text size.

InpFillRectangles

Enables or disables the colored session fills.

InpFillOpacityPercent

Controls the strength of the session fill from 0 to 100.

InpDrawFillBehindCandles

Places the session fill behind the price candles.

InpDrawBordersInForeground

Places session borders in front of the candles.

InpBorderStyle

Sets the border line style.

InpBorderWidth

Sets the border thickness.

Broker-time settings

InpBrokerOffsetMode

Selects automatic current offset, automatic European DST, or manual fixed offset.

InpManualBrokerUTCMinutes

Sets the manual broker UTC offset in minutes.

This value is used when Manual Fixed Offset is selected. It is also used as a fallback if automatic time detection is not available.

Exchange settings

Each exchange has:

  • An enable or disable switch

  • A fill color

  • A border color

This lets you build a simple three-session layout or display all six exchanges.

Suggested setup

For a clean intraday chart, start with the default settings:

  • NYSE enabled

  • London enabled

  • Shanghai enabled

  • All other exchanges disabled

  • M1 high and low calculation

  • 10 history days

  • 22% fill opacity

  • Two-pixel borders

  • Labels enabled

If the chart becomes too busy, reduce the history period or disable the labels.

If the fill is too weak, increase the opacity to approximately 30–35%.

If the fill is too strong, reduce it to approximately 10–15%.

Practical uses

The indicator can help with several types of analysis.

Session range analysis

See the high and low formed during each stock-market session.

Session overlap

Identify periods when two major markets are open at the same time, such as London and New York.

Breakout context

See whether price breaks above or below a completed session range.

Volatility comparison

Compare the size of the Asian, European, and US session ranges.

Intraday support and resistance

Use completed session highs and lows as reference levels for later price action.

Market timing

See which major equity market is active without converting local exchange times manually.

Important notes

The indicator uses regular weekday session schedules.

It does not contain an exchange holiday calendar. It also does not automatically adjust for special early-close days, emergency closures, or temporary exchange schedule changes.

If the chart symbol continues to trade while a stock exchange is closed for a holiday, MetaTrader may still provide price bars during the normal session window. In this case, the indicator can draw a rectangle even though the physical exchange is closed.

Historical accuracy also depends on the price history supplied by your broker. Missing M1 data can prevent a session rectangle from appearing or can produce an incomplete range.

The indicator is designed for visual analysis. It does not provide trading signals, alerts, order execution, or profit guarantees.
Recommended products
Trading Session MT5
Kevin Schneider
3 (1)
Trading Session Indicator The Trading Session Indicator visualizes the high and low points as well as the start and end times of the Asian, London, and New York trading sessions directly on your chart. Features: Visualization of major trading sessions Highlighting of high and low points Display of start and end times for each session Customizable session times User-friendly and efficient Customizability: Each trading session (Asian, London, New York) can be individually customized to match speci
FREE
Crow s r v1
Cristobal Hidalgo Soriano
S_R_MT5_V1 Professional Support and Resistance indicator for MetaTrader 5 designed for traders looking for fast, clean and visual key market zones. S_R_MT5_V1 automatically detects important support and resistance levels displaying dynamic zones directly on the chart with a modern and optimized visualization for intraday trading and scalping. Perfect for: Scalping Intraday trading Reversal trading Breakouts Institutional zone confirmation Main Features: Automatic support and resistance detectio
FREE
Market Hours Pro
Musa Terrance Khosa
Market Hours Pro shows Tokyo, London, and New York trading sessions directly on your MT5 chart, including scheduled overlap periods. It’s designed to give you a clear view of global market timing so you can plan trades, spot high-activity periods, and align strategies with standard Forex hours. How It Works Displays scheduled session times visually on your chart. Highlights session overlaps for London/New York and Tokyo/London. Automatically adjusts times for your timezone or broker time. Shows
FREE
Multi Currency Strength Dashboard Mini (FREE) – Currency Strength Meter for MetaTrader 5 Multi Currency Strength Dashboard Mini is a free indicator for MetaTrader 5 that displays the relative strength of the 8 major currencies (USD, EUR, GBP, JPY, CHF, CAD, AUD, NZD) in real time, in a clear and quick-to-read dashboard. Goal: identify in seconds which currencies are strong and which are weak, so you can build a focused watchlist (for example, pick pairs where a strong currency faces a weak one).
FREE
Pivot Points Daily
Davide Zunino
4.8 (5)
The Indicator show Daily Pivot Points. It is possible to specify the number of days to display. For forex it doesn't consider the sunday session data. It is possibile to modify the color, style and  width for every level. It is better to use this indicator with timeframe not higher than Н1. 4 Levels of support and resistance with also Intermediate Levels that is possible to hide.
FREE
主要城市的时间。北京时间、东京时间、悉尼时间、惠灵顿时间、纽约时间、法兰克福时间、伦敦时间、迪拜时间。 城市时间可选择开启或者关闭。 点差变色提醒。设置点差提醒点数,例如,设置100点,点差大于100点,文字会变红色。 Time in major cities. Beijing time, Tokyo time, Sydney time, Wellington time, New York time, Frankfurt time, London time, Dubai time. City time can be turned on or off. Dot difference color change reminder. Set the point difference reminder points. For example, set 100 points. If the point difference is greater than 100 points, the text will turn red.
FREE
SESSION SUHUTRADE: Master the Market Hours with Precision Are you tired of missing out on high-probability setups during specific trading sessions? Do you struggle to identify when the Asian, London, or New York markets are truly active and presenting the best opportunities? Introducing SESSION SUHUTRADE , the ultimate MQL5 indicator designed to give you unparalleled clarity over the global trading sessions. This powerful tool automatically detects and highlights the exact market hours for Asia,
FREE
The "Session Time Vertical Lines" indicator displays vertical lines on the chart that mark the beginning and end of major global trading sessions: Sydney, Tokyo, London, and New York . It is designed to help traders visually identify active market hours, overlaps, and potential high-volume periods directly on the price chart. This tool is especially useful for intraday traders who rely on market session timing to plan entries and exits. Inputs / Settings Parameter Name Description DaysToDraw Num
FREE
this free candle stick timer works on all symbol and all timeframe, in dicator help you to see remain time in hours, minutes, seonds until it close, it is simple and easy to use  and very light, it doesn't not consume much RAM, CPU. you can change font size and can change color of the indicator and what time frame you want it to work on, you also can choose to disable it on specifix time frame.
FREE
Smart FVG Stats
- Md Rashidul Hasan
5 (1)
The  Smart FVG Statistics Indicator  is a powerful MetaTrader 5 tool designed to automatically identify, track, and analyze Fair Value Gaps (FVGs) on your charts. Love it? Hate it? Let me know in a review! Feature requests and ideas for new tools are highly appreciated. :) Try "The AUDCAD Trader": https://www.mql5.com/en/market/product/151841 Key Features Advanced  Fair Value Gap  Detection Automatic Identification : Automatically scans for both bullish and bearish FVGs across specified histo
FREE
ZigZag Support and Resistance Levels
Tshidiso Ephraim Mpakanyane
2 (1)
ZigZag Support and Resistance Levels (v2.0)  is an indicator for MetaTrader 5 that identifies support and resistance levels based on ZigZag pivot points, now with an interactive on-chart control panel. It groups nearby levels into zones using a clustering method to help visualize areas where price has reacted multiple times, and distinguishes broken (breakout) levels from active (extension) levels. Key Features 1. ZigZag Pivot Detection Detects swing highs and lows using configurable Depth, Dev
FREE
Support And Resistance indicator that can display round levels and zones . It shows them directly on the chart, providing an easy help when you want to set stop-loss or take-profit level, or when you want to see the next market target.   If an asset price is moving down and bounces back up, the level is called support (think: price floor). If an asset price is moving upward and hits a level where it reverses downward, this is called resistance (think: price ceiling).
FREE
This Small tool allows you to define a time counter in minutes for the closing of your positions according to the number of minutes you have set. For example if you set it to 30 Min, the tool will close each open position after 30 minutes from its opening. The settings ACTIVE: It is to activate the tool and use it to close your positions after the number of minutes defined. MANAGE: you to choose with the symbols managed by the tool. Choose "ALL CURENCY" if you want the system to apply to
FREE
FREE — the Donchian breakout channel and the ATR trailing stop that manages the trade after the break, drawn on one chart. 100% free, no limitations. If it earns a place on your charts, a short review is the one thing that helps us most — it takes 30 seconds and it is what lets other traders find this tool. Platform: MetaTrader 5 (this page). MetaTrader 4 edition: https://www.mql5.com/en/market/product/185552 Most breakout indicators show you the entry and stop there. The hard part of trend
FREE
Trend View
Emanuele Cartelli
Trend View is a simple indicator that shows in a text the trend of the current currency in the timeframe you choose. Inputs are: Color: color of the text. Timeframe: timeframe for calculations. Trend can be: UP: bullish trend. DOWN: bearish trend. ---: trend not defined. You can use this indicator to show the main trend of a bigger timeframe helping you to choose your trades. Note: text is draggable.  
FREE
DC Indicator
Lamont Simone Reynecke
The donchian channel indicator might just be the best fit for you Trading in derivative products such as futures, options, CFD's, forex and certificates contains significant risk. These products are not suitable for every investor. Investors could potentially lose all or more than the original investment. If anything, only money equal to personal risk capital should be used and can be lost without jeopardizing financial security or lifestyle. Partially or fully automated trading programs can
FREE
AI London Session Range Indicator automatically draws the London session's opening range as a box on your chart, giving breakout and session traders an instant, objective reference for the high-volatility window that sets the tone for the rest of the trading day. The indicator tracks the exact high and low reached during the configured opening-range window after the London session start, plots it as a shaded box, and keeps it visible for the rest of the session so you can watch for breakouts, re
FREE
Neon Profile
Manuel Fernandez Barranco
XBK Neon Profile MT5 Developed by XBK Systems. XBK Neon Profile is an advanced technical indicator for MetaTrader 5 that combines smoothed trend analysis and a dynamic volume profile within a single chart window. The indicator is designed to provide a clear view of market structure and significant volume levels without cluttering the screen. Key Features Smoothed Trend Bands (Neon Trend Bands) Identifies the current trend direction using a custom smoothing algorithm designed to filter out market
FREE
Cybertrade Keltner Channels
Emanuel Andriato
4.67 (6)
Cybertrade Keltner Channels - MT5 Created by Chester Keltner, this is a volatility indicator used by technical analysis. It is possible to follow the trend of financial asset prices and generate support and resistance patterns. In addition, envelopes are a way of tracking volatility in order to identify opportunities to buy and sell these assets. It works on periods longer than the period visible on the chart. All values ​​are available in the form of buffers to simplify possible automations.
FREE
(Special New Year promotion - free price!) The indicator displays the actual 'Scale in points per bar' (identical to the manual setting in the Terminal, see screenshot) in the upper right corner of the chart. The displayed value changes INSTANTLY whenever the chart scale is changed! (This is very convenient when planning screenshots). In Settings: Change language (Russian/English), font size of the displayed text, text label offset coefficient from the graph corner, equally in X and Y directi
FREE
Easy SMC Trading
Israr Hussain Shah
3.8 (5)
Structure Trend with Auto RR & BOS Scanner Here   our more valuable tools SMC Trend Trading   ,  Easy SMC Trading  ,  Institutional SMC Architect Volume Analysis Tools  ,  Volume flow Profile  ,  Market volume profile  , FVG with Volume  , Liquidity Heatmap Profile  ,  Volume Spread Analysis   1. Smart Trend Intelligence Master market structure with institutional precision. Adaptive Flow:   Super Trend (CCI+ATR) logic with trend-reactive candle coloring. Auto-Structure:   Instant labeling of H
FREE
Forex17 Bollinger Channel
Robinson Alves Lemos
5 (1)
This indicator displays only the upper and lower bands of a Bollinger-style volatility channel, without plotting the central moving average. Its primary goal is to provide a clean and flexible volatility envelope, allowing traders to focus on price behavior relative to the channel boundaries, while maintaining full control over chart aesthetics and composition. Unlike traditional Bollinger Bands, where the middle moving average is always displayed, this indicator uses the moving average internal
FREE
Candle Timer Simple
Jithin Sajan Sajan
5 (1)
SETTINGS Make sure to select Chart shift option in the chart.   (Right click in the chart ---> Properties (dialog box) ----> Select Chart Shift) Kindly rate and comment about the product for upgradation & Support When using candlestick timers, keep in mind that the timing of candlestick patterns can play a crucial role in your trading strategy. For instance, different timeframes (such as 1-minute, 5-minute, hourly, ) can provide varying insights into price movements and trends. Make sure to i
FREE
This Mt5 Indicator Signals when there is two opposite direction bars engulfed by current bar.  has a recent Exponential Moving Average Cross and past bar was oversold/bought Expert Advisor Available in Comments  Free Version Here : https://www.mql5.com/en/market/product/110114?source=Site&nbsp ; Full Alerts for mt5 terminal , phone , email, print to file, print to journal  Buy Signal ( blue line ) Past ema cross ( set at 30 bars back ) Past bar rsi is oversold ( level 40  ) Engulfing bar closes
FREE
WH Price Wave Pattern MT5
Wissam Hussein
4.15 (13)
Welcome to our Price Wave Pattern MT5 --(ABCD Pattern)-- The ABCD pattern is a powerful and widely used trading pattern in the world of technical analysis. It is a harmonic price pattern that traders use to identify potential buy and sell opportunities in the market. With the ABCD pattern, traders can anticipate potential price movements and make informed decisions on when to enter and exit trades. Send me a  Message and Get A Free Gift : ABCD  Symbol Scanner Dashboard! EA Version:    Price W
FREE
Smc Session Killzone and Breakout The Smc Session Killzone and Breakout indicator automates the institutional session trading model for MetaTrader 5. It draws the Asian, London, and New York session ranges as labelled boxes on the chart, detects when price sweeps beyond the Asian session high or low, and fires a non-repainting entry signal after a Market Structure Shift is confirmed. All signals are based on closed bars and do not repaint. The underlying model follows the sequence that institut
FREE
HammerStar
Arismario Verissimo Neves
3.4 (5)
The HammerStar indicator is designed to search for the Hammer and Shooting Star patterns on charts of any currency pairs. Hammer Downward trend. The lower shadow is not less than 2 and no more than 3 times larger than the body. There is no upper shadow, or it is very short (no more than 10% of the candlestick range). The color of the body in the long game is not important, with the short - white hammer is much stronger than the black one. Confirmation is suggested. Shooting Star Uptrend. The u
FREE
See the Asia, London and New York sessions at a glance: range boxes with their size in pips or points, optional ICT killzones and a live session panel that shows what is open now, how far it has moved and when the next session starts. Clean, automatic and correct for every broker time zone. SESSIONS - Asia, London and New York drawn as range boxes from the session high to the session low. - 50% level of every session as a subtle dotted line. - Session name and range (pips or points) on each box
FREE
The "Support Resistance Dynamic" indicator is a powerful technical analysis tool for the MetaTrader 5 platform, designed to automatically identify and plot dynamic Support and Resistance zones on price charts. This indicator helps traders easily recognize important price levels, potential reversal points, or breakout areas, thereby enabling more informed trading decisions. 2. Key Features Dynamic S/R Identification : Automatically identifies support and resistance zones based on an advanced Pivo
FREE
ICT Killzones and Liquidity Levels is a clean chart tool that marks the main ICT killzones and key liquidity levels directly on your chart. It is designed for traders who follow Smart Money Concepts and ICT-style price action and want a simple, non-repainting reference on the chart. The indicator draws the Asian, London, New York and London Close killzones as boxes based on the session high and low. A vertical line marks the start of each killzone for the current day, so you can see when each se
FREE
Buyers of this product also purchase
Trend Sniper X
Sarvarbek Abduvoxobov
4.9 (40)
Trend Sniper X is a multi-timeframe trend-following indicator for MetaTrader 5 that helps traders identify trend direction and potential reversal points with clarity and precision. for MT4: https://www.mql5.com/en/market/product/193245 Price Information: The current price is promotional and is subject to change as upcoming updates and new features are released. Bonus Offer: To get the FREE Auto-Trade Assistant EA for this indicator, please message the author after purchasing. Code2Profit Channe
Smart Trend Trading System — MetaTrader 5 Message me on MQL5 after purchase to receive Smart Universal Expert Advisor for FREE, plus the online course, PDF manual, and private group access. STTS brings trend direction, entry and exit signals, reversal zones, and important price levels together on your chart. Follow the system manually, or connect a separate compatible EA for automated execution using your chosen settings. ONE SYSTEM. FOUR TRADING APPROACHES. STTS organizes its trading approaches
ARIPoint
Temirlan Kdyrkhan
1 (4)
ARIPoint is a powerful trading companion designed to generate high-probability entry signals with dynamic TP/SL/DP levels based on volatility. Built-in performance tracking shows win/loss stats, PP1/PP2 hits, and success rates all updated live. Key Features: Buy/Sell signals with adaptive volatility bands Real-time TP/SL/DP levels based on ATR Built-in MA Filter with optional ATR/StdDev volatility Performance stats panel (Success, Profit/Loss, PP1/PP2) Alerts via popup, sound, push, or email Cu
Zoryk Gold
Reda El Koutbane
5 (15)
discount ends SOON next price 69 $ ZORYK — Advanced XAUUSD Signal System for MetaTrader 5 You know the feeling. You spend time analyzing gold. You wait for the entry. You finally open the trade, and price immediately moves against you. You close too early, move the Stop Loss or hesitate for a few seconds. Then the market reaches the exact destination you originally expected without you. The direction was not always the problem. The real problem was uncertainty. You did not know exactly where th
SuperScalp Pro
Van Minh Nguyen
4.66 (35)
SuperScalp Pro - Professional Multi-Layer Confluence Scalping System SuperScalp Pro is an advanced scalping indicator that upgrades classic Supertrend with multiple intelligent confirmation filters. It helps you identify higher-probability Buy/Sell opportunities while significantly reducing false signals. Clear Buy and Sell arrows appear directly on the chart, with automatic ATR-based Stop Loss and Take Profit levels calculated in real time. After purchase, contact me for setup guidance and reco
Gann Made Easy   is a professional and easy to use Forex trading system which is based on the best principles of trading using the theory of W.D. Gann. The indicator provides accurate BUY and SELL signals including Stop Loss and Take Profit levels. You can trade even on the go using PUSH notifications. PLEASE CONTACT ME AFTER PURCHASE TO GET TRADING  INSTRUCTIONS   AND GREAT EXTRA INDICATORS  FOR FREE! Probably you already heard about the Gann trading methods before. Usually the Gann theory is a
SMC Intraday Formula
VividMind Digital Solutions
5 (26)
Secure the Lowest Price Today. After purchase, contact via   MQL5 inbox   to receive your buyer kit and bonus. Let's be honest first. No indicator will make you profitable on its own. If someone tells you otherwise, they're selling you a dream. Every indicator that shows perfect buy/sell arrows can be made to look flawless — just zoom into the right window of history and screenshot the winners. We won't do that. SMC Intraday Formula is a tool. It reads the market structure for you, maps the hig
GoldenX Entry MT5
VividMind Digital Solutions
5 (16)
Price will increase by $20 every 10 buyers to maintain premium value. After purchase, contact via   MQL5 inbox   to receive your buyer kit and bonus. You have probably tested dozens of indicators before. But we are not here to be “just another signals indicator.” Behind GoldenX Entry is intensive research & development focused on building sophisticated algorithms designed to adapt to the real behavior of every instrument — not generic signals recycled everywhere else. From advanced Auto Optim
A new King in town - Indicator + Order management indications(tp1+tp2+tp3) + Optional Telegram Signal sender   INCLUDED (FREE) ( FULL TRADING  and SIGNAL SYSTEM ) Our best EA for Gold: Gold Slayer TRY > Reversion Queen  Expert advisor NEW Free Automation EA link < click here ( disclaimer: this is new and still on testing and phase , use at your risk on demo) Free Telegram Bridge < click here  This indicator includes an advanced Strategy, a trading system with customisable order management and a
Neuro Poseidon MT5
Daria Rezueva
4.75 (52)
Neuro Poseidon is a new indicator by Daria Rezueva. It combines precise trading signals with adaptive TP/SL levels - creating best possible trades as a result! Message me and get  Neuro Poseidon Assistant  as a gift to automize your trading process! What makes it stand out? 1. Proven profitability on all assets and timeframes 2. Only confirmed BUY and SELL signals present on the chart 3. Adaptive TP & SL levels generated by the software for each trade 4. Easy to understand - suitable for al
Auto Optimized SpeedAngle is an institutional-grade momentum vectoring system that eliminates curve-fitting through continuous Walk-Forward Optimization (WFO). Rather than relying on static inputs that degrade when market regimes shift, the indicator dynamically recalibrates its parameters using Out-of-Sample (OOS) validation, ensuring the displayed signals represent genuine statistical edges rather than historical anomalies. By shifting the focus from subjective visual angles to normalized, qua
Entry Points Pro 10 — the legend of the MQL5 Market. Three years in the Market's Top-3. 595 reviews across two versions. Over 31,000 demo downloads. Thousands of traders open their charts with it every morning. Built and traded by an author who has been in the market since 1999. Version 10 is the biggest rebuild in the indicator's history: I read every review from five years — and built the answers into the code. WHAT IT DOES It shows the entry point in advance — strictly without repainting. The
FiboSniper Pro
Van Minh Nguyen
5 (3)
FiboSniper Pro - Multi-Filter Fibonacci System with Auto SL/TP and Control Panel FiboSniper Pro is a technical indicator that combines dynamic Fibonacci Envelopes with multiple confirmation filters to generate selective Buy and Sell signals. Fibonacci levels are calculated from Moving Average and ATR, then filtered by ADX, EMA, RSI, ATR, Volume, Time and Candle structure. The indicator displays automatic ATR-based Stop Loss and Take Profit levels directly on the chart, along with an interactive
Welcome to ENTRY IN THE ZONE AND SMC MULTI TIMEFRAME SPECIAL BENEFIT / FOR OUR MQL5 CUSTOMERS FREE ACCESS TO THE NEW TOOL  — COMING SOON — Learn more on our official website  : https://www.fableedge.net Entry In The Zone and SMC Multi Timeframe is a real-time market analysis tool based on Smart Money Concepts (SMC), designed to analyze market structure, price direction, and key trading zones. It supports both Single-Timeframe Analysis and Multi-Timeframe Analysis, providing a clearer view of the
Unix Scalper
Issam Kassas
4 (4)
Unix Scalper — MetaTrader 5 Message me on MQL5 after purchase to receive Smart Universal Expert Advisor for FREE, plus the online course, PDF manual, and private group access. Find the setup. See the plan. Choose how to trade it. UNIX Scalper brings market analysis, BUY/SELL/WAIT decisions and Entry, Stop Loss, TP1 and TP2 levels into one organized panel. SEE THE SIGNAL AND THE PLAN • Clear decisions: BUY, SELL or WAIT. • Defined levels: Entry, Stop Loss, TP1 and TP2. • Multi-timeframe overvie
M1 Sniper MT5
Oleg Rodin
5 (7)
M1 SNIPER  is an easy to use trading indicator system. It is an arrow indicator which is designed for M1 time frame. The indicator can be used as a standalone system for scalping on M1 time frame and it can be used as a part of your existing trading system. Though this trading system was designed specifically for short-term trading, it still can be helpful for all traders. This trading system can be used with any forex pair and time frame, though lower time frames are recommended from M1 up to M
Adaptive Price Action Engine Buy Indicator- Get EA Based on it for FREE. Self-Optimizing Multi-Timeframe Trend & Candlestick Intelligence Markets do not behave the same way all the time—and not every price-action pattern has the same value in every market regime. Adaptive Price Action Engine is designed to adapt to changing market conditions by combining trend structure, multi-timeframe analysis, candlestick patterns, and statistical optimization into one analytical framework. Two Adaptive Mode
Gold Entry Sniper
Tahir Mehmood
5 (21)
Gold Entry Sniper – Professional Multi-Timeframe ATR Dashboard for Gold Scalping & Swing Trading Gold Entry Sniper is a cutting-edge MetaTrader 5 indicator designed to give traders precise buy/sell signals for XAUUSD and other symbols, powered by ATR Trailing Stop logic and a multi-timeframe analysis dashboard . Built for both scalpers and swing traders, it combines real-time market direction , dynamic stop levels , and professional visual dashboards to help you identify high-probability gold en
Tokyo mt5 Indicator
Vasiliy Strukov
5 (7)
Tokyo Indicator provides a clear visual overview of trend direction, potential trading signals, and market conditions. Its colour-coded, stepped trend line distinguishes bullish phases in blue from bearish phases in magenta. Matching directional arrows highlight potential buying and selling opportunities when the displayed trend changes. An integrated dashboard brings together the current signal, market bias, momentum, volatility, and signal quality in one convenient view. This allows traders t
Scalper Vault   is a professional scalping system which provides you with everything you need for successful scalping. This indicator is a complete trading system which can be used by forex and binary options traders. The recommended time frame is M5. The system provides you with accurate arrow signals in the direction of the trend. It also provides you with top and bottom signals and Gann market levels. The indicator provides all types of alerts including PUSH notifications. PLEASE CONTACT ME A
FX Trend MT5 NG
Daniel Stein
5 (6)
FX Trend NG: The Next Generation Multi-Market Trend Intelligence Overview FX Trend NG is a professional multi-timeframe trend and market monitoring tool designed to give you a complete structural overview of the market in seconds. Instead of switching between dozens of charts, you instantly see which symbols are trending, where momentum is fading, and where strong alignment exists across timeframes. This tool is part of the Stein Investments ecosystem - 18+ tools plus Max, your 1-on-1 AI tradi
FX Power MT5 NG
Daniel Stein
5 (33)
FX Power: Analyze Currency Strength for Smarter Trading Decisions Overview FX Power is your go-to tool for understanding the real strength of currencies and Gold in any market condition. By identifying strong currencies to buy and weak ones to sell, FX Power simplifies trading decisions and uncovers high-probability opportunities. Whether you’re looking to follow trends or anticipate reversals using extreme delta values, this tool adapts seamlessly to your trading style. Don’t just trade—trade
Smart Price Action Concepts — MetaTrader 5 Message me on MQL5 after purchase to receive Smart Universal Expert Advisor for FREE, plus the online course, PDF manual, and private group access. See the structure. Identify the zones. Build your trading plan. Bring Smart Money Concepts (SMC), ICT-style analysis and price action together in one organized chart. Identify market structure, order blocks, liquidity reference levels and imbalances, then choose which elements to display through the Smart Pa
Power Candles MT5
Daniel Stein
4.58 (12)
Power Candles - Self-Optimizing Strength Indicator Strength usually lives in a sub-window. The line runs below, the candle above, and your eye keeps connecting the two. Power Candles puts the strength into the candle itself, colored from dark red to dark green, so the chart reads at a glance and the sub-window stays closed. The indicator also finds its own settings for the symbol and timeframe in front of you. One click on [ Apply Best ] draws entry, Stop Loss and Take Profit at the exact prices
M1 Quantum MT5
Hamed Dehgani
4.2 (10)
Live Trading Signals Using M1 Quantum : Signal  (Trade executed automatically by the Quantum Trade Assistant , included free with this product.) Latest News : Version 1.64 has been released, All trades now have a Stop Loss placed behind the relevant Support/Resistance zones. The Smart Close function has also been improved to increase the EA’s performance in this version. Since August 9, the live signal has been running on Version 1.64. Price Plan: Current Price: $169 (Early Adopter Offer) Next
Market Structure Order Block Dashboard MT5 is an MT5 indicator designed for traders who want to read market structure and the main price reaction zones directly on the chart. It combines BOS, ChoCH, Order Blocks, Fair Value Gaps (FVG), Liquidity, Kill Zones, Volume Profile, and a compact dashboard for quick analysis. This indicator targets traders who use market structure, ICT and Smart Money concepts as a decision framework. It can help spot trend continuations, possible reversals, price imbala
Atomic Analyst MT5
Issam Kassas
4.47 (60)
Atomic Analyst — MetaTrader 5 Message me on MQL5 after purchase to receive Smart Universal Expert Advisor for FREE, plus the online course, PDF manual, and private group access. Atomic Analyst brings price action, trend direction, entry and exit signals, Stop Loss and multiple Take Profit levels together on your chart. SEE THE SIGNAL. UNDERSTAND THE SETUP. Atomic Analyst organizes its analysis into clear visual information: • Buy and sell arrows to identify potential entries. • Stop Loss and mul
Crystal Heikin Ashi Signals
Muhammad Jawad Shabir
5 (4)
Crystal Heikin Ashi Signals—Professional Trend & Signal Detection Indicator Advanced Heikin Ashi Visualization with Intelligent Signal System for Manual & Automated Trading Final Price: $149 ---------> Price goes up $10 after every 10 sales . Limited slots available — act fast . Overview User Guide PDF Crystal Heikin Ashi Signals is a professional-grade MetaTrader 5 indicator that combines pure Heikin Ashi candle visualization with an advanced momentum-shift detection system. Designed for both m
Divergence Bomber
Ihor Otkydach
4.89 (94)
Each buyer of this indicator also receives the following for free: The custom utility "Bomber Utility", which automatically manages every trade, sets Stop Loss and Take Profit levels, and closes trades according to the rules of this strategy Set files for configuring the indicator for various assets Set files for configuring Bomber Utility in the following modes: "Minimum Risk", "Balanced Risk", and "Wait-and-See Strategy" A step-by-step video manual to help you quickly install, configure, and
Quant Direction MT5
Georgios Kalomoiropoulos
Quant Direction is a 3 dimensional market analysis tool. It provides a purely objective, algorithmic view of the market by calculating exact percentage-based biases across multiple dimensions simultaneously. Developed utilizing advanced AI modeling tools and subjected to thorough testing, this algorithm is engineered to read the market with unique precision. It can analyze any currency pair or financial instrument available on your platform.  Quant Direction is the ideal tool whether you are a S
More from author
Liquidity Breaks and Swings
Erik Istvan Fazekas
5 (2)
See "What's New" for a breakdown of the newest functions. v1.4 was just a tidy up, nothing special //+---------------------------------------------------------------------------------------------------------------+ I've created this because I needed a customisable fractal indicator. It also checks for decreasing volumes to have some kind of confirmation. Breakdown below: Overview This indicator is designed to help identify key swing points in the market by analyzing price action and volume dyna
FREE
Dynamic Volume Profile/Delta Selected Range Volume Delta Profile displays volume distribution and estimated delta within a user-defined chart range. Move or resize the selection rectangle to analyze a different period. The indicator plots the volume profile, positive and negative delta, Point of Control (POC), and Value Area Low and High levels (VVL and VVH). Profiles can be calculated from quote ticks or lower-timeframe bars, with support for tick or real volume when available. Adjustable opti
FREE
Filter:
No reviews
Reply to review