Dynamic Global Exchange Sessions

Global Exchange Sessions

Global Exchange Sessions is an MQL5 indicator that marks the regular trading hours of the world’s main stock exchanges directly on your chart.

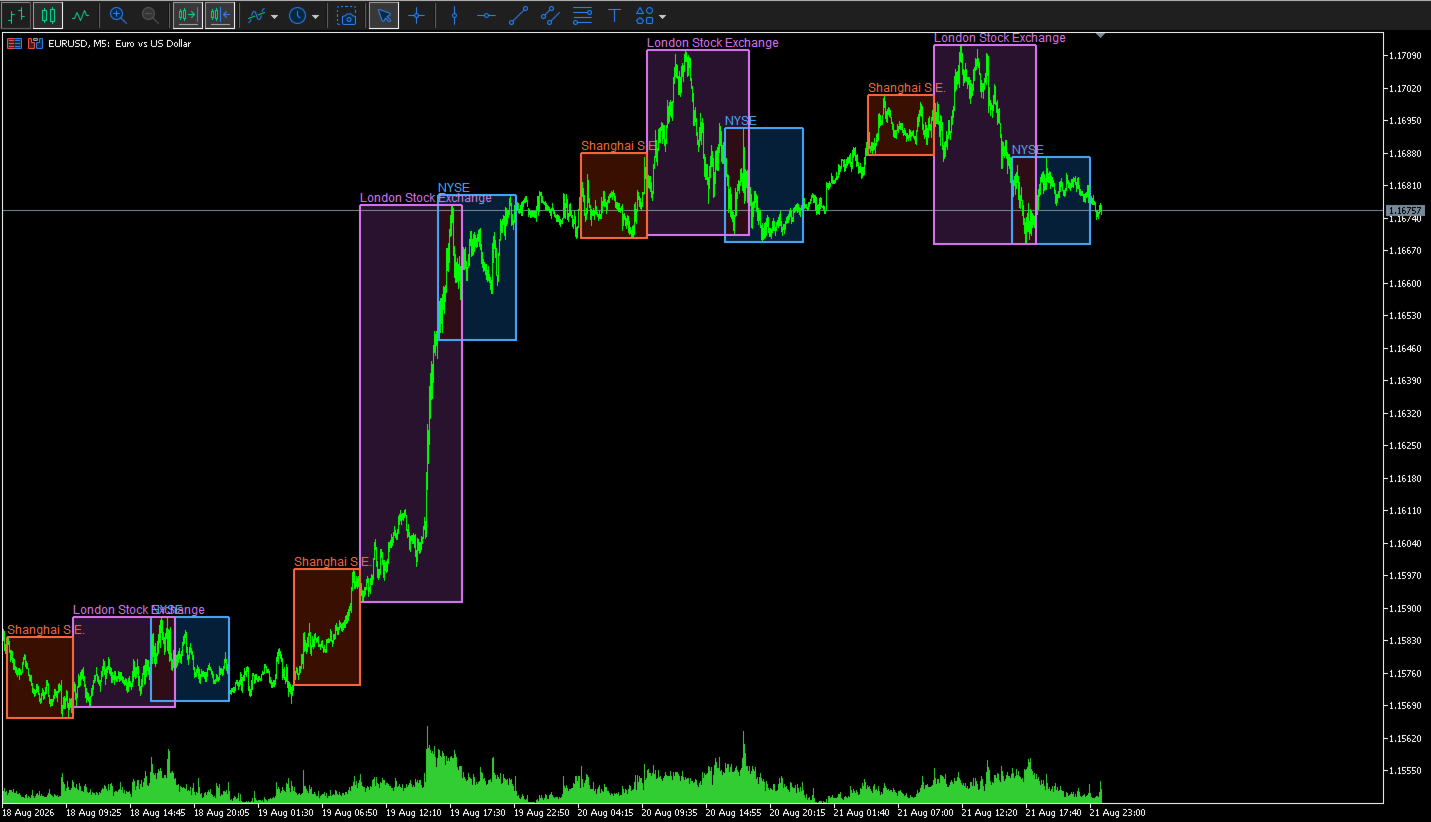
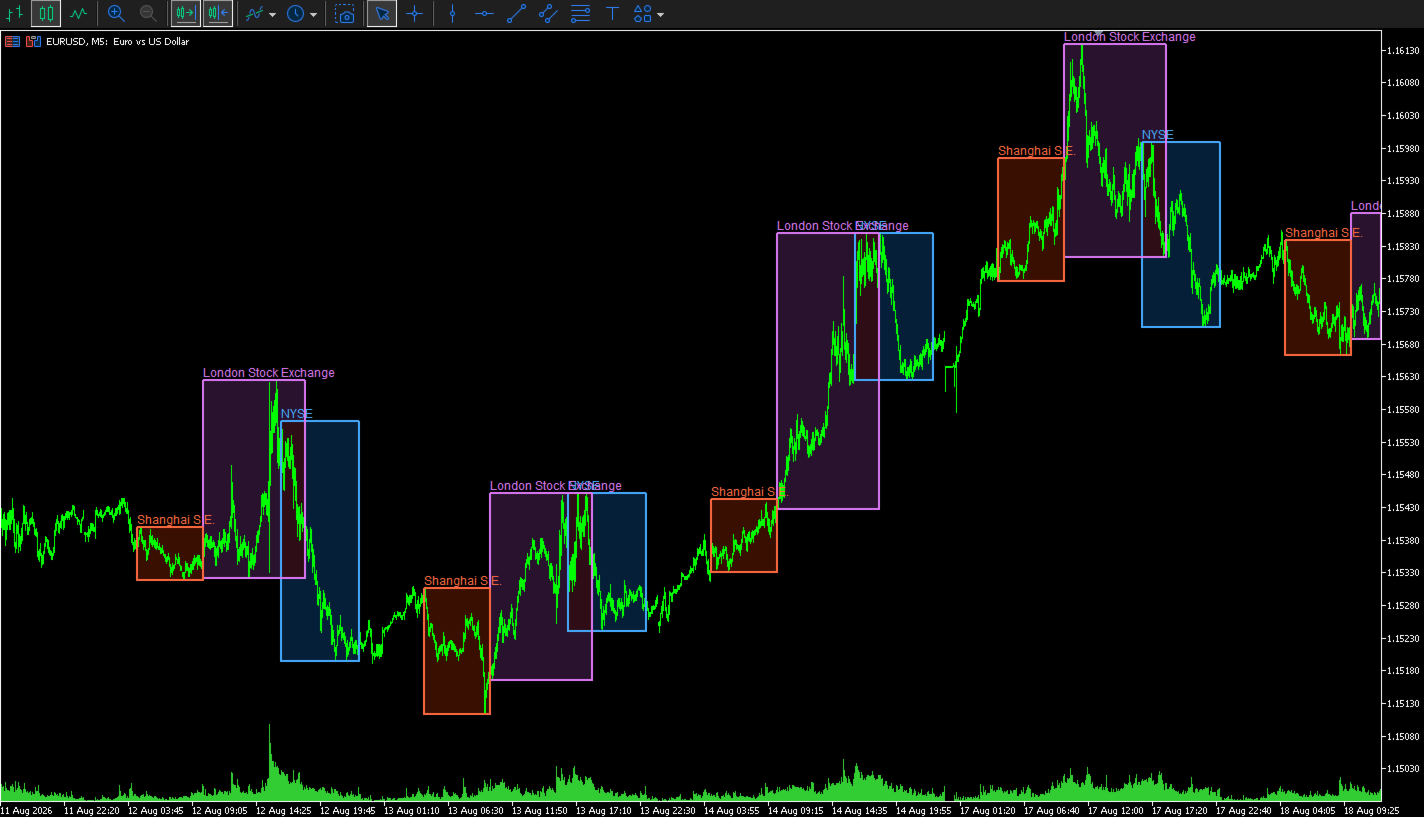
Each session is shown as a colored rectangle. The rectangle starts at the official market open and ends at the official market close. Its upper and lower edges follow the session high and low as new prices arrive.

This makes it easy to see when major equity markets are active, where each session formed its range, and how price reacted when sessions overlapped.

Included exchanges

The indicator supports six stock exchanges:

  • New York Stock Exchange — NYSE

  • London Stock Exchange — LSE

  • Shanghai Stock Exchange — SSE

  • Tokyo Stock Exchange — TSE

  • Hong Kong Stock Exchange — HKEX

  • Euronext

Each exchange can be enabled or disabled separately.

By default, the indicator displays:

  • NYSE

  • London Stock Exchange

  • Shanghai Stock Exchange

Tokyo, Hong Kong, and Euronext are included but disabled by default. You can enable them from the indicator inputs at any time.

Regular session hours

The indicator uses the following regular cash-market hours:

  • NYSE: 09:30–16:00 New York time

  • London Stock Exchange: 08:00–16:30 London time

  • Shanghai Stock Exchange: 09:30–15:00 Shanghai time

  • Tokyo Stock Exchange: 09:00–15:30 Tokyo time

  • Hong Kong Stock Exchange: 09:30–16:00 Hong Kong time

  • Euronext: 09:00–17:30 Central European time

Automatic broker-time conversion

You do not need to calculate the difference between exchange time and broker time.

The indicator reads the broker’s current server time and compares it with GMT. It then converts each exchange session into the time used by your chart.

This is useful because MetaTrader brokers do not all use the same server time. One broker may use UTC, another may use UTC+2, and another may change its server offset during daylight saving time.

Three broker-time modes are available.

Auto Current Offset

This is the default mode.

The indicator calculates the current broker offset from:

TimeTradeServer() - TimeGMT()

The detected offset is used for all displayed sessions.

This mode is suitable when you mainly use the current day or when your broker keeps a fixed UTC offset.

Auto European DST

This mode detects the current broker offset and applies a European daylight-saving schedule to historical dates.

It is useful for brokers that change their server time according to European summer-time rules.

Use this mode when older session rectangles shift by one hour after a daylight-saving change.

Manual Fixed Offset

This mode lets you enter the broker’s UTC offset in minutes.

Examples:

  • UTC: 0

  • UTC+1: 60

  • UTC+2: 120

  • UTC+3: 180

  • UTC-5: -300

This mode is useful when the automatic result does not match your broker or when you use a broker with a fixed server offset.

Exchange daylight saving time

The indicator calculates daylight saving time separately for the exchanges that use it.

It includes:

  • US daylight saving time for NYSE

  • UK daylight saving time for the London Stock Exchange

  • European daylight saving time for Euronext

Shanghai, Tokyo, and Hong Kong use fixed UTC offsets because these locations do not currently change their clocks during the year.

This separate calculation is important during the weeks when the United States and Europe change their clocks on different dates.

Dynamic session highs and lows

The rectangle is not based on a fixed price height.

When a session starts, the indicator reads the price bars inside that session. It finds the highest high and the lowest low, then uses those values as the top and bottom of the rectangle.

While the session is active:

  • A new session high moves the upper edge higher.

  • A new session low moves the lower edge lower.

  • The rectangle keeps its official opening and closing times.

  • The range updates as new price data arrives.

After the session closes, the completed high and low remain visible for the selected history period.

The default calculation timeframe is M1. This gives the indicator a more precise session range, even when it is attached to a higher chart timeframe.

You can change the calculation timeframe if you want to reduce the amount of historical data that MetaTrader must load.

Transparent-style session fills

Each session uses two separate rectangles:

  • A soft background fill

  • A clear foreground border

The fill color is blended with the current chart background. This produces a transparent-style result on both dark and light chart themes.

The default fill opacity is 22%.

You can change the opacity from 0 to 100:

  • 0 makes the fill fully hidden.

  • Lower values create a softer session area.

  • Higher values make the session color stronger.

  • 100 uses the full selected fill color.

The border is not affected by the fill opacity. It remains clear so that the session range is still easy to identify.

By default, fills are drawn behind the candles and borders are drawn in front of the candles.

Session colors

Every exchange has separate fill and border color settings.

The default colors are:

  • NYSE: blue

  • London: purple

  • Shanghai: orange-red

  • Tokyo: yellow

  • Hong Kong: green

  • Euronext: cyan

You can change each color from the indicator inputs.

The fill and border colors do not need to match. For example, you can use a dark blue fill with a bright blue border, or turn the fill off and display only the session outline.

Labels

The indicator can place the exchange name at the upper-left area of each session rectangle.

Labels use the session border color, which helps connect the name with its rectangle.

You can:

  • Show or hide labels

  • Change the label font size

  • Change the label color by changing the session border color

Labels are enabled by default.

Border settings

The session border can be adjusted to match your chart style.

Available settings include:

  • Border color for each exchange

  • Border width

  • Border line style

  • Foreground or background drawing

The default border width is two pixels, which keeps the session outline visible without covering too much price information.

Historical sessions

The History Days input controls how many calendar days the indicator processes.

The default value is 10 days.

A higher value displays more historical sessions, but it also requires more price data and more chart objects.

For normal intraday use, a value between 5 and 20 days is usually sufficient.

Only Monday-to-Friday session dates are processed. Weekend sessions are not drawn.

Refresh rate

The indicator checks active sessions at a regular interval.

The default refresh interval is five seconds.

It also updates when:

  • A new price calculation occurs

  • The chart changes

  • The chart scale or visible area changes

A shorter refresh interval gives faster visual updates but causes MetaTrader to process the session data more often.

Main inputs

General settings

InpHistoryDays

Sets the number of historical calendar days to process.

InpHighLowTimeframe

Sets the timeframe used to calculate each session high and low. The default is M1.

InpRefreshSeconds

Sets the update interval in seconds.

InpShowLabels

Shows or hides exchange names.

InpLabelFontSize

Sets the label text size.

InpFillRectangles

Enables or disables the colored session fills.

InpFillOpacityPercent

Controls the strength of the session fill from 0 to 100.

InpDrawFillBehindCandles

Places the session fill behind the price candles.

InpDrawBordersInForeground

Places session borders in front of the candles.

InpBorderStyle

Sets the border line style.

InpBorderWidth

Sets the border thickness.

Broker-time settings

InpBrokerOffsetMode

Selects automatic current offset, automatic European DST, or manual fixed offset.

InpManualBrokerUTCMinutes

Sets the manual broker UTC offset in minutes.

This value is used when Manual Fixed Offset is selected. It is also used as a fallback if automatic time detection is not available.

Exchange settings

Each exchange has:

  • An enable or disable switch

  • A fill color

  • A border color

This lets you build a simple three-session layout or display all six exchanges.

Suggested setup

For a clean intraday chart, start with the default settings:

  • NYSE enabled

  • London enabled

  • Shanghai enabled

  • All other exchanges disabled

  • M1 high and low calculation

  • 10 history days

  • 22% fill opacity

  • Two-pixel borders

  • Labels enabled

If the chart becomes too busy, reduce the history period or disable the labels.

If the fill is too weak, increase the opacity to approximately 30–35%.

If the fill is too strong, reduce it to approximately 10–15%.

Practical uses

The indicator can help with several types of analysis.

Session range analysis

See the high and low formed during each stock-market session.

Session overlap

Identify periods when two major markets are open at the same time, such as London and New York.

Breakout context

See whether price breaks above or below a completed session range.

Volatility comparison

Compare the size of the Asian, European, and US session ranges.

Intraday support and resistance

Use completed session highs and lows as reference levels for later price action.

Market timing

See which major equity market is active without converting local exchange times manually.

Important notes

The indicator uses regular weekday session schedules.

It does not contain an exchange holiday calendar. It also does not automatically adjust for special early-close days, emergency closures, or temporary exchange schedule changes.

If the chart symbol continues to trade while a stock exchange is closed for a holiday, MetaTrader may still provide price bars during the normal session window. In this case, the indicator can draw a rectangle even though the physical exchange is closed.

Historical accuracy also depends on the price history supplied by your broker. Missing M1 data can prevent a session rectangle from appearing or can produce an incomplete range.

The indicator is designed for visual analysis. It does not provide trading signals, alerts, order execution, or profit guarantees.
Рекомендуем также
Индикатор Торговых Сессий Индикатор Торговых Сессий отображает максимумы и минимумы, а также время начала и окончания азиатских, лондонских и нью-йоркских торговых сессий прямо на вашем графике. Функции: Визуализация основных торговых сессий Подсветка максимумов и минимумов Отображение времени начала и окончания каждой сессии Настраиваемое время сессий Удобство использования и эффективность Настраиваемость: Каждая торговая сессия (Азиатская, Лондонская, Нью-Йоркская) может быть индивидуально нас
FREE
Crow s r v1
Cristobal Hidalgo Soriano
S_R_MT5_V1 Professional Support and Resistance indicator for MetaTrader 5 designed for traders looking for fast, clean and visual key market zones. S_R_MT5_V1 automatically detects important support and resistance levels displaying dynamic zones directly on the chart with a modern and optimized visualization for intraday trading and scalping. Perfect for: Scalping Intraday trading Reversal trading Breakouts Institutional zone confirmation Main Features: Automatic support and resistance detectio
FREE
Market Hours Pro shows Tokyo, London, and New York trading sessions directly on your MT5 chart, including scheduled overlap periods. It’s designed to give you a clear view of global market timing so you can plan trades, spot high-activity periods, and align strategies with standard Forex hours. How It Works Displays scheduled session times visually on your chart. Highlights session overlaps for London/New York and Tokyo/London. Automatically adjusts times for your timezone or broker time. Shows
FREE
Multi Currency Strength Dashboard Mini (FREE) – Currency Strength Meter for MetaTrader 5 Multi Currency Strength Dashboard Mini – это бесплатный индикатор для MetaTrader 5 , который в реальном времени показывает относительную силу 8 основных валют (USD, EUR, GBP, JPY, CHF, CAD, AUD, NZD) в виде понятной и быстрой к чтению панели. Цель: за несколько секунд определить сильные и слабые валюты, чтобы сформировать целевой watchlist (например, выбрать пары, где сильная валюта противостоит слабой). Что
FREE
The Indicator show Daily Pivot Points. It is possible to specify the number of days to display. For forex it doesn't consider the sunday session data. It is possibile to modify the color, style and  width for every level. It is better to use this indicator with timeframe not higher than Н1. 4 Levels of support and resistance with also Intermediate Levels that is possible to hide.
FREE
主要城市的时间。北京时间、东京时间、悉尼时间、惠灵顿时间、纽约时间、法兰克福时间、伦敦时间、迪拜时间。 城市时间可选择开启或者关闭。 点差变色提醒。设置点差提醒点数,例如,设置100点,点差大于100点,文字会变红色。 Time in major cities. Beijing time, Tokyo time, Sydney time, Wellington time, New York time, Frankfurt time, London time, Dubai time. City time can be turned on or off. Dot difference color change reminder. Set the point difference reminder points. For example, set 100 points. If the point difference is greater than 100 points, the text will turn red.
FREE
SESSION SUHUTRADE: Master the Market Hours with Precision Are you tired of missing out on high-probability setups during specific trading sessions? Do you struggle to identify when the Asian, London, or New York markets are truly active and presenting the best opportunities? Introducing SESSION SUHUTRADE , the ultimate MQL5 indicator designed to give you unparalleled clarity over the global trading sessions. This powerful tool automatically detects and highlights the exact market hours for Asia,
FREE
The "Session Time Vertical Lines" indicator displays vertical lines on the chart that mark the beginning and end of major global trading sessions: Sydney, Tokyo, London, and New York . It is designed to help traders visually identify active market hours, overlaps, and potential high-volume periods directly on the price chart. This tool is especially useful for intraday traders who rely on market session timing to plan entries and exits. Inputs / Settings Parameter Name Description DaysToDraw Num
FREE
this free candle stick timer works on all symbol and all timeframe, in dicator help you to see remain time in hours, minutes, seonds until it close, it is simple and easy to use  and very light, it doesn't not consume much RAM, CPU. you can change font size and can change color of the indicator and what time frame you want it to work on, you also can choose to disable it on specifix time frame.
FREE
Smart FVG Stats
- Md Rashidul Hasan
5 (1)
The  Smart FVG Statistics Indicator  is a powerful MetaTrader 5 tool designed to automatically identify, track, and analyze Fair Value Gaps (FVGs) on your charts. Love it? Hate it? Let me know in a review! Feature requests and ideas for new tools are highly appreciated. :) Try "The AUDCAD Trader": https://www.mql5.com/en/market/product/151841 Key Features Advanced  Fair Value Gap  Detection Automatic Identification : Automatically scans for both bullish and bearish FVGs across specified histo
FREE
ZigZag Support and Resistance Levels (v2.0)  — это индикатор для MetaTrader 5, который определяет уровни поддержки и сопротивления на основе опорных точек ZigZag и теперь включает интерактивную панель управления непосредственно на графике. Он группирует близко расположенные уровни в зоны с помощью метода кластеризации, помогая визуализировать области, в которых цена неоднократно реагировала, а также различает пробитые (breakout) уровни и активные (extension) уровни. Основные возможности 1. Опре
FREE
Support And Resistance indicator that can display round levels and zones . It shows them directly on the chart, providing an easy help when you want to set stop-loss or take-profit level, or when you want to see the next market target.   If an asset price is moving down and bounces back up, the level is called support (think: price floor). If an asset price is moving upward and hits a level where it reverses downward, this is called resistance (think: price ceiling).
FREE
Этот маленький инструмент позволяет вам определить счетчик времени в минутах для закрытия ваших позиций в соответствии с количеством минут, которые вы установили. Например, если вы установите значение 30 минут, инструмент закроет каждую открытую позицию через 30 минут после ее открытия. Настройки ACTIVE: активировать инструмент и использовать его для закрытия позиций по истечении определенного количества минут. УПРАВЛЕНИЕ: вы выбираете с помощью символов, управляемых инструментом.
FREE
БЕСПЛАТНО — пробойный канал Donchian и трейлинг-стоп по ATR, который ведёт сделку после пробоя, нарисованные на одном графике. Большинство пробойных индикаторов показывают вход и на этом останавливаются. Самое трудное в следовании за трендом — то, что происходит дальше: где стоит стоп, когда он подтягивается и когда движение закончено. Этот индикатор рисует обе половины системы. === ЧТО ОН РИСУЕТ === - Канал Donchian (верхняя и нижняя границы) по последним N закрытым барам. - Золотые стрелки та
FREE
Trend View is a simple indicator that shows in a text the trend of the current currency in the timeframe you choose. Inputs are: Color: color of the text. Timeframe: timeframe for calculations. Trend can be: UP: bullish trend. DOWN: bearish trend. ---: trend not defined. You can use this indicator to show the main trend of a bigger timeframe helping you to choose your trades. Note: text is draggable.  
FREE
DC Indicator
Lamont Simone Reynecke
The donchian channel indicator might just be the best fit for you Trading in derivative products such as futures, options, CFD's, forex and certificates contains significant risk. These products are not suitable for every investor. Investors could potentially lose all or more than the original investment. If anything, only money equal to personal risk capital should be used and can be lost without jeopardizing financial security or lifestyle. Partially or fully automated trading programs can
FREE
AI London Session Range Indicator automatically draws the London session's opening range as a box on your chart, giving breakout and session traders an instant, objective reference for the high-volatility window that sets the tone for the rest of the trading day. The indicator tracks the exact high and low reached during the configured opening-range window after the London session start, plots it as a shaded box, and keeps it visible for the rest of the session so you can watch for breakouts, re
FREE
Neon Profile
Manuel Fernandez Barranco
XBK Neon Profile MT5 Developed by XBK Systems. XBK Neon Profile is an advanced technical indicator for MetaTrader 5 that combines smoothed trend analysis and a dynamic volume profile within a single chart window. The indicator is designed to provide a clear view of market structure and significant volume levels without cluttering the screen. Key Features Smoothed Trend Bands (Neon Trend Bands) Identifies the current trend direction using a custom smoothing algorithm designed to filter out market
FREE
Cybertrade Keltner Channels - MT5 Created by Chester Keltner, this is a volatility indicator used by technical analysis. It is possible to follow the trend of financial asset prices and generate support and resistance patterns. In addition, envelopes are a way of tracking volatility in order to identify opportunities to buy and sell these assets. It works on periods longer than the period visible on the chart. All values ​​are available in the form of buffers to simplify possible automations.
FREE
(Специальная акция к Новому Году - беЗплатное распространение!) Индикатор показывает реальный 'Масштаб по пунктам на бар' (идентично как при ручном выставлении в Терминале, см.скрин) в правом верхнем углу Графика. Изменение отображаемого значения происходит МГНОВЕННО при любом изменении масштаба высоты/ширины графика! (что очень удобно при планировании скриншотов). в Настройках: смена языка (Русский / Английский), размер шрифта отображаемого текста, коэфициент смещения текстовой метки от угла г
FREE
Easy SMC Trading
Israr Hussain Shah
3.8 (5)
Structure Trend с Auto RR и сканером BOS Версия: 1.0 Обзор Structure Trend с Auto RR — это комплексная торговая система, разработанная для трейдеров, использующих Price Action и Структуру Рынка . Индикатор объединяет сглаженный трендовый фильтр с определением поворотных точек (Swing Points) и сигналами Слома Структуры (Break of Structure — BOS) для генерации торговых сетапов с высокой вероятностью успеха. Отличительной особенностью этого инструмента является Автоматическое управление рисками .
FREE
Данный индикатор отображает только верхнюю и нижнюю границы канала волатильности в стиле Bollinger, без отображения центральной скользящей средней. Его основная цель — предоставить чистый и гибкий волатильностный канал, позволяя сосредоточиться на поведении цены относительно границ канала, сохраняя полный контроль над визуальным оформлением графика. В отличие от классических полос Боллинджера, где центральная скользящая средняя всегда отображается, в данном индикаторе она используется исключител
FREE
SETTINGS Make sure to select Chart shift option in the chart.   (Right click in the chart ---> Properties (dialog box) ----> Select Chart Shift) Kindly rate and comment about the product for upgradation & Support When using candlestick timers, keep in mind that the timing of candlestick patterns can play a crucial role in your trading strategy. For instance, different timeframes (such as 1-minute, 5-minute, hourly, ) can provide varying insights into price movements and trends. Make sure to i
FREE
This Mt5 Indicator Signals when there is two opposite direction bars engulfed by current bar.  has a recent Exponential Moving Average Cross and past bar was oversold/bought Expert Advisor Available in Comments  Free Version Here : https://www.mql5.com/en/market/product/110114?source=Site&nbsp ; Full Alerts for mt5 terminal , phone , email, print to file, print to journal  Buy Signal ( blue line ) Past ema cross ( set at 30 bars back ) Past bar rsi is oversold ( level 40  ) Engulfing bar closes
FREE
Добро пожаловать в наш   паттерн ценовой волны   MT5 --(паттерн ABCD)-- Паттерн ABCD является мощным и широко используемым торговым паттерном в мире технического анализа. Это гармонический ценовой паттерн, который трейдеры используют для определения потенциальных возможностей покупки и продажи на рынке. С помощью паттерна ABCD трейдеры могут предвидеть потенциальное движение цены и принимать обоснованные решения о том, когда открывать и закрывать сделки. Версия советника:   Price Wave EA MT5
FREE
Smc Session Killzone and Breakout The Smc Session Killzone and Breakout indicator automates the institutional session trading model for MetaTrader 5. It draws the Asian, London, and New York session ranges as labelled boxes on the chart, detects when price sweeps beyond the Asian session high or low, and fires a non-repainting entry signal after a Market Structure Shift is confirmed. All signals are based on closed bars and do not repaint. The underlying model follows the sequence that institut
FREE
HammerStar
Arismario Verissimo Neves
3.4 (5)
The HammerStar indicator is designed to search for the Hammer and Shooting Star patterns on charts of any currency pairs. Hammer Downward trend. The lower shadow is not less than 2 and no more than 3 times larger than the body. There is no upper shadow, or it is very short (no more than 10% of the candlestick range). The color of the body in the long game is not important, with the short - white hammer is much stronger than the black one. Confirmation is suggested. Shooting Star Uptrend. The u
FREE
##################################################################### AURUM TRADING SESSIONS AND KILLZONES - РУССКИЙ ##################################################################### --- Краткое описание --- Азиатская, лондонская и нью-йоркская сессии в виде аккуратных боксов диапазона с максимумом, минимумом и уровнем 50%, опциональные киллзоны и живая панель с обратным отсчётом и средним диапазоном сессий. --- Описание --- Aurum Sessions показывает три основные торговые сессии прямо на
FREE
The "Support Resistance Dynamic" indicator is a powerful technical analysis tool for the MetaTrader 5 platform, designed to automatically identify and plot dynamic Support and Resistance zones on price charts. This indicator helps traders easily recognize important price levels, potential reversal points, or breakout areas, thereby enabling more informed trading decisions. 2. Key Features Dynamic S/R Identification : Automatically identifies support and resistance zones based on an advanced Pivo
FREE
ICT Killzones and Liquidity Levels is a clean chart tool that marks the main ICT killzones and key liquidity levels directly on your chart. It is designed for traders who follow Smart Money Concepts and ICT-style price action and want a simple, non-repainting reference on the chart. The indicator draws the Asian, London, New York and London Close killzones as boxes based on the session high and low. A vertical line marks the start of each killzone for the current day, so you can see when each se
FREE
С этим продуктом покупают
Trend Sniper X
Sarvarbek Abduvoxobov
4.9 (40)
Trend Sniper X — это трендовый индикатор для MetaTrader 5, работающий на нескольких таймфреймах, который помогает трейдерам точно и ясно определять направление тренда и потенциальные точки разворота. для MT4: https://www.mql5.com/en/market/product/193245 Информация о цене: Текущая цена является промо-ценой и может измениться по мере выхода предстоящих обновлений и новых функций. Бонусное предложение: Чтобы получить БЕСПЛАТНЫЙ авто-трейд советник Assistant EA для этого индикатора, пожалуйста, на
Smart Trend Trading System — MetaTrader 5 После покупки напишите мне на MQL5, чтобы БЕСПЛАТНО получить Smart Universal Expert Advisor, а также доступ к онлайн-курсу, руководство в формате PDF и доступ к закрытой группе. STTS объединяет направление тренда, сигналы входа и выхода, зоны разворота и важные ценовые уровни прямо на графике. Торгуйте по системе вручную или подключите отдельный совместимый советник для автоматического исполнения с выбранными вами настройками. ОДНА СИСТЕМА. ЧЕТЫРЕ ТОРГОВ
ARIPoint
Temirlan Kdyrkhan
1 (4)
ARIBot is a powerful trading companion designed to generate high-probability entry signals with dynamic TP/SL/DP levels based on volatility. Built-in performance tracking shows win/loss stats, PP1/PP2 hits, and success rates — all updated live. Key Features: Buy/Sell signals with adaptive volatility bands Real-time TP/SL/DP levels based on ATR Built-in MA Filter with optional ATR/StdDev volatility Performance stats panel (Success, Profit/Loss, PP1/PP2) Alerts via popup, sound, push, or email Cus
Zoryk Gold
Reda El Koutbane
5 (15)
Скидка заканчивается через 24 часа — следующая цена $ 69 ZORYK — продвинутая сигнальная система для XAUUSD в MetaTrader 5 Вам знакомо это чувство. Вы долго анализируете золото. Ждёте подходящего момента для входа. Наконец открываете сделку — и цена сразу начинает двигаться против вас. Вы закрываете позицию слишком рано, передвигаете Stop Loss или сомневаетесь всего несколько секунд. После этого рынок достигает именно той цели, которую вы ожидали изначально, но уже без вас. Проблема не всегда за
SuperScalp Pro
Van Minh Nguyen
4.66 (35)
SuperScalp Pro - Professional Multi-Layer Confluence Scalping System SuperScalp Pro — это продвинутый индикатор для скальпинга, который улучшает классический Supertrend с помощью нескольких интеллектуальных фильтров подтверждения. Он помогает определять торговые возможности Buy/Sell с более высокой вероятностью, значительно сокращая количество ложных сигналов. Чёткие стрелки Buy и Sell отображаются непосредственно на графике, а уровни Stop Loss и Take Profit на основе ATR автоматически рассчитыв
Gann Made Easy   - это профессиональная, но при этом очень простая в применении Форекс система, основанная на лучших принципах торговли по методам господина У.Д. Ганна. Индикатор дает точные BUY/SELL сигналы, включающие в себя уровни Stop Loss и Take Profit. ПОЖАЛУЙСТА, СВЯЖИТЕСЬ СО МНОЙ ПОСЛЕ ПОКУПКИ, ЧТОБЫ ПОЛУЧИТЬ ТОРГОВЫЕ ИНСТРУКЦИИ И ОТЛИЧНЫЕ ДОПОЛНИТЕЛЬНЫЕ ИНДИКАТОРЫ БЕСПЛАТНО! Вероятно вы уже не раз слышали о торговли по методам Ганна. Как правило теория Ганна отпугивает от себя не только
SMC Intraday Formula
VividMind Digital Solutions
5 (26)
Давайте сначала будем честны. Ни один индикатор сам по себе не сделает вас прибыльным. Если кто-то говорит вам обратное — он продаёт вам мечту. Любой индикатор, который показывает идеальные стрелки покупки/продажи, можно сделать безупречным — просто увеличьте нужный участок истории и сделайте скриншот успешных сделок. Мы так делать не будем. SMC Intraday Formula — это инструмент. Он считывает структуру рынка за вас, определяет зоны с наивысшей вероятностью движения цены и точно показывает, как
GoldenX Entry MT5
VividMind Digital Solutions
5 (16)
GoldenX Entry — это индикатор для MT5 с адаптивным алгоритмом Smart Entry Trend, системой оценки сигналов, детектором рыночных режимов и фильтром волатильности. Каждый сигнал включает рассчитанный уровень входа, три уровня Take-Profit (TP1, TP2, TP3) и уровень Stop-Loss. Он построен на нескольких аналитических слоях, предназначенных для адаптации к различным рыночным условиям, объединяя многоуровневую аналитическую систему со встроенным оптимизатором и системой статистического отслеживания. Инди
Новый король в городе — Индикатор + управление ордерами (TP1 + TP2 + TP3) + опциональный Telegram-сигнал-сендер ВКЛЮЧЁН (БЕСПЛАТНО) (ПОЛНОЦЕННАЯ ТОРГОВАЯ И СИГНАЛЬНАЯ СИСТЕМА) Gold Slayer EA Этот индикатор включает в себя продвинутую стратегию, торговую систему с настраиваемым управлением ордерами и систему mean reversion, которая сочетает расширения Envelope и поддерживается несколькими интеллектуальными фильтрами подтверждения, такими как RSI, для поиска высоковероятных точек разворота с сигн
Neuro Poseidon - новый индикатор от Дарьи Резуевой. Он сочетает точные торговые сигналы с адаптивными уровнями TP/SL , в результате создавая максимально выгодные сделки! TO SWITCH TO   ENG   PLEASE CHOOSE IT IN THE UPPER-RIGHT CORNER OF THE WEBSITE Напишите мне и получите  Neuro Poseidon Assistant  в подарок для автоматизации вашей торговли! Что отличает его от других индикаторов? 1. Доказанная прибыльность на всех активах и таймфреймах 2. На графике присутствуют только подтвержденные сигналы н
Auto Optimized SpeedAngle — это система векторизации импульса институционального уровня, которая исключает подгонку под исторические данные (curve-fitting) за счет непрерывной форвард-оптимизации (Walk-Forward Optimization, WFO). Вместо того чтобы полагаться на статические входные параметры, которые теряют эффективность при смене рыночных режимов, индикатор динамически перекалибрует свои настройки, используя валидацию на вневыборочных данных (Out-of-Sample, OOS). Это гарантирует, что отображаемы
Entry Points Pro — топ-1 индикатор по количеству отзывов (600 отзывов и 31 000 скачиваний обеих версий). Индикатор даёт самые перспективные точки входа в сделки без перерисовки на любых инструментах. Индикатор покажет заранее стрелкой точку входа в сделку, укажет цену входа и нарисует на графике уровень входа и стопа, а так же рассчитает рабочий лот под твой депозит и риск, а панель статистики поможет выбрать самый перспективный инструмент и таймфрейм .  Тебе остаётся поставить отложенный ордер
FiboSniper Pro – Multi-Filter Fibonacci System with Auto SL/TP and Control Panel FiboSniper Pro — это технический индикатор, который объединяет динамические Fibonacci Envelopes с несколькими фильтрами подтверждения для формирования отборных сигналов Buy и Sell. Уровни Fibonacci рассчитываются на основе Moving Average и ATR, а затем фильтруются с помощью ADX, EMA, RSI, ATR, Volume, Time и структуры свечи. Индикатор отображает на графике автоматические уровни Stop Loss и Take Profit на основе ATR,
Welcome to ENTRY IN THE ZONE AND SMC MULTI TIMEFRAME SPECIAL BENEFIT / FOR OUR MQL5 CUSTOMERS FREE ACCESS TO THE NEW TOOL  — COMING SOON — Learn more on our official website  : https://www.fableedge.net Entry In The Zone and SMC Multi Timeframe is a real-time market analysis tool based on Smart Money Concepts (SMC), designed to analyze market structure, price direction, and key trading zones. It supports both Single-Timeframe Analysis and Multi-Timeframe Analysis, providing a clearer view of the
Unix Scalper — MetaTrader 5 После покупки напишите мне на MQL5, чтобы БЕСПЛАТНО получить Smart Universal Expert Advisor, а также доступ к онлайн-курсу, руководство в формате PDF и доступ к закрытой группе. Найдите торговую ситуацию. Оцените план. Выберите способ торговли. UNIX Scalper объединяет анализ рынка, решения BUY/SELL/WAIT и уровни Entry, Stop Loss, TP1 и TP2 в одной удобной панели. УВИДЬТЕ СИГНАЛ И ТОРГОВЫЙ ПЛАН • Понятные решения: BUY, SELL или WAIT. • Определённые уровни: Entry, Stop
M1 SNIPER   — это простая в использовании торговая система. Это стрелочный индикатор, разработанный для тайм фрейма M1. Индикатор можно использовать как отдельную систему для скальпинга на тайм фрейме M1, а также как часть вашей существующей торговой системы. Хотя эта торговая система была разработана специально для торговли на M1, ее можно использовать и с другими тайм фреймами. Первоначально я разработал этот метод для торговли XAUUSD и BTCUSD. Но я считаю этот метод полезным и для торговли на
Adaptive Price Action Engine Купи индикатор — получи советник (EA) к нему бесплатно Самооптимизирующийся мульти-таймфреймовый анализ тренда и свечных моделей Рынок постоянно меняется — и не каждая модель Price Action имеет одинаковую ценность в разных рыночных режимах. Adaptive Price Action Engine создан для адаптации к изменяющимся рыночным условиям, объединяя трендовую структуру, мульти-таймфреймовый анализ, свечные модели и статистическую оптимизацию в единой аналитической системе. Два адапти
Gold Entry Sniper – Профессиональная Мульти-Таймфрейм ATR Панель для Скальпинга и Свинг-Трейдинга на Золоте Gold Entry Sniper — это передовой индикатор для MetaTrader 5, разработанный для точных сигналов на покупку/продажу по XAUUSD и другим инструментам. Основан на логике ATR Trailing Stop и мульти-таймфрейм анализе , этот инструмент идеально подходит как для скальперов, так и для среднесрочных трейдеров, обеспечивая чёткие точки входа с высокой вероятностью . Основные возможности и преимуществ
Индикатор Tokyo Indicator обеспечивает наглядное представление о направлении тренда, потенциальных торговых сигналах и текущей рыночной ситуации. Его ступенчатая линия тренда с цветовой индикацией позволяет различать «бычьи» фазы (выделены синим цветом) и «медвежьи» фазы (выделены пурпурным цветом). Соответствующие стрелки указывают на возможные точки входа в рынок (покупку или продажу) при смене тренда. Встроенная информационная панель объединяет данные о текущем сигнале, рыночном настроении,
Scalper Vault   — это профессиональная торговая система, которая дает вам все необходимое для успешного скальпинга. Этот индикатор представляет собой полную торговую систему, которую могут использовать трейдеры форекс и бинарных опционов. Рекомендуемый тайм фрейм М5. Система дает точные стрелочные сигналы в направлении тренда. Она также предоставляет вам сигналы выхода и рассчитывает рыночные уровни Ганна. Индикатор дает все типы оповещений, включая PUSH-уведомления. Пожалуйста, напишите мне пос
FX Trend NG: Следующее поколение интеллектуального анализа трендов на разных рынках Обзор FX Trend NG — это профессиональный инструмент анализа трендов и мониторинга рынка с поддержкой нескольких таймфреймов. Он позволяет за секунды получить полное структурное понимание текущего состояния рынка. Вместо переключения между десятками графиков вы мгновенно видите, какие инструменты находятся в тренде, где импульс ослабевает и где наблюдается сильная синхронизация между таймфреймами. Специальное пр
FX Power: Анализируйте силу валют для более эффективной торговли Обзор FX Power — это ваш незаменимый инструмент для понимания реальной силы валют и золота в любых рыночных условиях. Определяя сильные валюты для покупки и слабые для продажи, FX Power упрощает принятие торговых решений и выявляет высоковероятные возможности. Независимо от того, хотите ли вы следовать за трендами или предсказывать развороты с использованием экстремальных значений дельты, этот инструмент идеально адаптируется под
Smart Price Action Concepts — MetaTrader 5 После покупки напишите мне на MQL5, чтобы БЕСПЛАТНО получить Smart Universal Expert Advisor, а также доступ к онлайн-курсу, руководство в формате PDF и доступ к закрытой группе. Изучайте структуру. Определяйте зоны. Создавайте торговый план. Объедините Smart Money Concepts (SMC), анализ в стиле ICT и Price Action на одном упорядоченном графике. Определяйте структуру рынка, ордер-блоки, ориентиры ликвидности и дисбалансы, а затем выбирайте отображаемые э
Power Candles V3 — самооптимизирующийся индикатор силы Power Candles V3 преобразует силу валюты и инструмента в готовый к использованию торговый план на каждом графике, к которому он прикреплен. Вместо того, чтобы просто раскрашивать свечи, он выполняет автоматическую оптимизацию в режиме реального времени в фоновом режиме и предоставляет вам оптимальные значения Stop Loss, Take Profit и порог сигнала для выбранного вами символа. Один клик — и все готово для реальной торговли: на графике появляю
M1 Quantum MT5
Hamed Dehgani
4.2 (10)
Торговые сигналы в реальном времени с использованием M1 Quantum: Сигнал  (Сделка выполнена автоматически с помощью Quantum Trade Assistant , бесплатно включённого в этот продукт.) Последние новости : Выпущена версия 1.64. Теперь для всех сделок Stop Loss размещается за соответствующими зонами поддержки/сопротивления. Функция Smart Close также была улучшена для повышения производительности EA в этой версии. С 9 августа live-сигнал работает на версии 1.64. План цен: Текущая цена: $169 (Предложени
Market Structure Order Block Dashboard MT5 — это индикатор MT5, разработанный для трейдеров, которые хотят читать рыночную структуру и основные зоны реакции цены прямо на графике. Он объединяет BOS, ChoCH, Order Blocks, Fair Value Gaps (FVG), Ликвидность, Kill Zones, Volume Profile и компактную панель для быстрого анализа. Индикатор предназначен для трейдеров, использующих рыночную структуру, концепции ICT и Smart Money как основу для принятия решений. Он помогает выявлять продолжения тренда, во
Atomic Analyst — MetaTrader 5 После покупки напишите мне на MQL5, чтобы БЕСПЛАТНО получить Smart Universal Expert Advisor, а также доступ к онлайн-курсу, руководство в формате PDF и доступ к закрытой группе. Atomic Analyst объединяет анализ ценового движения, направление тренда, сигналы входа и выхода, уровни Stop Loss и несколько уровней Take Profit прямо на графике. УВИДЬТЕ СИГНАЛ. ОЦЕНИТЕ ТОРГОВУЮ СИТУАЦИЮ. Atomic Analyst представляет результаты анализа в понятном визуальном виде: • Стрелки п
Crystal Heikin Ashi Signals—Professional Trend & Signal Detection Indicator Advanced Heikin Ashi Visualization with Intelligent Signal System for Manual & Automated Trading Final Price: $149 ---------> Price goes up $10 after every 10 sales . Limited slots available — act fast . Overview User Guide PDF Crystal Heikin Ashi Signals is a professional-grade MetaTrader 5 indicator that combines pure Heikin Ashi candle visualization with an advanced momentum-shift detection system. Designed for both m
Каждый покупатель этого индикатора получает дополнительно Бесплатно: Авторскую утилиту "Bomber Utility", которая автоматически сопровождает каждю торговую операцию, устанавливает уровни Стоп Лосс и Тейк профит и закрывает сделки согласно правилам этой стратегии, Сет-файлы для настройки этого индикатора на различных активах, Сет-файлы для настройки Bomber Utility в режимы: "Минимум Риска", "Взвешенный Риск" и "Стратегия Выжидания", Пошаговый видео-мануал, который поможет вам быстро установить, н
Quant Direction — это инструмент трехмерного анализа рынка. Он обеспечивает полностью объективный, основанный на алгоритмах анализ рынка, одновременно вычисляя точные процентные отклонения по нескольким параметрам. Разработанный с использованием передовых инструментов моделирования на основе искусственного интеллекта и тщательно протестированный, алгоритм предназначен для интерпретации рынка с уникальной точностью. Он может анализировать любую валютную пару или финансовый инструмент на вашей пла
Другие продукты этого автора
Смотрите раздел "Что нового" для обзора версии 1.3. //+---------------------------------------------------------------------------------------------------------------+ Я создал этот индикатор, потому что мне не хватало чего-то подобного для моей собственной стратегии, и я не нашел ничего подходящего. Лучше всего он работает внутри дня, но не стесняйтесь экспериментировать с ним. Обзор Этот индикатор разработан для того, чтобы помочь определить ключевые точки разворота на рынке, анализируя цен
FREE
Динамический профиль объема/дельта Профиль объема/дельты в выбранном диапазоне отображает распределение объема и расчетную дельту в пределах заданного пользователем диапазона графика. Переместите или измените размер прямоугольника выделения для анализа другого периода. Индикатор отображает профиль объема, положительную и отрицательную дельту, точку контроля (POC) и уровни минимума и максимума зоны стоимости (VVL и VVH). Профили могут быть рассчитаны на основе тиков котировок или баров более ни
FREE
Фильтр:
Нет отзывов
Ответ на отзыв