Dynamic Global Exchange Sessions

Global Exchange Sessions

Global Exchange Sessions is an MQL5 indicator that marks the regular trading hours of the world’s main stock exchanges directly on your chart.

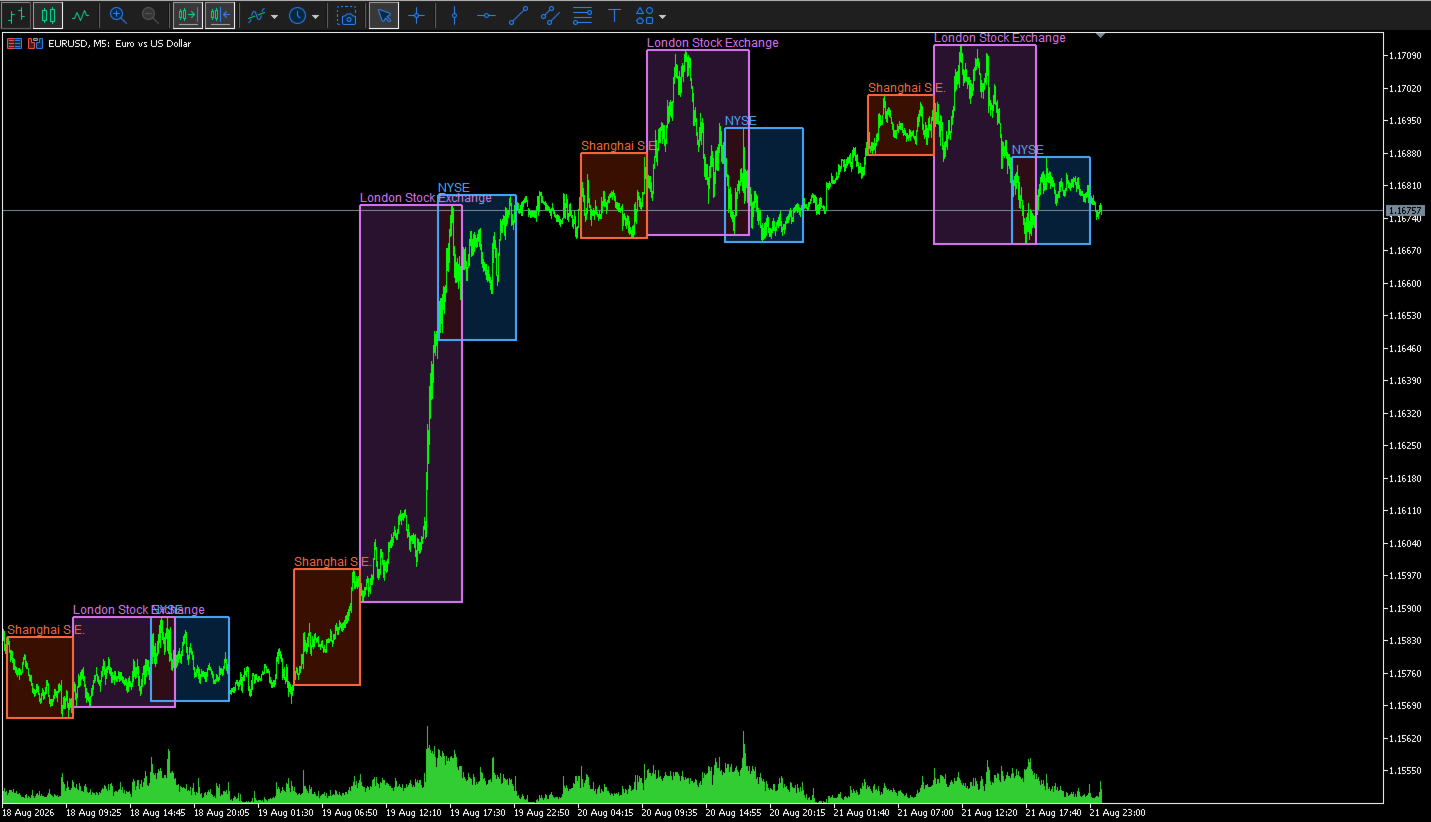
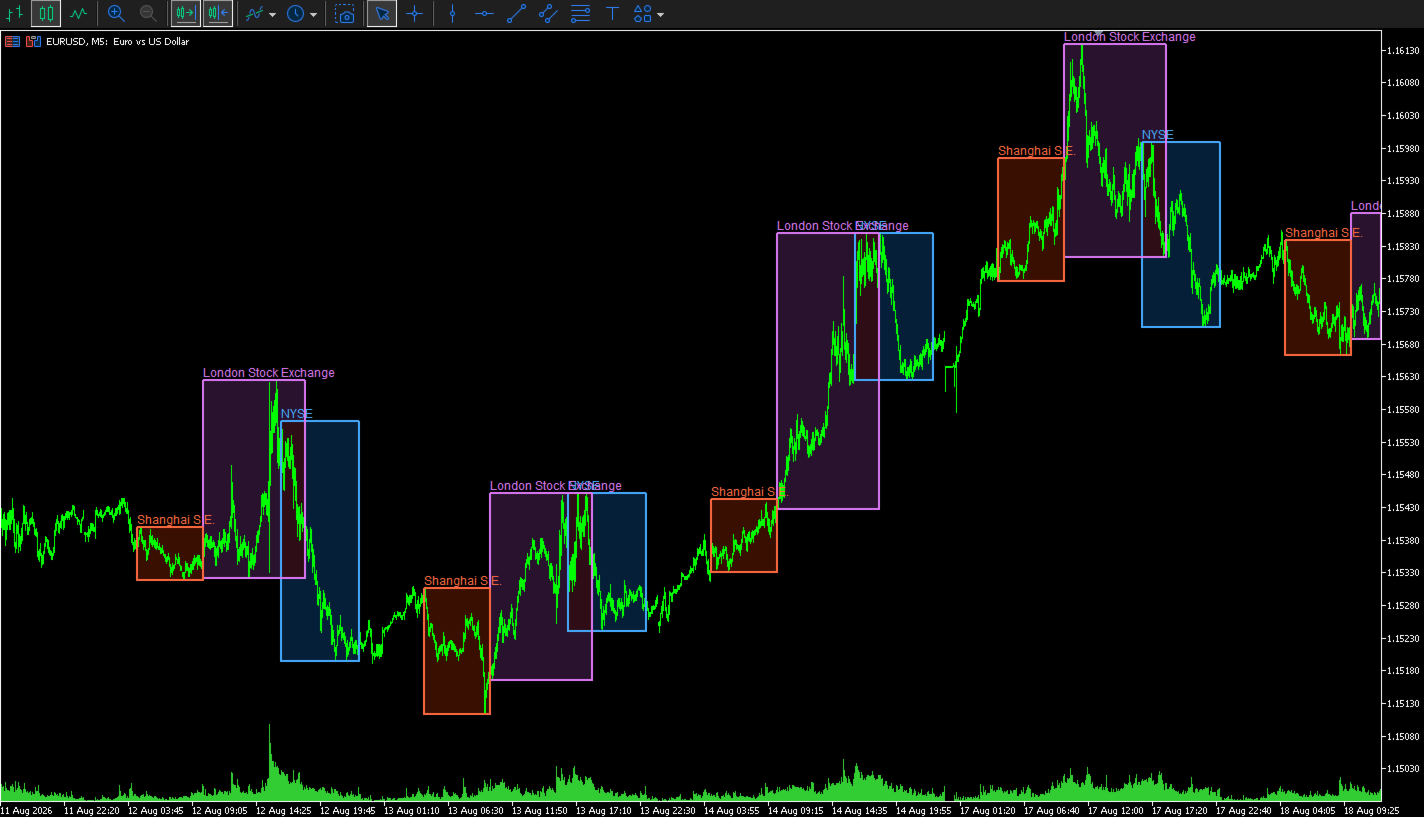
Each session is shown as a colored rectangle. The rectangle starts at the official market open and ends at the official market close. Its upper and lower edges follow the session high and low as new prices arrive.

This makes it easy to see when major equity markets are active, where each session formed its range, and how price reacted when sessions overlapped.

Included exchanges

The indicator supports six stock exchanges:

  • New York Stock Exchange — NYSE

  • London Stock Exchange — LSE

  • Shanghai Stock Exchange — SSE

  • Tokyo Stock Exchange — TSE

  • Hong Kong Stock Exchange — HKEX

  • Euronext

Each exchange can be enabled or disabled separately.

By default, the indicator displays:

  • NYSE

  • London Stock Exchange

  • Shanghai Stock Exchange

Tokyo, Hong Kong, and Euronext are included but disabled by default. You can enable them from the indicator inputs at any time.

Regular session hours

The indicator uses the following regular cash-market hours:

  • NYSE: 09:30–16:00 New York time

  • London Stock Exchange: 08:00–16:30 London time

  • Shanghai Stock Exchange: 09:30–15:00 Shanghai time

  • Tokyo Stock Exchange: 09:00–15:30 Tokyo time

  • Hong Kong Stock Exchange: 09:30–16:00 Hong Kong time

  • Euronext: 09:00–17:30 Central European time

Automatic broker-time conversion

You do not need to calculate the difference between exchange time and broker time.

The indicator reads the broker’s current server time and compares it with GMT. It then converts each exchange session into the time used by your chart.

This is useful because MetaTrader brokers do not all use the same server time. One broker may use UTC, another may use UTC+2, and another may change its server offset during daylight saving time.

Three broker-time modes are available.

Auto Current Offset

This is the default mode.

The indicator calculates the current broker offset from:

TimeTradeServer() - TimeGMT()

The detected offset is used for all displayed sessions.

This mode is suitable when you mainly use the current day or when your broker keeps a fixed UTC offset.

Auto European DST

This mode detects the current broker offset and applies a European daylight-saving schedule to historical dates.

It is useful for brokers that change their server time according to European summer-time rules.

Use this mode when older session rectangles shift by one hour after a daylight-saving change.

Manual Fixed Offset

This mode lets you enter the broker’s UTC offset in minutes.

Examples:

  • UTC: 0

  • UTC+1: 60

  • UTC+2: 120

  • UTC+3: 180

  • UTC-5: -300

This mode is useful when the automatic result does not match your broker or when you use a broker with a fixed server offset.

Exchange daylight saving time

The indicator calculates daylight saving time separately for the exchanges that use it.

It includes:

  • US daylight saving time for NYSE

  • UK daylight saving time for the London Stock Exchange

  • European daylight saving time for Euronext

Shanghai, Tokyo, and Hong Kong use fixed UTC offsets because these locations do not currently change their clocks during the year.

This separate calculation is important during the weeks when the United States and Europe change their clocks on different dates.

Dynamic session highs and lows

The rectangle is not based on a fixed price height.

When a session starts, the indicator reads the price bars inside that session. It finds the highest high and the lowest low, then uses those values as the top and bottom of the rectangle.

While the session is active:

  • A new session high moves the upper edge higher.

  • A new session low moves the lower edge lower.

  • The rectangle keeps its official opening and closing times.

  • The range updates as new price data arrives.

After the session closes, the completed high and low remain visible for the selected history period.

The default calculation timeframe is M1. This gives the indicator a more precise session range, even when it is attached to a higher chart timeframe.

You can change the calculation timeframe if you want to reduce the amount of historical data that MetaTrader must load.

Transparent-style session fills

Each session uses two separate rectangles:

  • A soft background fill

  • A clear foreground border

The fill color is blended with the current chart background. This produces a transparent-style result on both dark and light chart themes.

The default fill opacity is 22%.

You can change the opacity from 0 to 100:

  • 0 makes the fill fully hidden.

  • Lower values create a softer session area.

  • Higher values make the session color stronger.

  • 100 uses the full selected fill color.

The border is not affected by the fill opacity. It remains clear so that the session range is still easy to identify.

By default, fills are drawn behind the candles and borders are drawn in front of the candles.

Session colors

Every exchange has separate fill and border color settings.

The default colors are:

  • NYSE: blue

  • London: purple

  • Shanghai: orange-red

  • Tokyo: yellow

  • Hong Kong: green

  • Euronext: cyan

You can change each color from the indicator inputs.

The fill and border colors do not need to match. For example, you can use a dark blue fill with a bright blue border, or turn the fill off and display only the session outline.

Labels

The indicator can place the exchange name at the upper-left area of each session rectangle.

Labels use the session border color, which helps connect the name with its rectangle.

You can:

  • Show or hide labels

  • Change the label font size

  • Change the label color by changing the session border color

Labels are enabled by default.

Border settings

The session border can be adjusted to match your chart style.

Available settings include:

  • Border color for each exchange

  • Border width

  • Border line style

  • Foreground or background drawing

The default border width is two pixels, which keeps the session outline visible without covering too much price information.

Historical sessions

The History Days input controls how many calendar days the indicator processes.

The default value is 10 days.

A higher value displays more historical sessions, but it also requires more price data and more chart objects.

For normal intraday use, a value between 5 and 20 days is usually sufficient.

Only Monday-to-Friday session dates are processed. Weekend sessions are not drawn.

Refresh rate

The indicator checks active sessions at a regular interval.

The default refresh interval is five seconds.

It also updates when:

  • A new price calculation occurs

  • The chart changes

  • The chart scale or visible area changes

A shorter refresh interval gives faster visual updates but causes MetaTrader to process the session data more often.

Main inputs

General settings

InpHistoryDays

Sets the number of historical calendar days to process.

InpHighLowTimeframe

Sets the timeframe used to calculate each session high and low. The default is M1.

InpRefreshSeconds

Sets the update interval in seconds.

InpShowLabels

Shows or hides exchange names.

InpLabelFontSize

Sets the label text size.

InpFillRectangles

Enables or disables the colored session fills.

InpFillOpacityPercent

Controls the strength of the session fill from 0 to 100.

InpDrawFillBehindCandles

Places the session fill behind the price candles.

InpDrawBordersInForeground

Places session borders in front of the candles.

InpBorderStyle

Sets the border line style.

InpBorderWidth

Sets the border thickness.

Broker-time settings

InpBrokerOffsetMode

Selects automatic current offset, automatic European DST, or manual fixed offset.

InpManualBrokerUTCMinutes

Sets the manual broker UTC offset in minutes.

This value is used when Manual Fixed Offset is selected. It is also used as a fallback if automatic time detection is not available.

Exchange settings

Each exchange has:

  • An enable or disable switch

  • A fill color

  • A border color

This lets you build a simple three-session layout or display all six exchanges.

Suggested setup

For a clean intraday chart, start with the default settings:

  • NYSE enabled

  • London enabled

  • Shanghai enabled

  • All other exchanges disabled

  • M1 high and low calculation

  • 10 history days

  • 22% fill opacity

  • Two-pixel borders

  • Labels enabled

If the chart becomes too busy, reduce the history period or disable the labels.

If the fill is too weak, increase the opacity to approximately 30–35%.

If the fill is too strong, reduce it to approximately 10–15%.

Practical uses

The indicator can help with several types of analysis.

Session range analysis

See the high and low formed during each stock-market session.

Session overlap

Identify periods when two major markets are open at the same time, such as London and New York.

Breakout context

See whether price breaks above or below a completed session range.

Volatility comparison

Compare the size of the Asian, European, and US session ranges.

Intraday support and resistance

Use completed session highs and lows as reference levels for later price action.

Market timing

See which major equity market is active without converting local exchange times manually.

Important notes

The indicator uses regular weekday session schedules.

It does not contain an exchange holiday calendar. It also does not automatically adjust for special early-close days, emergency closures, or temporary exchange schedule changes.

If the chart symbol continues to trade while a stock exchange is closed for a holiday, MetaTrader may still provide price bars during the normal session window. In this case, the indicator can draw a rectangle even though the physical exchange is closed.

Historical accuracy also depends on the price history supplied by your broker. Missing M1 data can prevent a session rectangle from appearing or can produce an incomplete range.

The indicator is designed for visual analysis. It does not provide trading signals, alerts, order execution, or profit guarantees.
Produits recommandés
Trading Session MT5
Kevin Schneider
3 (1)
Indicateur de Sessions de Trading L'Indicateur de Sessions de Trading visualise les points hauts et bas ainsi que les heures de début et de fin des sessions de trading asiatique, de Londres et de New York directement sur votre graphique. Fonctionnalités : Visualisation des principales sessions de trading Mise en évidence des points hauts et bas Affichage des heures de début et de fin de chaque session Heures des sessions personnalisables Facile à utiliser et efficace Personnalisabilité : Chaque
FREE
Crow s r v1
Cristobal Hidalgo Soriano
S_R_MT5_V1 Professional Support and Resistance indicator for MetaTrader 5 designed for traders looking for fast, clean and visual key market zones. S_R_MT5_V1 automatically detects important support and resistance levels displaying dynamic zones directly on the chart with a modern and optimized visualization for intraday trading and scalping. Perfect for: Scalping Intraday trading Reversal trading Breakouts Institutional zone confirmation Main Features: Automatic support and resistance detectio
FREE
Market Hours Pro
Musa Terrance Khosa
Market Hours Pro shows Tokyo, London, and New York trading sessions directly on your MT5 chart, including scheduled overlap periods. It’s designed to give you a clear view of global market timing so you can plan trades, spot high-activity periods, and align strategies with standard Forex hours. How It Works Displays scheduled session times visually on your chart. Highlights session overlaps for London/New York and Tokyo/London. Automatically adjusts times for your timezone or broker time. Shows
FREE
Multi Currency Strength Dashboard Mini (FREE) – Currency Strength Meter for MetaTrader 5 Multi Currency Strength Dashboard Mini est un indicateur gratuit pour MetaTrader 5 qui affiche en temps réel la force relative des 8 devises majeures (USD, EUR, GBP, JPY, CHF, CAD, AUD, NZD) sous forme de tableau de bord clair et rapide à lire. Objectif : repérer en quelques secondes les devises fortes et faibles afin d'orienter votre watchlist (par exemple, sélectionner des paires où une devise forte fait f
FREE
Pivot Points Daily
Davide Zunino
4.8 (5)
The Indicator show Daily Pivot Points. It is possible to specify the number of days to display. For forex it doesn't consider the sunday session data. It is possibile to modify the color, style and  width for every level. It is better to use this indicator with timeframe not higher than Н1. 4 Levels of support and resistance with also Intermediate Levels that is possible to hide.
FREE
主要城市的时间。北京时间、东京时间、悉尼时间、惠灵顿时间、纽约时间、法兰克福时间、伦敦时间、迪拜时间。 城市时间可选择开启或者关闭。 点差变色提醒。设置点差提醒点数,例如,设置100点,点差大于100点,文字会变红色。 Time in major cities. Beijing time, Tokyo time, Sydney time, Wellington time, New York time, Frankfurt time, London time, Dubai time. City time can be turned on or off. Dot difference color change reminder. Set the point difference reminder points. For example, set 100 points. If the point difference is greater than 100 points, the text will turn red.
FREE
SESSION SUHUTRADE: Master the Market Hours with Precision Are you tired of missing out on high-probability setups during specific trading sessions? Do you struggle to identify when the Asian, London, or New York markets are truly active and presenting the best opportunities? Introducing SESSION SUHUTRADE , the ultimate MQL5 indicator designed to give you unparalleled clarity over the global trading sessions. This powerful tool automatically detects and highlights the exact market hours for Asia,
FREE
The "Session Time Vertical Lines" indicator displays vertical lines on the chart that mark the beginning and end of major global trading sessions: Sydney, Tokyo, London, and New York . It is designed to help traders visually identify active market hours, overlaps, and potential high-volume periods directly on the price chart. This tool is especially useful for intraday traders who rely on market session timing to plan entries and exits. Inputs / Settings Parameter Name Description DaysToDraw Num
FREE
this free candle stick timer works on all symbol and all timeframe, in dicator help you to see remain time in hours, minutes, seonds until it close, it is simple and easy to use  and very light, it doesn't not consume much RAM, CPU. you can change font size and can change color of the indicator and what time frame you want it to work on, you also can choose to disable it on specifix time frame.
FREE
Smart FVG Stats
- Md Rashidul Hasan
5 (1)
The  Smart FVG Statistics Indicator  is a powerful MetaTrader 5 tool designed to automatically identify, track, and analyze Fair Value Gaps (FVGs) on your charts. Love it? Hate it? Let me know in a review! Feature requests and ideas for new tools are highly appreciated. :) Try "The AUDCAD Trader": https://www.mql5.com/en/market/product/151841 Key Features Advanced  Fair Value Gap  Detection Automatic Identification : Automatically scans for both bullish and bearish FVGs across specified histo
FREE
ZigZag Support and Resistance Levels
Tshidiso Ephraim Mpakanyane
2 (1)
ZigZag Support and Resistance Levels (v2.0)  est un indicateur pour MetaTrader 5 qui identifie les niveaux de support et de résistance à partir des points pivots du ZigZag, avec désormais un panneau de contrôle interactif directement sur le graphique. Il regroupe les niveaux proches en zones à l’aide d’une méthode de clustering afin de faciliter la visualisation des zones où le prix a réagi à plusieurs reprises, et distingue les niveaux cassés (breakout) des niveaux actifs (extension). Principa
FREE
Support And Resistance indicator that can display round levels and zones . It shows them directly on the chart, providing an easy help when you want to set stop-loss or take-profit level, or when you want to see the next market target.   If an asset price is moving down and bounces back up, the level is called support (think: price floor). If an asset price is moving upward and hits a level where it reverses downward, this is called resistance (think: price ceiling).
FREE
This Small tool allows you to define a time counter in minutes for the closing of your positions according to the number of minutes you have set. For example if you set it to 30 Min, the tool will close each open position after 30 minutes from its opening. The settings ACTIVE: It is to activate the tool and use it to close your positions after the number of minutes defined. MANAGE: you to choose with the symbols managed by the tool. Choose "ALL CURENCY" if you want the system to apply to
FREE
GRATUIT — le canal de cassure Donchian et le stop suiveur basé sur l'ATR qui gère la position après la cassure, tracés sur un même graphique. La plupart des indicateurs de cassure montrent l'entrée et s'arrêtent là. Le plus difficile dans le suivi de tendance, c'est ce qui vient ensuite : où placer le stop, quand le remonter, et quand le mouvement est terminé. Cet indicateur trace les deux moitiés du système. === CE QU'IL TRACE === - Le canal Donchian (supérieur et inférieur) sur les N dernière
FREE
Trend View
Emanuele Cartelli
Trend View is a simple indicator that shows in a text the trend of the current currency in the timeframe you choose. Inputs are: Color: color of the text. Timeframe: timeframe for calculations. Trend can be: UP: bullish trend. DOWN: bearish trend. ---: trend not defined. You can use this indicator to show the main trend of a bigger timeframe helping you to choose your trades. Note: text is draggable.  
FREE
DC Indicator
Lamont Simone Reynecke
The donchian channel indicator might just be the best fit for you Trading in derivative products such as futures, options, CFD's, forex and certificates contains significant risk. These products are not suitable for every investor. Investors could potentially lose all or more than the original investment. If anything, only money equal to personal risk capital should be used and can be lost without jeopardizing financial security or lifestyle. Partially or fully automated trading programs can
FREE
AI London Session Range Indicator automatically draws the London session's opening range as a box on your chart, giving breakout and session traders an instant, objective reference for the high-volatility window that sets the tone for the rest of the trading day. The indicator tracks the exact high and low reached during the configured opening-range window after the London session start, plots it as a shaded box, and keeps it visible for the rest of the session so you can watch for breakouts, re
FREE
Neon Profile
Manuel Fernandez Barranco
XBK Neon Profile MT5 Developed by XBK Systems. XBK Neon Profile is an advanced technical indicator for MetaTrader 5 that combines smoothed trend analysis and a dynamic volume profile within a single chart window. The indicator is designed to provide a clear view of market structure and significant volume levels without cluttering the screen. Key Features Smoothed Trend Bands (Neon Trend Bands) Identifies the current trend direction using a custom smoothing algorithm designed to filter out market
FREE
Cybertrade Keltner Channels
Emanuel Andriato
4.67 (6)
Cybertrade Keltner Channels - MT5 Created by Chester Keltner, this is a volatility indicator used by technical analysis. It is possible to follow the trend of financial asset prices and generate support and resistance patterns. In addition, envelopes are a way of tracking volatility in order to identify opportunities to buy and sell these assets. It works on periods longer than the period visible on the chart. All values ​​are available in the form of buffers to simplify possible automations.
FREE
(Special New Year promotion - free price!) The indicator displays the actual 'Scale in points per bar' (identical to the manual setting in the Terminal, see screenshot) in the upper right corner of the chart. The displayed value changes INSTANTLY whenever the chart scale is changed! (This is very convenient when planning screenshots). In Settings: Change language (Russian/English), font size of the displayed text, text label offset coefficient from the graph corner, equally in X and Y directi
FREE
Easy SMC Trading
Israr Hussain Shah
3.8 (5)
Analyse de Tendance Structurelle avec RR Auto et Scanner BOS Version : 1.0 Présentation L'analyse de Tendance Structurelle avec RR Auto est un système de trading complet conçu pour les traders qui s'appuient sur l'analyse de l'action des prix et de la structure du marché. Elle combine un filtre de tendance lissé avec la détection des points de swing et les signaux de cassure de structure (BOS) afin de générer des configurations de trading à forte probabilité. La caractéristique phare de cet
FREE
Forex17 Bollinger Channel
Robinson Alves Lemos
5 (1)
Cet indicateur affiche uniquement les bandes supérieure et inférieure d’un canal de volatilité de type Bollinger, sans tracer la moyenne mobile centrale. Son objectif principal est de fournir une enveloppe de volatilité claire et flexible, permettant à l’utilisateur de se concentrer sur le comportement du prix par rapport aux limites du canal, tout en conservant un contrôle total sur l’esthétique et l’organisation du graphique. Contrairement aux bandes de Bollinger classiques, où la moyenne mobi
FREE
Candle Timer Simple
Jithin Sajan Sajan
5 (1)
SETTINGS Make sure to select Chart shift option in the chart.   (Right click in the chart ---> Properties (dialog box) ----> Select Chart Shift) Kindly rate and comment about the product for upgradation & Support When using candlestick timers, keep in mind that the timing of candlestick patterns can play a crucial role in your trading strategy. For instance, different timeframes (such as 1-minute, 5-minute, hourly, ) can provide varying insights into price movements and trends. Make sure to i
FREE
This Mt5 Indicator Signals when there is two opposite direction bars engulfed by current bar.  has a recent Exponential Moving Average Cross and past bar was oversold/bought Expert Advisor Available in Comments  Free Version Here : https://www.mql5.com/en/market/product/110114?source=Site&nbsp ; Full Alerts for mt5 terminal , phone , email, print to file, print to journal  Buy Signal ( blue line ) Past ema cross ( set at 30 bars back ) Past bar rsi is oversold ( level 40  ) Engulfing bar closes
FREE
WH Price Wave Pattern MT5
Wissam Hussein
4.15 (13)
Bienvenue dans notre   modèle de vague de prix   MT5 -- (modèle ABCD) -- Le modèle ABCD est un modèle de trading puissant et largement utilisé dans le monde de l'analyse technique. Il s'agit d'un modèle de prix harmonique que les commerçants utilisent pour identifier les opportunités potentielles d'achat et de vente sur le marché. Avec le modèle ABCD, les traders peuvent anticiper les mouvements de prix potentiels et prendre des décisions éclairées sur le moment d'entrer et de sortir des trans
FREE
Smc Session Killzone and Breakout The Smc Session Killzone and Breakout indicator automates the institutional session trading model for MetaTrader 5. It draws the Asian, London, and New York session ranges as labelled boxes on the chart, detects when price sweeps beyond the Asian session high or low, and fires a non-repainting entry signal after a Market Structure Shift is confirmed. All signals are based on closed bars and do not repaint. The underlying model follows the sequence that institut
FREE
HammerStar
Arismario Verissimo Neves
3.4 (5)
The HammerStar indicator is designed to search for the Hammer and Shooting Star patterns on charts of any currency pairs. Hammer Downward trend. The lower shadow is not less than 2 and no more than 3 times larger than the body. There is no upper shadow, or it is very short (no more than 10% of the candlestick range). The color of the body in the long game is not important, with the short - white hammer is much stronger than the black one. Confirmation is suggested. Shooting Star Uptrend. The u
FREE
See the Asia, London and New York sessions at a glance: range boxes with their size in pips or points, optional ICT killzones and a live session panel that shows what is open now, how far it has moved and when the next session starts. Clean, automatic and correct for every broker time zone. SESSIONS - Asia, London and New York drawn as range boxes from the session high to the session low. - 50% level of every session as a subtle dotted line. - Session name and range (pips or points) on each box
FREE
The "Support Resistance Dynamic" indicator is a powerful technical analysis tool for the MetaTrader 5 platform, designed to automatically identify and plot dynamic Support and Resistance zones on price charts. This indicator helps traders easily recognize important price levels, potential reversal points, or breakout areas, thereby enabling more informed trading decisions. 2. Key Features Dynamic S/R Identification : Automatically identifies support and resistance zones based on an advanced Pivo
FREE
ICT Killzones and Liquidity Levels is a clean chart tool that marks the main ICT killzones and key liquidity levels directly on your chart. It is designed for traders who follow Smart Money Concepts and ICT-style price action and want a simple, non-repainting reference on the chart. The indicator draws the Asian, London, New York and London Close killzones as boxes based on the session high and low. A vertical line marks the start of each killzone for the current day, so you can see when each se
FREE
Les acheteurs de ce produit ont également acheté
Trend Sniper X
Sarvarbek Abduvoxobov
4.9 (40)
Trend Sniper X est un indicateur de suivi de tendance multi-unités de temps pour MetaTrader 5 qui aide les traders à identifier la direction de la tendance et les points d'inversion potentiels avec clarté et précision. pour MT4: https://www.mql5.com/en/market/product/193245 Informations sur le prix : Le prix actuel est un prix promotionnel et est susceptible de changer lors des prochaines mises à jour et nouvelles fonctionnalités. Offre bonus : Pour obtenir GRATUITEMENT l'Auto-Trade Assistant E
Smart Trend Trading System — MetaTrader 5 Après votre achat, envoyez-moi un message sur MQL5 pour recevoir GRATUITEMENT Smart Universal Expert Advisor, ainsi que le cours en ligne, le manuel PDF et l’accès au groupe privé. STTS réunit la direction de la tendance, les signaux d’entrée et de sortie, les zones de retournement et les niveaux de prix importants directement sur votre graphique. Suivez le système manuellement ou connectez un EA compatible distinct pour une exécution automatique selon l
ARIPoint
Temirlan Kdyrkhan
1 (4)
ARIPoint is a powerful trading companion designed to generate high-probability entry signals with dynamic TP/SL/DP levels based on volatility. Built-in performance tracking shows win/loss stats, PP1/PP2 hits, and success rates all updated live. Key Features: Buy/Sell signals with adaptive volatility bands Real-time TP/SL/DP levels based on ATR Built-in MA Filter with optional ATR/StdDev volatility Performance stats panel (Success, Profit/Loss, PP1/PP2) Alerts via popup, sound, push, or email Cu
Zoryk Gold
Reda El Koutbane
5 (15)
ZORYK — Système avancé de signaux XAUUSD pour MetaTrader 5 Vous connaissez certainement cette sensation. Vous passez du temps à analyser l’or. Vous attendez le bon point d’entrée. Vous ouvrez enfin la position, puis le prix commence immédiatement à évoluer contre vous. Vous fermez trop tôt, déplacez le Stop Loss ou hésitez pendant quelques secondes. Ensuite, le marché atteint exactement l’objectif que vous aviez initialement prévu, mais sans vous dans la position. Le problème n’était pas toujour
SuperScalp Pro
Van Minh Nguyen
4.66 (35)
SuperScalp Pro - Professional Multi-Layer Confluence Scalping System SuperScalp Pro est un indicateur avancé de scalping qui améliore le Supertrend classique grâce à plusieurs filtres intelligents de confirmation. Il aide à identifier des opportunités de Buy/Sell présentant une probabilité plus élevée, tout en réduisant considérablement les faux signaux. Des flèches Buy et Sell claires apparaissent directement sur le graphique, tandis que les niveaux de Stop Loss et Take Profit basés sur l’ATR s
Gann Made Easy   est un système de trading Forex professionnel et facile à utiliser qui est basé sur les meilleurs principes de trading en utilisant la théorie de mr. WD Gann. L'indicateur fournit des signaux d'ACHAT et de VENTE précis, y compris les niveaux Stop Loss et Take Profit. Vous pouvez échanger même en déplacement en utilisant les notifications PUSH. VEUILLEZ ME CONTACTER APRÈS L'ACHAT POUR RECEVOIR GRATUITEMENT DES INSTRUCTIONS DE TRADING ET D'EXCELLENTS INDICATEURS SUPPLÉMENTAIRES! V
SMC Intraday Formula
VividMind Digital Solutions
5 (26)
Commençons par être honnêtes. Aucun indicateur ne vous rendra rentable à lui seul. Si quelqu’un vous dit le contraire, il vous vend un rêve. Tout indicateur qui affiche des flèches parfaites d’achat/vente peut être rendu impeccable — il suffit de zoomer sur la bonne partie de l’historique et de capturer uniquement les trades gagnants. Nous ne faisons pas cela.  SMC Intraday Formula est un outil. Il lit la structure du marché pour vous, identifie les zones de prix à la probabilité la plus élevée
GoldenX Entry MT5
VividMind Digital Solutions
5 (16)
GoldenX Entry est un indicateur MT5 doté d’un algorithme adaptatif Smart Entry Trend, d’un système de scoring des signaux, d’un détecteur de régime de marché et d’un filtre de volatilité. Chaque signal inclut un niveau d’entrée calculé, trois niveaux de Take-Profit (TP1, TP2, TP3) ainsi qu’un niveau de Stop-Loss. Il est construit sur plusieurs couches analytiques conçues pour s’adapter à différentes conditions de marché, combinant un système analytique multicouche avec un optimiseur intégré et u
Un nouveau Roi en ville - Indicateur + Gestion des ordres (TP1 + TP2 + TP3) + Envoi optionnel de signaux Telegram INCLUS (GRATUIT) (SYSTÈME COMPLET DE TRADING et DE SIGNAUX) Notre meilleur EA pour l’Or : Gold Slayer Cet indicateur inclut une stratégie avancée, un système de trading avec gestion des ordres personnalisable ainsi qu’un système de retour à la moyenne combinant des extensions d’enveloppes, soutenu par plusieurs filtres intelligents de confirmation comme le RSI afin de détecter des en
Neuro Poseidon MT5
Daria Rezueva
4.75 (52)
Neuro Poseidon is a new indicator by Daria Rezueva. It combines precise trading signals with adaptive TP/SL levels - creating best possible trades as a result! Message me and get  Neuro Poseidon Assistant  as a gift to automize your trading process! What makes it stand out? 1. Proven profitability on all assets and timeframes 2. Only confirmed BUY and SELL signals present on the chart 3. Adaptive TP & SL levels generated by the software for each trade 4. Easy to understand - suitable for al
Auto Optimized SpeedAngle est un système de vectorisation du momentum de niveau institutionnel qui élimine l'ajustement de courbe ( curve-fitting ) grâce à une optimisation continue par avancement ( Walk-Forward Optimization , WFO). Plutôt que de s'appuyer sur des entrées statiques qui se dégradent lorsque les régimes de marché changent, l'indicateur recalibre dynamiquement ses paramètres en utilisant une validation hors échantillon ( Out-of-Sample , OOS), garantissant ainsi que les signaux affi
La légende est de retour : Entry Points Pro 10. La relance de l'indicateur légendaire qui s'est maintenu 3 ans dans le Top-3 du MQL5 Market. Des centaines d'avis enthousiastes (589 sur les deux versions), des milliers de traders l'utilisent chaque jour, 31 000+ téléchargements de la démo   MT4+MT5 . J'ai lu chacun de vos avis publiés en cinq ans — et au lieu de promettre, j'ai intégré les réponses directement dans la version 10. Par un auteur présent sur les marchés depuis 1999, qui tient à l'ho
FiboSniper Pro
Van Minh Nguyen
5 (3)
FiboSniper Pro – Multi-Filter Fibonacci System with Auto SL/TP and Control Panel FiboSniper Pro est un indicateur technique qui combine des Fibonacci Envelopes dynamiques avec plusieurs filtres de confirmation afin de générer des signaux Buy et Sell sélectionnés. Les niveaux de Fibonacci sont calculés à partir de Moving Average et ATR, puis filtrés par ADX, EMA, RSI, ATR, Volume, Time et la structure des bougies. L’indicateur affiche directement sur le graphique les niveaux automatiques de Stop
Welcome to ENTRY IN THE ZONE AND SMC MULTI TIMEFRAME SPECIAL BENEFIT / FOR OUR MQL5 CUSTOMERS FREE ACCESS TO THE NEW TOOL  — COMING SOON — Learn more on our official website  : https://www.fableedge.net Entry In The Zone and SMC Multi Timeframe is a real-time market analysis tool based on Smart Money Concepts (SMC), designed to analyze market structure, price direction, and key trading zones. It supports both Single-Timeframe Analysis and Multi-Timeframe Analysis, providing a clearer view of the
Unix Scalper
Issam Kassas
4 (4)
Unix Scalper — MetaTrader 5 Après votre achat, envoyez-moi un message sur MQL5 pour recevoir GRATUITEMENT Smart Universal Expert Advisor, ainsi que le cours en ligne, le manuel PDF et l’accès au groupe privé. Repérez la configuration. Consultez le plan. Choisissez comment intervenir. UNIX Scalper réunit l’analyse du marché, les décisions BUY/SELL/WAIT et les niveaux Entry, Stop Loss, TP1 et TP2 dans un panneau organisé. VISUALISEZ LE SIGNAL ET LE PLAN • Des décisions claires : BUY, SELL ou WAIT.
M1 Sniper MT5
Oleg Rodin
5 (7)
M1 SNIPER   est un système d'indicateurs de trading facile à utiliser. Il s'agit d'un indicateur à flèche conçu pour l'unité de temps M1. Cet indicateur peut être utilisé seul pour le scalping sur l'unité de temps M1 ou intégré à votre système de trading existant. Bien que conçu spécifiquement pour le trading sur l'unité de temps M1, ce système peut également être utilisé avec d'autres unités de temps. Initialement, j'avais conçu cette méthode pour le trading du XAUUSD et du BTCUSD. Cependant, j
Adaptive Price Action Engine Achetez un indicateur, obtenez l'EA gratuitement Analyse auto-optimisée des tendances et des figures de chandeliers Multi-Timeframe Les marchés évoluent constamment, et tous les modèles de Price Action n’ont pas la même valeur dans toutes les conditions de marché. Adaptive Price Action Engine a été conçu pour s’adapter aux changements du marché en combinant structure de tendance, analyse Multi-Timeframe, figures de chandeliers et optimisation statistique au sein d’un
Gold Entry Sniper
Tahir Mehmood
5 (21)
Gold Entry Sniper – Tableau de Bord ATR Multi-Unités de Temps pour Scalping et Swing Trading sur l'Or Gold Entry Sniper est un indicateur avancé pour MetaTrader 5 qui fournit des signaux d'achat/vente précis sur XAUUSD et autres actifs, basé sur la logique de Trailing Stop ATR et l' analyse multi-unités de temps . Caractéristiques et Avantages Clés Analyse Multi-Unités de Temps – Affiche les tendances en M1, M5, M15 sur un seul tableau. Trailing Stop Basé sur l'ATR – Ajuste automatiquement selon
Tokyo mt5 Indicator
Vasiliy Strukov
5 (7)
Le Tokyo Indicator offre une vue d'ensemble visuelle et claire de l'orientation de la tendance, des signaux de trading potentiels et des conditions du marché. Sa ligne de tendance en escalier, codée par couleur, distingue les phases haussières (en bleu) des phases baissières (en magenta). Des flèches directionnelles associées mettent en évidence les opportunités d'achat et de vente potentielles lors des changements de tendance. Un tableau de bord intégré regroupe le signal actuel, l'orientation
Scalper Vault   est un système de scalpage professionnel qui vous fournit tout ce dont vous avez besoin pour un scalpage réussi. Cet indicateur est un système de trading complet qui peut être utilisé par les traders de forex et d'options binaires. Le délai recommandé est M5. Le système vous fournit des signaux fléchés précis dans le sens de la tendance. Il vous fournit également des signaux supérieurs et inférieurs et des niveaux de marché Gann. Les indicateurs fournissent tous les types d'alert
FX Trend MT5 NG
Daniel Stein
5 (6)
FX Trend NG : La Nouvelle Génération d’Intelligence de Tendance Multi-Marchés Vue d’ensemble FX Trend NG est un outil professionnel d’analyse de tendance multi-timeframe et de surveillance des marchés. Il vous permet de comprendre la structure complète du marché en quelques secondes. Au lieu de naviguer entre de nombreux graphiques, vous identifiez immédiatement quels instruments sont en tendance, où le momentum s’affaiblit et où plusieurs unités de temps sont alignées. Offre de Lancement – Ob
FX Power MT5 NG
Daniel Stein
5 (33)
FX Power : Analysez la force des devises pour des décisions de trading plus intelligentes Aperçu FX Power est l'outil essentiel pour comprendre la force réelle des principales devises et de l'or, quelles que soient les conditions du marché. En identifiant les devises fortes à acheter et les faibles à vendre, FX Power simplifie vos décisions de trading et révèle des opportunités à forte probabilité. Que vous suiviez les tendances ou anticipiez les retournements à l'aide de valeurs extrêmes de D
Smart Price Action Concepts — MetaTrader 5 Après votre achat, envoyez-moi un message sur MQL5 pour recevoir GRATUITEMENT Smart Universal Expert Advisor, ainsi que le cours en ligne, le manuel PDF et l’accès au groupe privé. Observez la structure. Identifiez les zones. Construisez votre plan de trading. Réunissez Smart Money Concepts (SMC), analyse de style ICT et action des prix sur un graphique organisé. Identifiez la structure du marché, les blocs d’ordres, les niveaux de référence de liquidit
Power Candles MT5
Daniel Stein
4.58 (12)
Power Candles V3 - Indicateur de force à optimisation automatique Power Candles V3 transforme la force des devises et des instruments en un plan de trading exploitable sur chaque graphique auquel il est associé. Au lieu de se contenter de colorer les bougies, il effectue une optimisation automatique en temps réel en arrière-plan et vous fournit les meilleurs niveaux de Stop Loss, Take Profit et seuils de signal pour le symbole que vous avez sous les yeux. Un simple clic suffit pour l'adopter en
M1 Quantum MT5
Hamed Dehgani
4.2 (10)
Signaux de Trading en Direct avec M1 Quantum : Signal   (L’opération est exécutée automatiquement par le Quantum Trade Assistant , inclus gratuitement avec ce produit.) Dernières nouvelles : La version 1.64 a été publiée. Toutes les transactions disposent désormais d’un Stop Loss placé derrière les zones de support/résistance correspondantes. La fonction Smart Close a également été améliorée afin d’augmenter les performances de l’EA dans cette version. Depuis le 9 août, le signal en direct fonc
Market Structure Order Block Dashboard MT5 est un indicateur MT5 conçu pour les traders qui veulent lire la structure de marché et les principales zones de réaction du prix directement sur le graphique. Il combine BOS, ChoCH, Order Blocks, Fair Value Gaps (FVG), Liquidité, Kill Zones, Volume Profile, et un dashboard compact pour une analyse rapide. Cet indicateur s'adresse aux traders qui utilisent la structure de marché, les concepts ICT et Smart Money comme cadre de décision. Il peut aider à r
Atomic Analyst MT5
Issam Kassas
4.47 (60)
Atomic Analyst — MetaTrader 5 Après votre achat, envoyez-moi un message sur MQL5 pour recevoir GRATUITEMENT Smart Universal Expert Advisor, ainsi que le cours en ligne, le manuel PDF et l’accès au groupe privé. Atomic Analyst réunit l’action des prix, la direction de la tendance, les signaux d’entrée et de sortie, le Stop Loss et plusieurs niveaux de Take Profit directement sur votre graphique. REPÉREZ LE SIGNAL. COMPRENEZ LA CONFIGURATION. Atomic Analyst présente son analyse sous forme d’inform
Crystal Heikin Ashi Signals
Muhammad Jawad Shabir
5 (4)
Crystal Heikin Ashi Signals—Professional Trend & Signal Detection Indicator Advanced Heikin Ashi Visualization with Intelligent Signal System for Manual & Automated Trading Final Price: $149 ---------> Price goes up $10 after every 10 sales . Limited slots available — act fast . Overview User Guide PDF Crystal Heikin Ashi Signals is a professional-grade MetaTrader 5 indicator that combines pure Heikin Ashi candle visualization with an advanced momentum-shift detection system. Designed for both m
Divergence Bomber
Ihor Otkydach
4.89 (94)
Chaque acheteur de cet indicateur reçoit également gratuitement : L’outil exclusif « Bomber Utility », qui accompagne automatiquement chaque opération de trading, fixe les niveaux de Stop Loss et de Take Profit, et clôture les positions selon les règles de la stratégie Des fichiers de configuration (set files) pour adapter l’indicateur à différents actifs Des set files pour configurer le Bomber Utility selon différents modes : « Risque Minimum », « Risque Équilibré » et « Stratégie d’Attente »
Quant Direction MT5
Georgios Kalomoiropoulos
Quant Direction est un outil d'analyse de marché 3D. Il fournit une analyse de marché parfaitement objective, basée sur un algorithme, en calculant des écarts précis en pourcentage sur différents paramètres. Développé à l'aide d'outils de modélisation avancés basés sur l'IA et soumis à des tests rigoureux, cet algorithme analyse le marché avec une précision inégalée. Vous pouvez analyser n'importe quelle paire de devises ou instrument financier sur la plateforme. Que vous pratiquiez le trading à
Plus de l'auteur
Liquidity Breaks and Swings
Erik Istvan Fazekas
5 (2)
Voir "Nouveautés" pour un récapitulatif des nouvelles fonctions. La version 1.4 n'était qu'un nettoyage, rien de spécial. J'ai créé cela car j'avais besoin d'un indicateur fractal personnalisable. Il vérifie également la diminution des volumes pour obtenir une forme de confirmation. Détails ci-dessous : Vue d'ensemble Cet indicateur est conçu pour aider à identifier les points de retournement clés sur le marché en analysant l'action des prix et la dynamique des volumes. Caractéristiques La strat
FREE
Dynamic Volume Profile/Delta Selected Range Volume Delta Profile displays volume distribution and estimated delta within a user-defined chart range. Move or resize the selection rectangle to analyze a different period. The indicator plots the volume profile, positive and negative delta, Point of Control (POC), and Value Area Low and High levels (VVL and VVH). Profiles can be calculated from quote ticks or lower-timeframe bars, with support for tick or real volume when available. Adjustable opti
FREE
Filtrer:
Aucun avis
Répondre à l'avis