Dynamic Global Exchange Sessions

Global Exchange Sessions

Global Exchange Sessions is an MQL5 indicator that marks the regular trading hours of the world’s main stock exchanges directly on your chart.

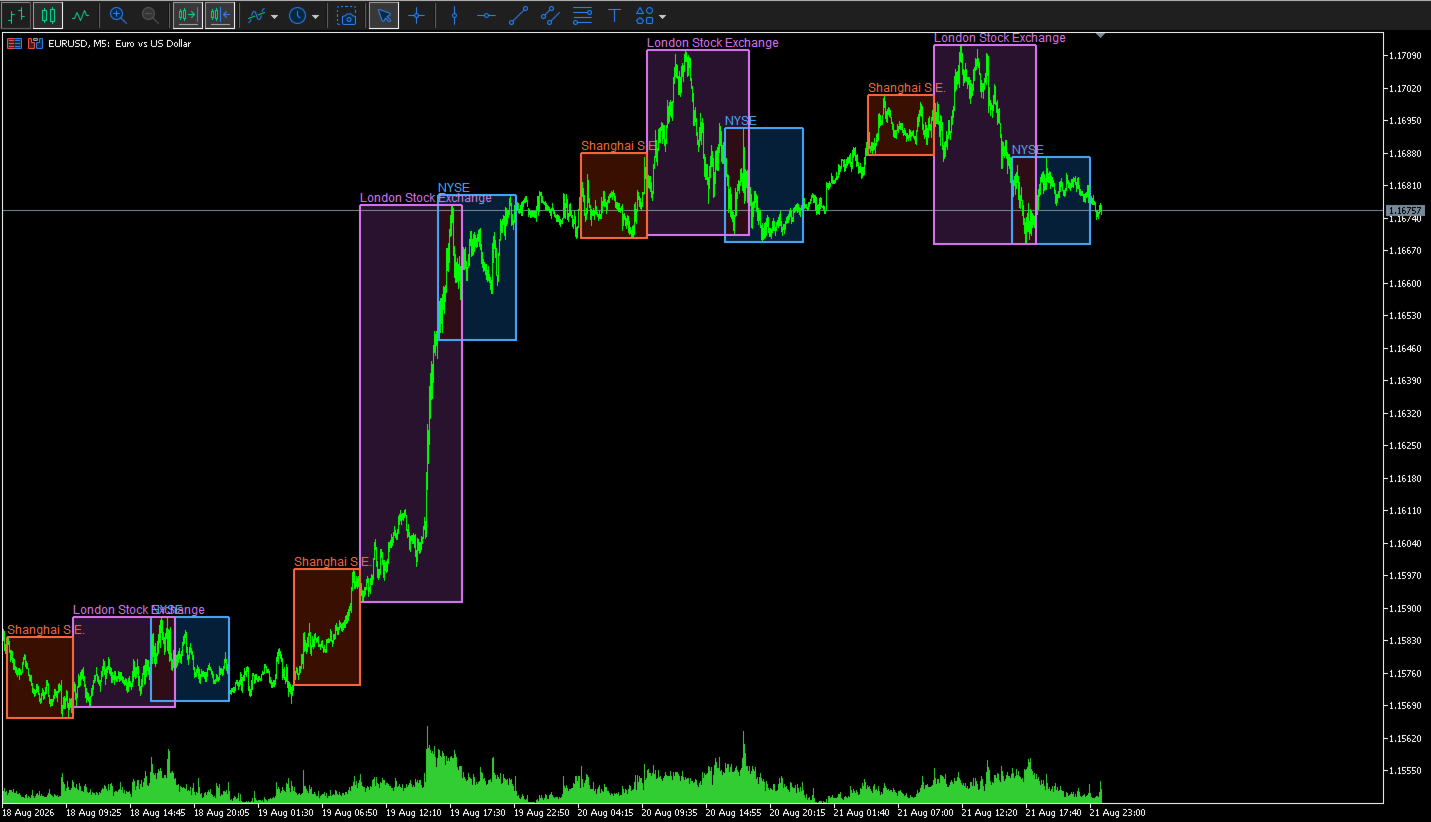
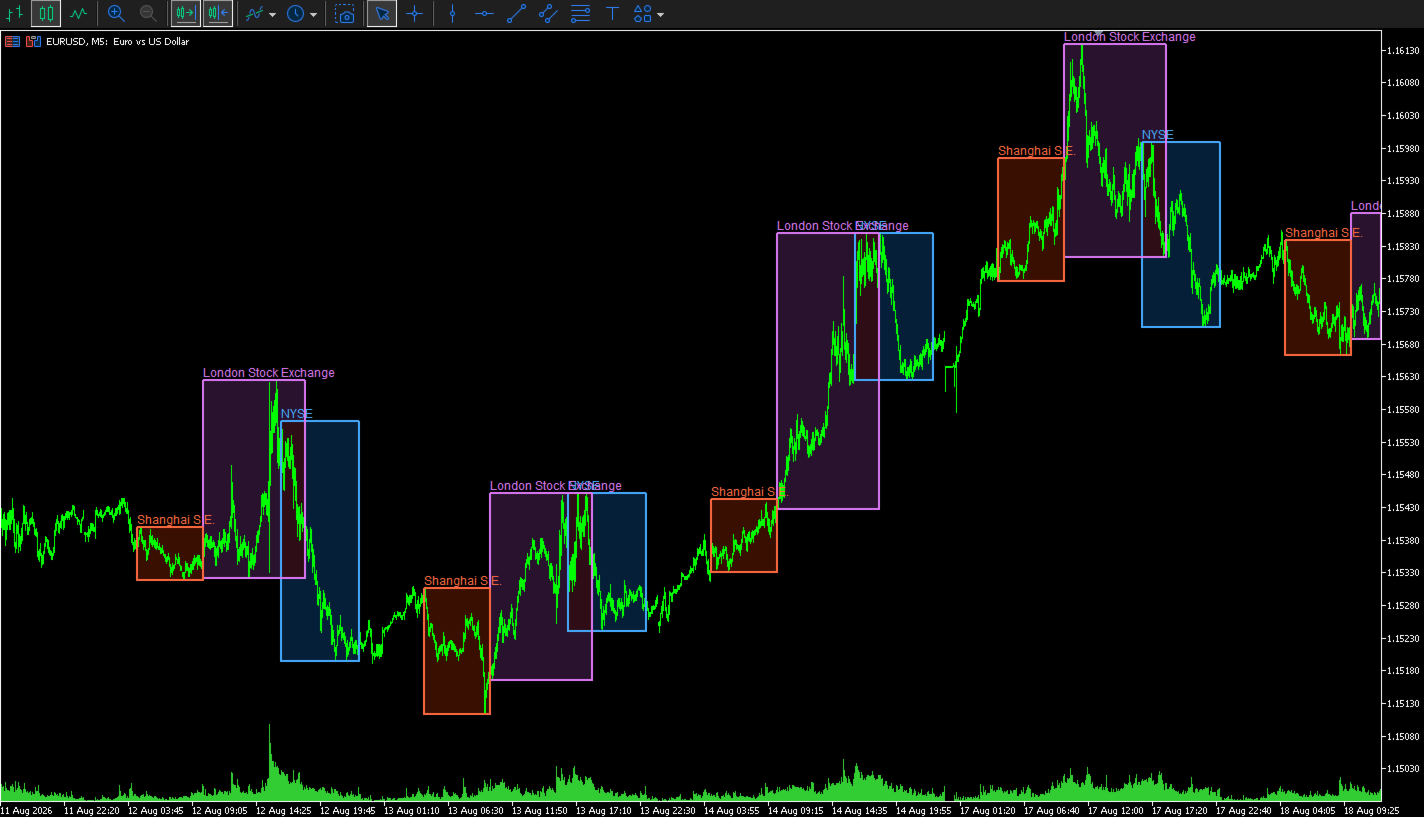
Each session is shown as a colored rectangle. The rectangle starts at the official market open and ends at the official market close. Its upper and lower edges follow the session high and low as new prices arrive.

This makes it easy to see when major equity markets are active, where each session formed its range, and how price reacted when sessions overlapped.

Included exchanges

The indicator supports six stock exchanges:

  • New York Stock Exchange — NYSE

  • London Stock Exchange — LSE

  • Shanghai Stock Exchange — SSE

  • Tokyo Stock Exchange — TSE

  • Hong Kong Stock Exchange — HKEX

  • Euronext

Each exchange can be enabled or disabled separately.

By default, the indicator displays:

  • NYSE

  • London Stock Exchange

  • Shanghai Stock Exchange

Tokyo, Hong Kong, and Euronext are included but disabled by default. You can enable them from the indicator inputs at any time.

Regular session hours

The indicator uses the following regular cash-market hours:

  • NYSE: 09:30–16:00 New York time

  • London Stock Exchange: 08:00–16:30 London time

  • Shanghai Stock Exchange: 09:30–15:00 Shanghai time

  • Tokyo Stock Exchange: 09:00–15:30 Tokyo time

  • Hong Kong Stock Exchange: 09:30–16:00 Hong Kong time

  • Euronext: 09:00–17:30 Central European time

Automatic broker-time conversion

You do not need to calculate the difference between exchange time and broker time.

The indicator reads the broker’s current server time and compares it with GMT. It then converts each exchange session into the time used by your chart.

This is useful because MetaTrader brokers do not all use the same server time. One broker may use UTC, another may use UTC+2, and another may change its server offset during daylight saving time.

Three broker-time modes are available.

Auto Current Offset

This is the default mode.

The indicator calculates the current broker offset from:

TimeTradeServer() - TimeGMT()

The detected offset is used for all displayed sessions.

This mode is suitable when you mainly use the current day or when your broker keeps a fixed UTC offset.

Auto European DST

This mode detects the current broker offset and applies a European daylight-saving schedule to historical dates.

It is useful for brokers that change their server time according to European summer-time rules.

Use this mode when older session rectangles shift by one hour after a daylight-saving change.

Manual Fixed Offset

This mode lets you enter the broker’s UTC offset in minutes.

Examples:

  • UTC: 0

  • UTC+1: 60

  • UTC+2: 120

  • UTC+3: 180

  • UTC-5: -300

This mode is useful when the automatic result does not match your broker or when you use a broker with a fixed server offset.

Exchange daylight saving time

The indicator calculates daylight saving time separately for the exchanges that use it.

It includes:

  • US daylight saving time for NYSE

  • UK daylight saving time for the London Stock Exchange

  • European daylight saving time for Euronext

Shanghai, Tokyo, and Hong Kong use fixed UTC offsets because these locations do not currently change their clocks during the year.

This separate calculation is important during the weeks when the United States and Europe change their clocks on different dates.

Dynamic session highs and lows

The rectangle is not based on a fixed price height.

When a session starts, the indicator reads the price bars inside that session. It finds the highest high and the lowest low, then uses those values as the top and bottom of the rectangle.

While the session is active:

  • A new session high moves the upper edge higher.

  • A new session low moves the lower edge lower.

  • The rectangle keeps its official opening and closing times.

  • The range updates as new price data arrives.

After the session closes, the completed high and low remain visible for the selected history period.

The default calculation timeframe is M1. This gives the indicator a more precise session range, even when it is attached to a higher chart timeframe.

You can change the calculation timeframe if you want to reduce the amount of historical data that MetaTrader must load.

Transparent-style session fills

Each session uses two separate rectangles:

  • A soft background fill

  • A clear foreground border

The fill color is blended with the current chart background. This produces a transparent-style result on both dark and light chart themes.

The default fill opacity is 22%.

You can change the opacity from 0 to 100:

  • 0 makes the fill fully hidden.

  • Lower values create a softer session area.

  • Higher values make the session color stronger.

  • 100 uses the full selected fill color.

The border is not affected by the fill opacity. It remains clear so that the session range is still easy to identify.

By default, fills are drawn behind the candles and borders are drawn in front of the candles.

Session colors

Every exchange has separate fill and border color settings.

The default colors are:

  • NYSE: blue

  • London: purple

  • Shanghai: orange-red

  • Tokyo: yellow

  • Hong Kong: green

  • Euronext: cyan

You can change each color from the indicator inputs.

The fill and border colors do not need to match. For example, you can use a dark blue fill with a bright blue border, or turn the fill off and display only the session outline.

Labels

The indicator can place the exchange name at the upper-left area of each session rectangle.

Labels use the session border color, which helps connect the name with its rectangle.

You can:

  • Show or hide labels

  • Change the label font size

  • Change the label color by changing the session border color

Labels are enabled by default.

Border settings

The session border can be adjusted to match your chart style.

Available settings include:

  • Border color for each exchange

  • Border width

  • Border line style

  • Foreground or background drawing

The default border width is two pixels, which keeps the session outline visible without covering too much price information.

Historical sessions

The History Days input controls how many calendar days the indicator processes.

The default value is 10 days.

A higher value displays more historical sessions, but it also requires more price data and more chart objects.

For normal intraday use, a value between 5 and 20 days is usually sufficient.

Only Monday-to-Friday session dates are processed. Weekend sessions are not drawn.

Refresh rate

The indicator checks active sessions at a regular interval.

The default refresh interval is five seconds.

It also updates when:

  • A new price calculation occurs

  • The chart changes

  • The chart scale or visible area changes

A shorter refresh interval gives faster visual updates but causes MetaTrader to process the session data more often.

Main inputs

General settings

InpHistoryDays

Sets the number of historical calendar days to process.

InpHighLowTimeframe

Sets the timeframe used to calculate each session high and low. The default is M1.

InpRefreshSeconds

Sets the update interval in seconds.

InpShowLabels

Shows or hides exchange names.

InpLabelFontSize

Sets the label text size.

InpFillRectangles

Enables or disables the colored session fills.

InpFillOpacityPercent

Controls the strength of the session fill from 0 to 100.

InpDrawFillBehindCandles

Places the session fill behind the price candles.

InpDrawBordersInForeground

Places session borders in front of the candles.

InpBorderStyle

Sets the border line style.

InpBorderWidth

Sets the border thickness.

Broker-time settings

InpBrokerOffsetMode

Selects automatic current offset, automatic European DST, or manual fixed offset.

InpManualBrokerUTCMinutes

Sets the manual broker UTC offset in minutes.

This value is used when Manual Fixed Offset is selected. It is also used as a fallback if automatic time detection is not available.

Exchange settings

Each exchange has:

  • An enable or disable switch

  • A fill color

  • A border color

This lets you build a simple three-session layout or display all six exchanges.

Suggested setup

For a clean intraday chart, start with the default settings:

  • NYSE enabled

  • London enabled

  • Shanghai enabled

  • All other exchanges disabled

  • M1 high and low calculation

  • 10 history days

  • 22% fill opacity

  • Two-pixel borders

  • Labels enabled

If the chart becomes too busy, reduce the history period or disable the labels.

If the fill is too weak, increase the opacity to approximately 30–35%.

If the fill is too strong, reduce it to approximately 10–15%.

Practical uses

The indicator can help with several types of analysis.

Session range analysis

See the high and low formed during each stock-market session.

Session overlap

Identify periods when two major markets are open at the same time, such as London and New York.

Breakout context

See whether price breaks above or below a completed session range.

Volatility comparison

Compare the size of the Asian, European, and US session ranges.

Intraday support and resistance

Use completed session highs and lows as reference levels for later price action.

Market timing

See which major equity market is active without converting local exchange times manually.

Important notes

The indicator uses regular weekday session schedules.

It does not contain an exchange holiday calendar. It also does not automatically adjust for special early-close days, emergency closures, or temporary exchange schedule changes.

If the chart symbol continues to trade while a stock exchange is closed for a holiday, MetaTrader may still provide price bars during the normal session window. In this case, the indicator can draw a rectangle even though the physical exchange is closed.

Historical accuracy also depends on the price history supplied by your broker. Missing M1 data can prevent a session rectangle from appearing or can produce an incomplete range.

The indicator is designed for visual analysis. It does not provide trading signals, alerts, order execution, or profit guarantees.
Prodotti consigliati
Trading Session MT5
Kevin Schneider
3 (1)
Indicatore delle Sessioni di Trading L'Indicatore delle Sessioni di Trading visualizza i punti alti e bassi, nonché gli orari di inizio e fine delle sessioni di trading asiatiche, di Londra e di New York direttamente sul tuo grafico. Caratteristiche: Visualizzazione delle principali sessioni di trading Evidenziazione dei punti alti e bassi Visualizzazione degli orari di inizio e fine di ogni sessione Orari delle sessioni personalizzabili Facile da usare ed efficiente Personalizzabilità: Ogni ses
FREE
Crow s r v1
Cristobal Hidalgo Soriano
S_R_MT5_V1 Professional Support and Resistance indicator for MetaTrader 5 designed for traders looking for fast, clean and visual key market zones. S_R_MT5_V1 automatically detects important support and resistance levels displaying dynamic zones directly on the chart with a modern and optimized visualization for intraday trading and scalping. Perfect for: Scalping Intraday trading Reversal trading Breakouts Institutional zone confirmation Main Features: Automatic support and resistance detectio
FREE
Market Hours Pro
Musa Terrance Khosa
Market Hours Pro shows Tokyo, London, and New York trading sessions directly on your MT5 chart, including scheduled overlap periods. It’s designed to give you a clear view of global market timing so you can plan trades, spot high-activity periods, and align strategies with standard Forex hours. How It Works Displays scheduled session times visually on your chart. Highlights session overlaps for London/New York and Tokyo/London. Automatically adjusts times for your timezone or broker time. Shows
FREE
Multi Currency Strength Dashboard Mini (FREE) – Currency Strength Meter for MetaTrader 5 Multi Currency Strength Dashboard Mini è un indicatore gratuito per MetaTrader 5 che mostra in tempo reale la forza relativa delle 8 valute principali (USD, EUR, GBP, JPY, CHF, CAD, AUD, NZD) in un dashboard chiaro e di rapida lettura. Obiettivo: individuare in pochi secondi quali valute sono forti e quali deboli per orientare la propria watchlist (ad esempio, selezionare coppie in cui una valuta forte si co
FREE
Pivot Points Daily
Davide Zunino
4.8 (5)
L'indicatore rappresenta i Livelli di Pivo Points. E' possibile specificare il numero dei giorni per il quale l'indicatore viene visualizzato. Per il Forex non viene considerata la sessione di Domenica. E' possibile modificare per ogni livello colore, tipo e spessore linea. La visualizzazione avviene meglio con timeframe inferiori all'H1. Vengono graficati 4 livelli di supporto e resistenza con anche i livelli intermedi che è possibile disabilitare.
FREE
主要城市的时间。北京时间、东京时间、悉尼时间、惠灵顿时间、纽约时间、法兰克福时间、伦敦时间、迪拜时间。 城市时间可选择开启或者关闭。 点差变色提醒。设置点差提醒点数,例如,设置100点,点差大于100点,文字会变红色。 Time in major cities. Beijing time, Tokyo time, Sydney time, Wellington time, New York time, Frankfurt time, London time, Dubai time. City time can be turned on or off. Dot difference color change reminder. Set the point difference reminder points. For example, set 100 points. If the point difference is greater than 100 points, the text will turn red.
FREE
SESSION SUHUTRADE: Master the Market Hours with Precision Are you tired of missing out on high-probability setups during specific trading sessions? Do you struggle to identify when the Asian, London, or New York markets are truly active and presenting the best opportunities? Introducing SESSION SUHUTRADE , the ultimate MQL5 indicator designed to give you unparalleled clarity over the global trading sessions. This powerful tool automatically detects and highlights the exact market hours for Asia,
FREE
The "Session Time Vertical Lines" indicator displays vertical lines on the chart that mark the beginning and end of major global trading sessions: Sydney, Tokyo, London, and New York . It is designed to help traders visually identify active market hours, overlaps, and potential high-volume periods directly on the price chart. This tool is especially useful for intraday traders who rely on market session timing to plan entries and exits. Inputs / Settings Parameter Name Description DaysToDraw Num
FREE
this free candle stick timer works on all symbol and all timeframe, in dicator help you to see remain time in hours, minutes, seonds until it close, it is simple and easy to use  and very light, it doesn't not consume much RAM, CPU. you can change font size and can change color of the indicator and what time frame you want it to work on, you also can choose to disable it on specifix time frame.
FREE
Smart FVG Stats
- Md Rashidul Hasan
5 (1)
The  Smart FVG Statistics Indicator  is a powerful MetaTrader 5 tool designed to automatically identify, track, and analyze Fair Value Gaps (FVGs) on your charts. Love it? Hate it? Let me know in a review! Feature requests and ideas for new tools are highly appreciated. :) Try "The AUDCAD Trader": https://www.mql5.com/en/market/product/151841 Key Features Advanced  Fair Value Gap  Detection Automatic Identification : Automatically scans for both bullish and bearish FVGs across specified histo
FREE
ZigZag Support and Resistance Levels
Tshidiso Ephraim Mpakanyane
2 (1)
ZigZag Support and Resistance Levels (v2.0)  è un indicatore per MetaTrader 5 che identifica i livelli di supporto e resistenza sulla base dei punti pivot dello ZigZag, ora dotato di un pannello di controllo interattivo direttamente sul grafico. Raggruppa i livelli vicini in zone utilizzando un metodo di clustering, aiutando a visualizzare le aree in cui il prezzo ha reagito più volte, e distingue i livelli rotti (breakout) dai livelli attivi (extension). Caratteristiche principali 1. Rilevamen
FREE
Support And Resistance indicator that can display round levels and zones . It shows them directly on the chart, providing an easy help when you want to set stop-loss or take-profit level, or when you want to see the next market target.   If an asset price is moving down and bounces back up, the level is called support (think: price floor). If an asset price is moving upward and hits a level where it reverses downward, this is called resistance (think: price ceiling).
FREE
This Small tool allows you to define a time counter in minutes for the closing of your positions according to the number of minutes you have set. For example if you set it to 30 Min, the tool will close each open position after 30 minutes from its opening. The settings ACTIVE: It is to activate the tool and use it to close your positions after the number of minutes defined. MANAGE: you to choose with the symbols managed by the tool. Choose "ALL CURENCY" if you want the system to apply to
FREE
GRATIS — il canale di breakout Donchian e il trailing stop basato su ATR che gestisce l'operazione dopo la rottura, disegnati sullo stesso grafico. La maggior parte degli indicatori di breakout mostra l'ingresso e si ferma lì. La parte difficile del trend following è ciò che viene dopo: dove va lo stop, quando viene spostato e quando il movimento è finito. Questo indicatore disegna entrambe le metà del sistema. === COSA DISEGNA === - Il canale Donchian (superiore e inferiore) sulle ultime N bar
FREE
Trend View
Emanuele Cartelli
Trend View is a simple indicator that shows in a text the trend of the current currency in the timeframe you choose. Inputs are: Color: color of the text. Timeframe: timeframe for calculations. Trend can be: UP: bullish trend. DOWN: bearish trend. ---: trend not defined. You can use this indicator to show the main trend of a bigger timeframe helping you to choose your trades. Note: text is draggable.  
FREE
DC Indicator
Lamont Simone Reynecke
The donchian channel indicator might just be the best fit for you Trading in derivative products such as futures, options, CFD's, forex and certificates contains significant risk. These products are not suitable for every investor. Investors could potentially lose all or more than the original investment. If anything, only money equal to personal risk capital should be used and can be lost without jeopardizing financial security or lifestyle. Partially or fully automated trading programs can
FREE
AI London Session Range Indicator automatically draws the London session's opening range as a box on your chart, giving breakout and session traders an instant, objective reference for the high-volatility window that sets the tone for the rest of the trading day. The indicator tracks the exact high and low reached during the configured opening-range window after the London session start, plots it as a shaded box, and keeps it visible for the rest of the session so you can watch for breakouts, re
FREE
Neon Profile
Manuel Fernandez Barranco
XBK Neon Profile MT5 Developed by XBK Systems. XBK Neon Profile is an advanced technical indicator for MetaTrader 5 that combines smoothed trend analysis and a dynamic volume profile within a single chart window. The indicator is designed to provide a clear view of market structure and significant volume levels without cluttering the screen. Key Features Smoothed Trend Bands (Neon Trend Bands) Identifies the current trend direction using a custom smoothing algorithm designed to filter out market
FREE
Cybertrade Keltner Channels
Emanuel Andriato
4.67 (6)
Cybertrade Keltner Channels - MT5 Created by Chester Keltner, this is a volatility indicator used by technical analysis. It is possible to follow the trend of financial asset prices and generate support and resistance patterns. In addition, envelopes are a way of tracking volatility in order to identify opportunities to buy and sell these assets. It works on periods longer than the period visible on the chart. All values ​​are available in the form of buffers to simplify possible automations.
FREE
(Special New Year promotion - free price!) The indicator displays the actual 'Scale in points per bar' (identical to the manual setting in the Terminal, see screenshot) in the upper right corner of the chart. The displayed value changes INSTANTLY whenever the chart scale is changed! (This is very convenient when planning screenshots). In Settings: Change language (Russian/English), font size of the displayed text, text label offset coefficient from the graph corner, equally in X and Y directi
FREE
Easy SMC Trading
Israr Hussain Shah
3.8 (5)
Structure Trend con Auto RR e Scanner BOS Versione: 1.0 Panoramica Structure Trend con Auto RR è un sistema di trading completo progettato per i trader che si affidano all'azione del prezzo e alla struttura del mercato. Combina un filtro di tendenza levigato con il rilevamento dei punti swing e i segnali di rottura della struttura (BOS) per generare configurazioni di trading ad alta probabilità. La caratteristica distintiva di questo strumento è la gestione automatica del rischio. Al rilevame
FREE
Forex17 Bollinger Channel
Robinson Alves Lemos
5 (1)
Questo indicatore mostra esclusivamente le bande superiore e inferiore di un canale di volatilità in stile Bollinger, senza tracciare la media mobile centrale. Il suo obiettivo principale è fornire un envelope di volatilità pulito e flessibile, consentendo all’utente di concentrarsi sul comportamento del prezzo rispetto ai limiti del canale, mantenendo al contempo il pieno controllo sull’estetica e sull’organizzazione del grafico. A differenza delle Bande di Bollinger tradizionali, dove la media
FREE
Candle Timer Simple
Jithin Sajan Sajan
5 (1)
SETTINGS Make sure to select Chart shift option in the chart.   (Right click in the chart ---> Properties (dialog box) ----> Select Chart Shift) Kindly rate and comment about the product for upgradation & Support When using candlestick timers, keep in mind that the timing of candlestick patterns can play a crucial role in your trading strategy. For instance, different timeframes (such as 1-minute, 5-minute, hourly, ) can provide varying insights into price movements and trends. Make sure to i
FREE
This Mt5 Indicator Signals when there is two opposite direction bars engulfed by current bar.  has a recent Exponential Moving Average Cross and past bar was oversold/bought Expert Advisor Available in Comments  Free Version Here : https://www.mql5.com/en/market/product/110114?source=Site&nbsp ; Full Alerts for mt5 terminal , phone , email, print to file, print to journal  Buy Signal ( blue line ) Past ema cross ( set at 30 bars back ) Past bar rsi is oversold ( level 40  ) Engulfing bar closes
FREE
WH Price Wave Pattern MT5
Wissam Hussein
4.15 (13)
Benvenuto nel nostro   modello di ondata di prezzo   MT5 --(modello ABCD)-- Il modello ABCD è un modello di trading potente e ampiamente utilizzato nel mondo dell'analisi tecnica. È un modello di prezzo armonico che i trader utilizzano per identificare potenziali opportunità di acquisto e vendita sul mercato. Con il modello ABCD, i trader possono anticipare potenziali movimenti di prezzo e prendere decisioni informate su quando entrare e uscire dalle negoziazioni. Versione EA:   Price Wave EA
FREE
Smc Session Killzone and Breakout The Smc Session Killzone and Breakout indicator automates the institutional session trading model for MetaTrader 5. It draws the Asian, London, and New York session ranges as labelled boxes on the chart, detects when price sweeps beyond the Asian session high or low, and fires a non-repainting entry signal after a Market Structure Shift is confirmed. All signals are based on closed bars and do not repaint. The underlying model follows the sequence that institut
FREE
HammerStar
Arismario Verissimo Neves
3.4 (5)
The HammerStar indicator is designed to search for the Hammer and Shooting Star patterns on charts of any currency pairs. Hammer Downward trend. The lower shadow is not less than 2 and no more than 3 times larger than the body. There is no upper shadow, or it is very short (no more than 10% of the candlestick range). The color of the body in the long game is not important, with the short - white hammer is much stronger than the black one. Confirmation is suggested. Shooting Star Uptrend. The u
FREE
See the Asia, London and New York sessions at a glance: range boxes with their size in pips or points, optional ICT killzones and a live session panel that shows what is open now, how far it has moved and when the next session starts. Clean, automatic and correct for every broker time zone. SESSIONS - Asia, London and New York drawn as range boxes from the session high to the session low. - 50% level of every session as a subtle dotted line. - Session name and range (pips or points) on each box
FREE
The "Support Resistance Dynamic" indicator is a powerful technical analysis tool for the MetaTrader 5 platform, designed to automatically identify and plot dynamic Support and Resistance zones on price charts. This indicator helps traders easily recognize important price levels, potential reversal points, or breakout areas, thereby enabling more informed trading decisions. 2. Key Features Dynamic S/R Identification : Automatically identifies support and resistance zones based on an advanced Pivo
FREE
ICT Killzones and Liquidity Levels is a clean chart tool that marks the main ICT killzones and key liquidity levels directly on your chart. It is designed for traders who follow Smart Money Concepts and ICT-style price action and want a simple, non-repainting reference on the chart. The indicator draws the Asian, London, New York and London Close killzones as boxes based on the session high and low. A vertical line marks the start of each killzone for the current day, so you can see when each se
FREE
Gli utenti di questo prodotto hanno anche acquistato
Trend Sniper X
Sarvarbek Abduvoxobov
4.9 (40)
Trend Sniper X è un indicatore trend-following multi-timeframe per MetaTrader 5 che aiuta i trader a identificare la direzione del trend e i potenziali punti di inversione con chiarezza e precisione. per MT4: https://www.mql5.com/en/market/product/193245 Informazioni sul prezzo: Il prezzo attuale è promozionale ed è soggetto a modifiche con il rilascio di futuri aggiornamenti e nuove funzionalità. Offerta Bonus: Per ricevere GRATIS l'Auto-Trade Assistant EA per questo indicatore, invia un messa
Smart Trend Trading System — MetaTrader 5 STTS riunisce la direzione del trend, i segnali di entrata e uscita, le zone di inversione e i livelli di prezzo importanti direttamente sul grafico. Segui il sistema manualmente oppure collega un EA compatibile separato per eseguire le operazioni automaticamente con le impostazioni che scegli. UN SISTEMA. QUATTRO APPROCCI AL TRADING. STTS organizza i suoi approcci al trading in quattro categorie principali: • Scalping — segui segnali e movimenti di merc
ARIPoint
Temirlan Kdyrkhan
1 (4)
ARIPoint is a powerful trading companion designed to generate high-probability entry signals with dynamic TP/SL/DP levels based on volatility. Built-in performance tracking shows win/loss stats, PP1/PP2 hits, and success rates all updated live. Key Features: Buy/Sell signals with adaptive volatility bands Real-time TP/SL/DP levels based on ATR Built-in MA Filter with optional ATR/StdDev volatility Performance stats panel (Success, Profit/Loss, PP1/PP2) Alerts via popup, sound, push, or email Cu
Zoryk Gold
Reda El Koutbane
5 (15)
ZORYK — Sistema avanzato di segnali XAUUSD per MetaTrader 5 Conosci sicuramente questa sensazione. Passi molto tempo ad analizzare l’oro. Aspetti il punto d’ingresso corretto. Finalmente apri l’operazione e il prezzo inizia immediatamente a muoversi contro di te. Chiudi troppo presto, sposti lo Stop Loss o esiti per alcuni secondi. Successivamente il mercato raggiunge esattamente l’obiettivo che avevi previsto inizialmente, ma senza di te nella posizione. Il problema non era sempre la direzione.
SuperScalp Pro
Van Minh Nguyen
4.66 (35)
SuperScalp Pro - Professional Multi-Layer Confluence Scalping System SuperScalp Pro è un indicatore avanzato per lo scalping che migliora il Supertrend classico attraverso diversi filtri intelligenti di conferma. Aiuta a identificare opportunità di Buy/Sell con una probabilità maggiore, riducendo significativamente i falsi segnali. Le frecce Buy e Sell vengono visualizzate direttamente sul grafico, mentre i livelli di Stop Loss e Take Profit basati sull’ATR vengono calcolati automaticamente in t
Gann Made Easy è un sistema di trading Forex professionale e facile da usare che si basa sui migliori principi del trading utilizzando la teoria di mr. WD Gann. L'indicatore fornisce segnali ACQUISTA e VENDI accurati, inclusi i livelli di Stop Loss e Take Profit. Puoi fare trading anche in movimento utilizzando le notifiche PUSH. CONTATTAMI DOPO L'ACQUISTO PER RICEVERE GRATUITAMENTE LE ISTRUZIONI DI TRADING E OTTIMI INDICATORI EXTRA! Probabilmente hai già sentito parlare molte volte dei metodi d
SMC Intraday Formula
VividMind Digital Solutions
5 (26)
Cominciamo con la verità. Nessun indicatore da solo ti renderà profittevole. Se qualcuno ti dice il contrario, ti sta vendendo un sogno. Qualsiasi indicatore che mostra frecce perfette di acquisto/vendita può essere reso impeccabile — basta ingrandire la giusta sezione della storia e catturare solo i trade vincenti. Noi non lo facciamo.  SMC Intraday Formula è uno strumento. Legge la struttura del mercato per te, identifica le zone a più alta probabilità e ti mostra esattamente come appare la t
GoldenX Entry MT5
VividMind Digital Solutions
5 (16)
GoldenX Entry è un indicatore per MT5 con un algoritmo adattivo Smart Entry Trend, un sistema di scoring dei segnali, un rilevatore del regime di mercato e un filtro di volatilità. Ogni segnale include un livello di ingresso calcolato, tre livelli di Take-Profit (TP1, TP2, TP3) e un livello di Stop-Loss. È costruito su più livelli analitici progettati per adattarsi a diverse condizioni di mercato, combinando un sistema analitico multilivello con un ottimizzatore integrato e un sistema di traccia
Un nuovo Re in città - Indicatore + Gestione ordini (TP1 + TP2 + TP3) + Invio opzionale di segnali Telegram INCLUSO (GRATIS) (SISTEMA COMPLETO DI TRADING e SEGNALI) Il nostro miglior EA per l’Oro: Gold Slayer Questo indicatore include una strategia avanzata, un sistema di trading con gestione ordini personalizzabile e un sistema mean reversion che combina estensioni di envelope, supportato da molteplici filtri intelligenti di conferma come RSI per individuare ingressi di inversione ad alta proba
Neuro Poseidon MT5
Daria Rezueva
4.75 (52)
Neuro Poseidon is a new indicator by Daria Rezueva. It combines precise trading signals with adaptive TP/SL levels - creating best possible trades as a result! Message me and get  Neuro Poseidon Assistant  as a gift to automize your trading process! What makes it stand out? 1. Proven profitability on all assets and timeframes 2. Only confirmed BUY and SELL signals present on the chart 3. Adaptive TP & SL levels generated by the software for each trade 4. Easy to understand - suitable for al
Auto Optimized SpeedAngle è un sistema di vettorizzazione del momento di livello istituzionale che elimina l'overfitting ( curve-fitting ) attraverso l'ottimizzazione continua Walk-Forward (WFO). Invece di affidarsi a input statici che si degradano quando i regimi di mercato cambiano, l'indicatore recalibra dinamicamente i suoi parametri utilizzando la validazione Out-of-Sample (OOS), assicurando che i segnali visualizzati rappresentino reali vantaggi statistici anziché anomalie storiche. Quadro
La leggenda ritorna: Entry Points Pro 10. Il rilancio del leggendario indicatore che per 3 anni è rimasto nella Top-3 del MQL5 Market. Centinaia di recensioni entusiaste (589 su due versioni), migliaia di trader lo usano ogni giorno per operare, 31.000+ download della demo   MT4+MT5 . Ho letto ogni vostra recensione degli ultimi cinque anni — e invece di promesse ho inserito nella versione 10 le risposte. Dall'autore che opera sui mercati dal 1999 e tiene all'onestà, alla propria reputazione e a
FiboSniper Pro
Van Minh Nguyen
5 (3)
FiboSniper Pro – Multi-Filter Fibonacci System with Auto SL/TP and Control Panel FiboSniper Pro è un indicatore tecnico che combina Fibonacci Envelopes dinamici con diversi filtri di conferma per generare segnali Buy e Sell selezionati. I livelli di Fibonacci vengono calcolati sulla base di Moving Average e ATR e successivamente filtrati tramite ADX, EMA, RSI, ATR, Volume, Time e struttura delle candele. L’indicatore visualizza direttamente sul grafico i livelli automatici di Stop Loss e Take Pr
Welcome to ENTRY IN THE ZONE AND SMC MULTI TIMEFRAME SPECIAL BENEFIT / FOR OUR MQL5 CUSTOMERS FREE ACCESS TO THE NEW TOOL  — COMING SOON — Learn more on our official website  : https://www.fableedge.net Entry In The Zone and SMC Multi Timeframe is a real-time market analysis tool based on Smart Money Concepts (SMC), designed to analyze market structure, price direction, and key trading zones. It supports both Single-Timeframe Analysis and Multi-Timeframe Analysis, providing a clearer view of the
Unix Scalper
Issam Kassas
4 (4)
Unix Scalper — MetaTrader 5 Individua il setup. Esamina il piano. Scegli come operare. UNIX Scalper riunisce analisi di mercato, indicazioni BUY/SELL/WAIT e livelli Entry, Stop Loss, TP1 e TP2 in un unico pannello organizzato. VISUALIZZA IL SEGNALE E IL PIANO • Indicazioni chiare: BUY, SELL o WAIT. • Livelli definiti: Entry, Stop Loss, TP1 e TP2. • Panoramica multi-timeframe: confronta i segnali dei timeframe presenti nel pannello. • Analisi di supporto: trend, momentum, volumi, volatilità, s
M1 Sniper MT5
Oleg Rodin
5 (7)
M1 SNIPER   è un sistema di indicatori di trading facile da usare. Si tratta di un indicatore a freccia progettato per l'intervallo temporale M1. L'indicatore può essere utilizzato come sistema autonomo per lo scalping sull'intervallo temporale M1 e come parte del tuo sistema di trading esistente. Sebbene questo sistema di trading sia stato progettato specificamente per il trading sull'intervallo temporale M1, può comunque essere utilizzato anche con altri intervalli temporali. Inizialmente ho p
Adaptive Price Action Engine Acquista un indicatore, ricevi l'EA gratis Analisi Auto-Ottimizzata del Trend e dei Pattern Candlestick Multi-Timeframe I mercati cambiano continuamente e non tutti i pattern di Price Action hanno lo stesso valore in ogni condizione di mercato. Adaptive Price Action Engine è progettato per adattarsi alle condizioni di mercato in continua evoluzione, combinando struttura del trend, analisi Multi-Timeframe, pattern Candlestick e ottimizzazione statistica in un unico fr
Gold Entry Sniper
Tahir Mehmood
5 (21)
Gold Entry Sniper – Dashboard ATR Multi-Timeframe per Scalping e Swing Trading sull’Oro Gold Entry Sniper è un indicatore avanzato per MetaTrader 5 che offre segnali di acquisto/vendita precisi per XAUUSD e altri strumenti, basato sulla logica ATR Trailing Stop e l' analisi multi-timeframe . Caratteristiche e Vantaggi Analisi Multi-Timeframe – Visualizza trend su M1, M5, M15 in un'unica dashboard. Trailing Stop Basato su ATR – Stop dinamici che si adattano alla volatilità. Dashboard Professional
Tokyo mt5 Indicator
Vasiliy Strukov
5 (3)
Il Tokyo Indicator offre una chiara panoramica visiva della direzione del trend, dei potenziali segnali di trading e delle condizioni di mercato. La sua linea di trend a gradini, codificata a colori, distingue le fasi rialziste (in blu) da quelle ribassiste (in magenta). Frecce direzionali dedicate evidenziano potenziali opportunità di acquisto e vendita al variare del trend visualizzato. Una dashboard integrata riunisce in un'unica visualizzazione pratica il segnale corrente, il bias di mercato
Scalper Vault   è un sistema di scalping professionale che ti fornisce tutto il necessario per scalping di successo. Questo indicatore è un sistema di trading completo che può essere utilizzato dai trader di forex e opzioni binarie. L'intervallo di tempo consigliato è M5. Il sistema fornisce segnali di freccia accurati nella direzione della tendenza. Ti fornisce anche i segnali più alti e più bassi e i livelli di mercato di Gann. Gli indicatori forniscono tutti i tipi di avvisi, comprese le noti
FX Trend MT5 NG
Daniel Stein
5 (6)
FX Trend NG: La Nuova Generazione di Intelligenza di Trend Multi-Mercato Panoramica FX Trend NG è uno strumento professionale di analisi del trend multi-timeframe e monitoraggio dei mercati. Ti consente di comprendere la struttura completa del mercato in pochi secondi. Invece di passare tra numerosi grafici, puoi identificare immediatamente quali strumenti sono in trend, dove il momentum sta diminuendo e dove esiste un forte allineamento tra i timeframe. Offerta di Lancio – Ottieni FX Trend NG
FX Power MT5 NG
Daniel Stein
5 (33)
FX Power: Analizza la Forza delle Valute per Decisioni di Trading Più Intelligenti Panoramica FX Power è lo strumento essenziale per comprendere la reale forza delle principali valute e dell'oro in qualsiasi condizione di mercato. Identificando le valute forti da comprare e quelle deboli da vendere, FX Power semplifica le decisioni di trading e rivela opportunità ad alta probabilità. Che tu segua le tendenze o anticipi inversioni utilizzando valori estremi di Delta, questo strumento si adatta
Smart Price Action Concepts — MetaTrader 5 Osserva la struttura. Identifica le zone. Costruisci il tuo piano di trading. Riunisci Smart Money Concepts (SMC), analisi in stile ICT e azione del prezzo in un grafico organizzato. Identifica la struttura del mercato, gli order block, i livelli di riferimento della liquidità e gli squilibri, poi scegli quali elementi visualizzare tramite lo Smart Panel. ANALIZZA IL MERCATO CON PIÙ STRUTTURA • Struttura del mercato: struttura interna e di swing, HH/HL/
Power Candles MT5
Daniel Stein
4.58 (12)
Power Candles V3 - Indicatore di forza ad ottimizzazione automatica Power Candles V3 trasforma la forza delle valute e degli strumenti in un piano di trading attuabile su ogni grafico a cui è collegato. Invece di limitarsi a colorare le candele, esegue un'auto-ottimizzazione in tempo reale in background e ti fornisce i migliori valori di Stop Loss, Take Profit e soglia di segnale per il simbolo che hai davanti. Basta un clic per adottarlo nel trading live: i raggi di ingresso, Stop Loss e Take P
M1 Quantum MT5
Hamed Dehgani
4.2 (10)
Segnali di Trading Live con M1 Quantum: Segnale   (Operazione eseguita automaticamente dal Quantum Trade Assistant , incluso gratuitamente con questo prodotto.) Ultime notizie: La versione 1.64 è stata rilasciata. Ora tutte le operazioni hanno uno Stop Loss posizionato dietro le relative zone di Supporto/Resistenza. Anche la funzione Smart Close è stata migliorata per aumentare le prestazioni dell'EA in questa versione. Dal 9 agosto, il segnale live è in esecuzione sulla versione 1.64. Piano pr
Market Structure Order Block Dashboard MT5 è un indicatore MT5 progettato per i trader che vogliono leggere la struttura di mercato e le principali zone di reazione del prezzo direttamente sul grafico. Combina BOS, ChoCH, Order Blocks, Fair Value Gaps (FVG), Liquidità, Kill Zones, Volume Profile e un pannello compatto per un'analisi rapida. Questo indicatore è rivolto ai trader che utilizzano la struttura di mercato, i concetti ICT e Smart Money come quadro decisionale. Può aiutare a individuare
Atomic Analyst MT5
Issam Kassas
4.47 (60)
Atomic Analyst — MetaTrader 5 Atomic Analyst riunisce l’azione del prezzo, la direzione del trend, i segnali di entrata e uscita, lo Stop Loss e diversi livelli di Take Profit direttamente sul grafico. INDIVIDUA IL SEGNALE. COMPRENDI IL CONTESTO OPERATIVO. Atomic Analyst organizza la sua analisi in informazioni visive chiare: • Frecce di acquisto e vendita per individuare potenziali entrate. • Stop Loss e diversi livelli di Take Profit per pianificare l’operazione. • Indicazioni di trend, forz
Crystal Heikin Ashi Signals
Muhammad Jawad Shabir
5 (4)
Crystal Heikin Ashi Signals—Professional Trend & Signal Detection Indicator Advanced Heikin Ashi Visualization with Intelligent Signal System for Manual & Automated Trading Final Price: $149 ---------> Price goes up $10 after every 10 sales . Limited slots available — act fast . Overview User Guide PDF Crystal Heikin Ashi Signals is a professional-grade MetaTrader 5 indicator that combines pure Heikin Ashi candle visualization with an advanced momentum-shift detection system. Designed for both m
Divergence Bomber
Ihor Otkydach
4.89 (94)
Ogni acquirente dell’indicatore riceverà inoltre gratuitamente: L’utilità esclusiva “Bomber Utility”, che gestisce automaticamente ogni operazione, imposta i livelli di Stop Loss e Take Profit e chiude le posizioni secondo le regole della strategia I file di configurazione (set file) per adattare l’indicatore a diversi asset I set file per configurare il Bomber Utility in tre modalità: “Rischio Minimo”, “Rischio Bilanciato” e “Strategia di Attesa” Una guida video passo-passo per installare, con
Quant Direction MT5
Georgios Kalomoiropoulos
Quant Direction è uno strumento di analisi di mercato 3D. Offre un'analisi di mercato perfettamente oggettiva, basata su algoritmi, calcolando con precisione le deviazioni percentuali su diversi parametri. Sviluppato utilizzando strumenti di modellazione avanzati basati sull'intelligenza artificiale e rigorosamente testato, questo algoritmo analizza il mercato con una precisione senza pari. È possibile analizzare qualsiasi coppia di valute o strumento finanziario sulla piattaforma. Che si pratic
Altri dall’autore
Liquidity Breaks and Swings
Erik Istvan Fazekas
5 (2)
Consulta "Novità" per una descrizione delle funzioni più recenti. La versione 1.4 è stata solo una pulizia, niente di speciale. //+---------------------------------------------------------------------------------------------------------------+ Ho creato questo perché avevo bisogno di un indicatore frattale personalizzabile. Verifica anche la diminuzione dei volumi per avere una sorta di conferma. Ecco la descrizione: Panoramica Questo indicatore è progettato per aiutare a identificare i punti ch
FREE
Dynamic Volume Profile/Delta Selected Range Volume Delta Profile displays volume distribution and estimated delta within a user-defined chart range. Move or resize the selection rectangle to analyze a different period. The indicator plots the volume profile, positive and negative delta, Point of Control (POC), and Value Area Low and High levels (VVL and VVH). Profiles can be calculated from quote ticks or lower-timeframe bars, with support for tick or real volume when available. Adjustable opti
FREE
Filtro:
Nessuna recensione
Rispondi alla recensione