Dynamic Global Exchange Sessions

Global Exchange Sessions

Global Exchange Sessions is an MQL5 indicator that marks the regular trading hours of the world’s main stock exchanges directly on your chart.

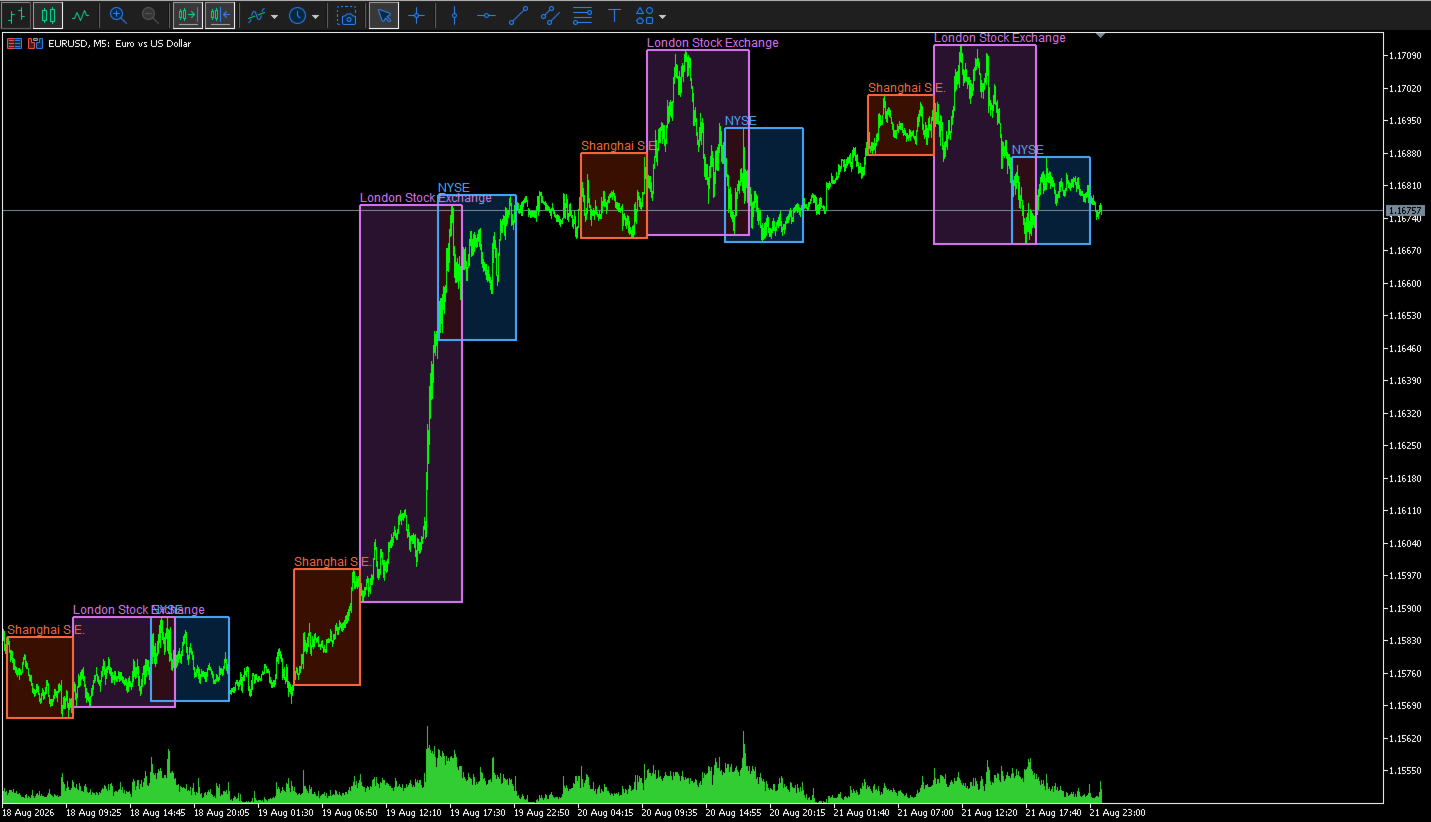
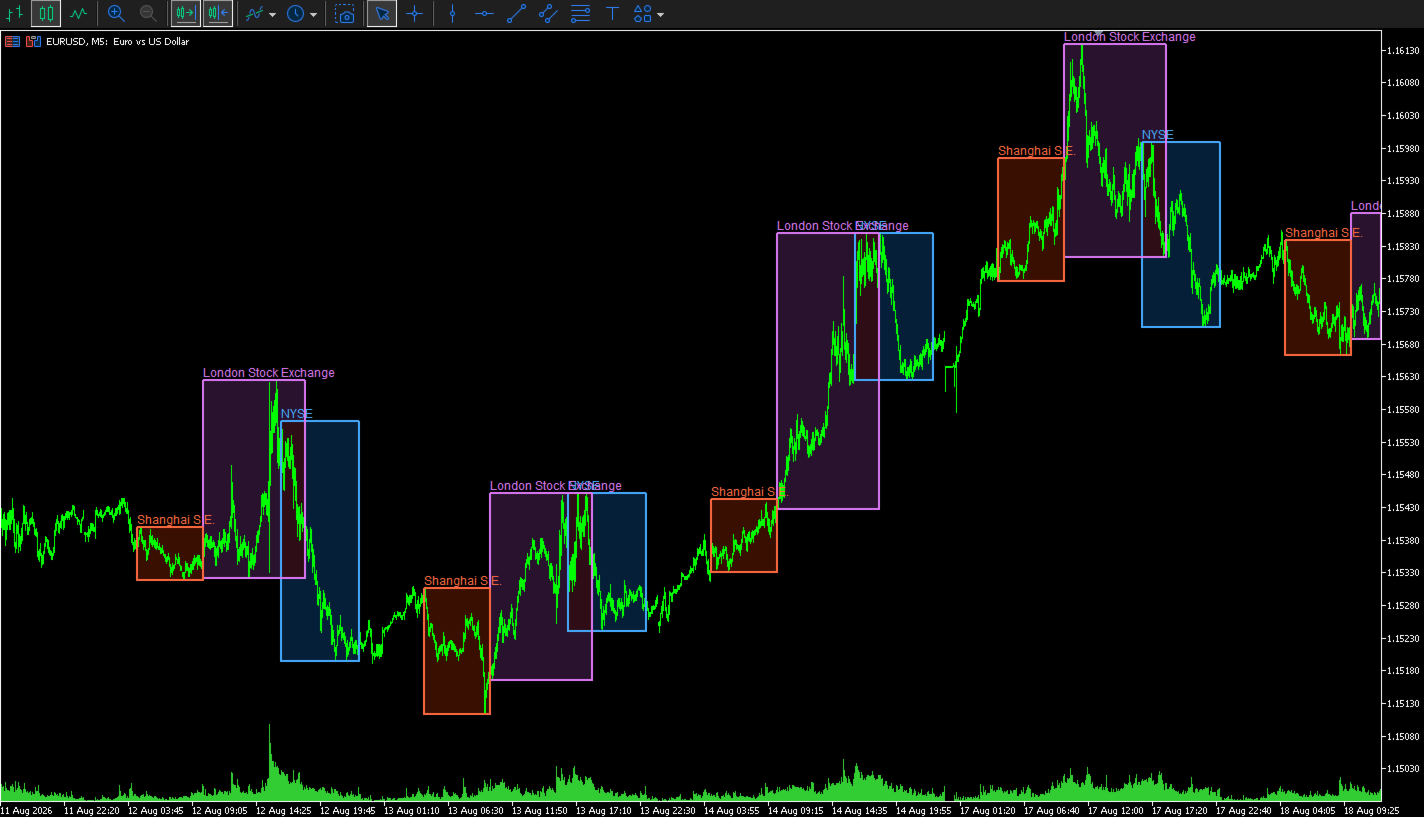
Each session is shown as a colored rectangle. The rectangle starts at the official market open and ends at the official market close. Its upper and lower edges follow the session high and low as new prices arrive.

This makes it easy to see when major equity markets are active, where each session formed its range, and how price reacted when sessions overlapped.

Included exchanges

The indicator supports six stock exchanges:

  • New York Stock Exchange — NYSE

  • London Stock Exchange — LSE

  • Shanghai Stock Exchange — SSE

  • Tokyo Stock Exchange — TSE

  • Hong Kong Stock Exchange — HKEX

  • Euronext

Each exchange can be enabled or disabled separately.

By default, the indicator displays:

  • NYSE

  • London Stock Exchange

  • Shanghai Stock Exchange

Tokyo, Hong Kong, and Euronext are included but disabled by default. You can enable them from the indicator inputs at any time.

Regular session hours

The indicator uses the following regular cash-market hours:

  • NYSE: 09:30–16:00 New York time

  • London Stock Exchange: 08:00–16:30 London time

  • Shanghai Stock Exchange: 09:30–15:00 Shanghai time

  • Tokyo Stock Exchange: 09:00–15:30 Tokyo time

  • Hong Kong Stock Exchange: 09:30–16:00 Hong Kong time

  • Euronext: 09:00–17:30 Central European time

Automatic broker-time conversion

You do not need to calculate the difference between exchange time and broker time.

The indicator reads the broker’s current server time and compares it with GMT. It then converts each exchange session into the time used by your chart.

This is useful because MetaTrader brokers do not all use the same server time. One broker may use UTC, another may use UTC+2, and another may change its server offset during daylight saving time.

Three broker-time modes are available.

Auto Current Offset

This is the default mode.

The indicator calculates the current broker offset from:

TimeTradeServer() - TimeGMT()

The detected offset is used for all displayed sessions.

This mode is suitable when you mainly use the current day or when your broker keeps a fixed UTC offset.

Auto European DST

This mode detects the current broker offset and applies a European daylight-saving schedule to historical dates.

It is useful for brokers that change their server time according to European summer-time rules.

Use this mode when older session rectangles shift by one hour after a daylight-saving change.

Manual Fixed Offset

This mode lets you enter the broker’s UTC offset in minutes.

Examples:

  • UTC: 0

  • UTC+1: 60

  • UTC+2: 120

  • UTC+3: 180

  • UTC-5: -300

This mode is useful when the automatic result does not match your broker or when you use a broker with a fixed server offset.

Exchange daylight saving time

The indicator calculates daylight saving time separately for the exchanges that use it.

It includes:

  • US daylight saving time for NYSE

  • UK daylight saving time for the London Stock Exchange

  • European daylight saving time for Euronext

Shanghai, Tokyo, and Hong Kong use fixed UTC offsets because these locations do not currently change their clocks during the year.

This separate calculation is important during the weeks when the United States and Europe change their clocks on different dates.

Dynamic session highs and lows

The rectangle is not based on a fixed price height.

When a session starts, the indicator reads the price bars inside that session. It finds the highest high and the lowest low, then uses those values as the top and bottom of the rectangle.

While the session is active:

  • A new session high moves the upper edge higher.

  • A new session low moves the lower edge lower.

  • The rectangle keeps its official opening and closing times.

  • The range updates as new price data arrives.

After the session closes, the completed high and low remain visible for the selected history period.

The default calculation timeframe is M1. This gives the indicator a more precise session range, even when it is attached to a higher chart timeframe.

You can change the calculation timeframe if you want to reduce the amount of historical data that MetaTrader must load.

Transparent-style session fills

Each session uses two separate rectangles:

  • A soft background fill

  • A clear foreground border

The fill color is blended with the current chart background. This produces a transparent-style result on both dark and light chart themes.

The default fill opacity is 22%.

You can change the opacity from 0 to 100:

  • 0 makes the fill fully hidden.

  • Lower values create a softer session area.

  • Higher values make the session color stronger.

  • 100 uses the full selected fill color.

The border is not affected by the fill opacity. It remains clear so that the session range is still easy to identify.

By default, fills are drawn behind the candles and borders are drawn in front of the candles.

Session colors

Every exchange has separate fill and border color settings.

The default colors are:

  • NYSE: blue

  • London: purple

  • Shanghai: orange-red

  • Tokyo: yellow

  • Hong Kong: green

  • Euronext: cyan

You can change each color from the indicator inputs.

The fill and border colors do not need to match. For example, you can use a dark blue fill with a bright blue border, or turn the fill off and display only the session outline.

Labels

The indicator can place the exchange name at the upper-left area of each session rectangle.

Labels use the session border color, which helps connect the name with its rectangle.

You can:

  • Show or hide labels

  • Change the label font size

  • Change the label color by changing the session border color

Labels are enabled by default.

Border settings

The session border can be adjusted to match your chart style.

Available settings include:

  • Border color for each exchange

  • Border width

  • Border line style

  • Foreground or background drawing

The default border width is two pixels, which keeps the session outline visible without covering too much price information.

Historical sessions

The History Days input controls how many calendar days the indicator processes.

The default value is 10 days.

A higher value displays more historical sessions, but it also requires more price data and more chart objects.

For normal intraday use, a value between 5 and 20 days is usually sufficient.

Only Monday-to-Friday session dates are processed. Weekend sessions are not drawn.

Refresh rate

The indicator checks active sessions at a regular interval.

The default refresh interval is five seconds.

It also updates when:

  • A new price calculation occurs

  • The chart changes

  • The chart scale or visible area changes

A shorter refresh interval gives faster visual updates but causes MetaTrader to process the session data more often.

Main inputs

General settings

InpHistoryDays

Sets the number of historical calendar days to process.

InpHighLowTimeframe

Sets the timeframe used to calculate each session high and low. The default is M1.

InpRefreshSeconds

Sets the update interval in seconds.

InpShowLabels

Shows or hides exchange names.

InpLabelFontSize

Sets the label text size.

InpFillRectangles

Enables or disables the colored session fills.

InpFillOpacityPercent

Controls the strength of the session fill from 0 to 100.

InpDrawFillBehindCandles

Places the session fill behind the price candles.

InpDrawBordersInForeground

Places session borders in front of the candles.

InpBorderStyle

Sets the border line style.

InpBorderWidth

Sets the border thickness.

Broker-time settings

InpBrokerOffsetMode

Selects automatic current offset, automatic European DST, or manual fixed offset.

InpManualBrokerUTCMinutes

Sets the manual broker UTC offset in minutes.

This value is used when Manual Fixed Offset is selected. It is also used as a fallback if automatic time detection is not available.

Exchange settings

Each exchange has:

  • An enable or disable switch

  • A fill color

  • A border color

This lets you build a simple three-session layout or display all six exchanges.

Suggested setup

For a clean intraday chart, start with the default settings:

  • NYSE enabled

  • London enabled

  • Shanghai enabled

  • All other exchanges disabled

  • M1 high and low calculation

  • 10 history days

  • 22% fill opacity

  • Two-pixel borders

  • Labels enabled

If the chart becomes too busy, reduce the history period or disable the labels.

If the fill is too weak, increase the opacity to approximately 30–35%.

If the fill is too strong, reduce it to approximately 10–15%.

Practical uses

The indicator can help with several types of analysis.

Session range analysis

See the high and low formed during each stock-market session.

Session overlap

Identify periods when two major markets are open at the same time, such as London and New York.

Breakout context

See whether price breaks above or below a completed session range.

Volatility comparison

Compare the size of the Asian, European, and US session ranges.

Intraday support and resistance

Use completed session highs and lows as reference levels for later price action.

Market timing

See which major equity market is active without converting local exchange times manually.

Important notes

The indicator uses regular weekday session schedules.

It does not contain an exchange holiday calendar. It also does not automatically adjust for special early-close days, emergency closures, or temporary exchange schedule changes.

If the chart symbol continues to trade while a stock exchange is closed for a holiday, MetaTrader may still provide price bars during the normal session window. In this case, the indicator can draw a rectangle even though the physical exchange is closed.

Historical accuracy also depends on the price history supplied by your broker. Missing M1 data can prevent a session rectangle from appearing or can produce an incomplete range.

The indicator is designed for visual analysis. It does not provide trading signals, alerts, order execution, or profit guarantees.
Önerilen ürünler
Trading Session MT5
Kevin Schneider
3 (1)
Alım Satım Oturumu Göstergesi Alım Satım Oturumu Göstergesi, Asya, Londra ve New York alım satım oturumlarının başlangıç ve bitiş saatleri ile yüksek ve düşük noktalarını doğrudan grafiğinizde gösterir. Özellikler: Ana alım satım oturumlarının görselleştirilmesi Yüksek ve düşük noktaların vurgulanması Her oturumun başlangıç ve bitiş saatlerinin gösterilmesi Özelleştirilebilir oturum saatleri Kullanıcı dostu ve verimli Özelleştirilebilirlik: Her alım satım oturumu (Asya, Londra, New York) belirli
FREE
Crow s r v1
Cristobal Hidalgo Soriano
S_R_MT5_V1 Professional Support and Resistance indicator for MetaTrader 5 designed for traders looking for fast, clean and visual key market zones. S_R_MT5_V1 automatically detects important support and resistance levels displaying dynamic zones directly on the chart with a modern and optimized visualization for intraday trading and scalping. Perfect for: Scalping Intraday trading Reversal trading Breakouts Institutional zone confirmation Main Features: Automatic support and resistance detectio
FREE
Market Hours Pro
Musa Terrance Khosa
Market Hours Pro shows Tokyo, London, and New York trading sessions directly on your MT5 chart, including scheduled overlap periods. It’s designed to give you a clear view of global market timing so you can plan trades, spot high-activity periods, and align strategies with standard Forex hours. How It Works Displays scheduled session times visually on your chart. Highlights session overlaps for London/New York and Tokyo/London. Automatically adjusts times for your timezone or broker time. Shows
FREE
Multi Currency Strength Dashboard Mini (FREE) – Currency Strength Meter for MetaTrader 5 Multi Currency Strength Dashboard Mini , MetaTrader 5 için ücretsiz bir göstergedir ve 8 ana para biriminin (USD, EUR, GBP, JPY, CHF, CAD, AUD, NZD) göreceli gücünü gerçek zamanlı olarak net ve hızlı okunabilir bir gösterge panelinde sunar. Amaç: birkaç saniye içinde güçlü ve zayıf para birimlerini belirleyerek izleme listenizi yönlendirmek (örneğin, güçlü bir para birimi zayıf bir para birimine karşı olan p
FREE
Pivot Points Daily
Davide Zunino
4.8 (5)
The Indicator show Daily Pivot Points. It is possible to specify the number of days to display. For forex it doesn't consider the sunday session data. It is possibile to modify the color, style and  width for every level. It is better to use this indicator with timeframe not higher than Н1. 4 Levels of support and resistance with also Intermediate Levels that is possible to hide.
FREE
主要城市的时间。北京时间、东京时间、悉尼时间、惠灵顿时间、纽约时间、法兰克福时间、伦敦时间、迪拜时间。 城市时间可选择开启或者关闭。 点差变色提醒。设置点差提醒点数,例如,设置100点,点差大于100点,文字会变红色。 Time in major cities. Beijing time, Tokyo time, Sydney time, Wellington time, New York time, Frankfurt time, London time, Dubai time. City time can be turned on or off. Dot difference color change reminder. Set the point difference reminder points. For example, set 100 points. If the point difference is greater than 100 points, the text will turn red.
FREE
SESSION SUHUTRADE: Master the Market Hours with Precision Are you tired of missing out on high-probability setups during specific trading sessions? Do you struggle to identify when the Asian, London, or New York markets are truly active and presenting the best opportunities? Introducing SESSION SUHUTRADE , the ultimate MQL5 indicator designed to give you unparalleled clarity over the global trading sessions. This powerful tool automatically detects and highlights the exact market hours for Asia,
FREE
The "Session Time Vertical Lines" indicator displays vertical lines on the chart that mark the beginning and end of major global trading sessions: Sydney, Tokyo, London, and New York . It is designed to help traders visually identify active market hours, overlaps, and potential high-volume periods directly on the price chart. This tool is especially useful for intraday traders who rely on market session timing to plan entries and exits. Inputs / Settings Parameter Name Description DaysToDraw Num
FREE
this free candle stick timer works on all symbol and all timeframe, in dicator help you to see remain time in hours, minutes, seonds until it close, it is simple and easy to use  and very light, it doesn't not consume much RAM, CPU. you can change font size and can change color of the indicator and what time frame you want it to work on, you also can choose to disable it on specifix time frame.
FREE
Smart FVG Stats
- Md Rashidul Hasan
5 (1)
The  Smart FVG Statistics Indicator  is a powerful MetaTrader 5 tool designed to automatically identify, track, and analyze Fair Value Gaps (FVGs) on your charts. Love it? Hate it? Let me know in a review! Feature requests and ideas for new tools are highly appreciated. :) Try "The AUDCAD Trader": https://www.mql5.com/en/market/product/151841 Key Features Advanced  Fair Value Gap  Detection Automatic Identification : Automatically scans for both bullish and bearish FVGs across specified histo
FREE
ZigZag Support and Resistance Levels
Tshidiso Ephraim Mpakanyane
2 (1)
ZigZag Support and Resistance Levels (v2.0)  MetaTrader 5 için, ZigZag pivot noktalarına dayalı destek ve direnç seviyelerini belirleyen bir göstergedir. Artık grafik üzerinde doğrudan kullanılabilen etkileşimli bir kontrol paneline sahiptir. Fiyatın birden fazla kez tepki verdiği bölgeleri görselleştirmeye yardımcı olmak için birbirine yakın seviyeleri bir kümeleme yöntemiyle bölgeler halinde gruplandırır ve kırılmış (breakout) seviyeleri aktif (extension) seviyelerden ayırt eder. Temel Özelli
FREE
Support And Resistance indicator that can display round levels and zones . It shows them directly on the chart, providing an easy help when you want to set stop-loss or take-profit level, or when you want to see the next market target.   If an asset price is moving down and bounces back up, the level is called support (think: price floor). If an asset price is moving upward and hits a level where it reverses downward, this is called resistance (think: price ceiling).
FREE
This Small tool allows you to define a time counter in minutes for the closing of your positions according to the number of minutes you have set. For example if you set it to 30 Min, the tool will close each open position after 30 minutes from its opening. The settings ACTIVE: It is to activate the tool and use it to close your positions after the number of minutes defined. MANAGE: you to choose with the symbols managed by the tool. Choose "ALL CURENCY" if you want the system to apply to
FREE
ÜCRETSİZ — Donchian kırılım kanalı ve kırılımdan sonra işlemi yöneten ATR takip eden stop, aynı grafik üzerine çizilir. Çoğu kırılım göstergesi size girişi gösterir ve orada durur. Trend takibinin zor kısmı sonrasında olanlardır: stop nereye konur, ne zaman yukarı çekilir ve hareket ne zaman biter. Bu gösterge sistemin her iki yarısını da çizer. === NE ÇİZER === - Son N kapanmış bar üzerinden Donchian kanalı (üst ve alt). - Bir barın kanalın dışında KAPANDIĞI yerde altın renkli oklar — bir kırı
FREE
Trend View
Emanuele Cartelli
Trend View is a simple indicator that shows in a text the trend of the current currency in the timeframe you choose. Inputs are: Color: color of the text. Timeframe: timeframe for calculations. Trend can be: UP: bullish trend. DOWN: bearish trend. ---: trend not defined. You can use this indicator to show the main trend of a bigger timeframe helping you to choose your trades. Note: text is draggable.  
FREE
DC Indicator
Lamont Simone Reynecke
The donchian channel indicator might just be the best fit for you Trading in derivative products such as futures, options, CFD's, forex and certificates contains significant risk. These products are not suitable for every investor. Investors could potentially lose all or more than the original investment. If anything, only money equal to personal risk capital should be used and can be lost without jeopardizing financial security or lifestyle. Partially or fully automated trading programs can
FREE
AI London Session Range Indicator automatically draws the London session's opening range as a box on your chart, giving breakout and session traders an instant, objective reference for the high-volatility window that sets the tone for the rest of the trading day. The indicator tracks the exact high and low reached during the configured opening-range window after the London session start, plots it as a shaded box, and keeps it visible for the rest of the session so you can watch for breakouts, re
FREE
Neon Profile
Manuel Fernandez Barranco
XBK Neon Profile MT5 Developed by XBK Systems. XBK Neon Profile is an advanced technical indicator for MetaTrader 5 that combines smoothed trend analysis and a dynamic volume profile within a single chart window. The indicator is designed to provide a clear view of market structure and significant volume levels without cluttering the screen. Key Features Smoothed Trend Bands (Neon Trend Bands) Identifies the current trend direction using a custom smoothing algorithm designed to filter out market
FREE
Cybertrade Keltner Channels - MT5 Created by Chester Keltner, this is a volatility indicator used by technical analysis. It is possible to follow the trend of financial asset prices and generate support and resistance patterns. In addition, envelopes are a way of tracking volatility in order to identify opportunities to buy and sell these assets. It works on periods longer than the period visible on the chart. All values ​​are available in the form of buffers to simplify possible automations.
FREE
(Special New Year promotion - free price!) The indicator displays the actual 'Scale in points per bar' (identical to the manual setting in the Terminal, see screenshot) in the upper right corner of the chart. The displayed value changes INSTANTLY whenever the chart scale is changed! (This is very convenient when planning screenshots). In Settings: Change language (Russian/English), font size of the displayed text, text label offset coefficient from the graph corner, equally in X and Y directi
FREE
Easy SMC Trading
Israr Hussain Shah
3.8 (5)
Otomatik Risk/Ödül ve Yapı Kırılması (BOS) Tarayıcılı Yapı Trendi Sürüm: 1.0 Genel Bakış Otomatik Risk/Ödül ile Yapı Trendi, Fiyat Hareketine ve Piyasa Yapısına dayanan yatırımcılar için tasarlanmış kapsamlı bir işlem sistemidir. Yüksek olasılıklı işlem kurulumları oluşturmak için düzeltilmiş bir trend filtresini, Swing Noktası tespiti ve Yapı Kırılması (BOS) sinyalleriyle birleştirir. Bu aracın öne çıkan özelliği Otomatik Risk Yönetimidir. Geçerli bir Yapı Kırılması tespit edildiğinde, göste
FREE
Forex17 Bollinger Channel
Robinson Alves Lemos
5 (1)
Bu gösterge, Bollinger tarzı bir volatilite kanalının yalnızca üst ve alt bantlarını gösterir; orta hareketli ortalama çizilmez. Temel amacı, kullanıcının fiyatın kanal sınırlarıyla etkileşimine odaklanmasını sağlarken grafik düzeni ve görselliği üzerinde tam kontrol sunan temiz ve esnek bir volatilite zarfı sağlamaktır. Geleneksel Bollinger Bantlarında orta hareketli ortalama her zaman gösterilirken, bu göstergede yalnızca hesaplama amacıyla kullanılır. Orta çizgi, görsel karmaşayı azaltmak ve
FREE
Candle Timer Simple
Jithin Sajan Sajan
5 (1)
SETTINGS Make sure to select Chart shift option in the chart.   (Right click in the chart ---> Properties (dialog box) ----> Select Chart Shift) Kindly rate and comment about the product for upgradation & Support When using candlestick timers, keep in mind that the timing of candlestick patterns can play a crucial role in your trading strategy. For instance, different timeframes (such as 1-minute, 5-minute, hourly, ) can provide varying insights into price movements and trends. Make sure to i
FREE
This Mt5 Indicator Signals when there is two opposite direction bars engulfed by current bar.  has a recent Exponential Moving Average Cross and past bar was oversold/bought Expert Advisor Available in Comments  Free Version Here : https://www.mql5.com/en/market/product/110114?source=Site&nbsp ; Full Alerts for mt5 terminal , phone , email, print to file, print to journal  Buy Signal ( blue line ) Past ema cross ( set at 30 bars back ) Past bar rsi is oversold ( level 40  ) Engulfing bar closes
FREE
WH Price Wave Pattern MT5
Wissam Hussein
4.15 (13)
Fiyat Dalga Modeli   MT5 --(ABCD Modeli)--   hoş geldiniz ABCD modeli, teknik analiz dünyasında güçlü ve yaygın olarak kullanılan bir ticaret modelidir. Tüccarların piyasadaki potansiyel alım ve satım fırsatlarını belirlemek için kullandıkları uyumlu bir fiyat modelidir. ABCD modeliyle, tüccarlar potansiyel fiyat hareketlerini tahmin edebilir ve alım satımlara ne zaman girip çıkacakları konusunda bilinçli kararlar verebilir. EA Sürümü: Price Wave  EA MT5 MT4 Sürümü :   Price Wave Pattern MT4
FREE
Smc Session Killzone and Breakout The Smc Session Killzone and Breakout indicator automates the institutional session trading model for MetaTrader 5. It draws the Asian, London, and New York session ranges as labelled boxes on the chart, detects when price sweeps beyond the Asian session high or low, and fires a non-repainting entry signal after a Market Structure Shift is confirmed. All signals are based on closed bars and do not repaint. The underlying model follows the sequence that institut
FREE
HammerStar
Arismario Verissimo Neves
3.4 (5)
The HammerStar indicator is designed to search for the Hammer and Shooting Star patterns on charts of any currency pairs. Hammer Downward trend. The lower shadow is not less than 2 and no more than 3 times larger than the body. There is no upper shadow, or it is very short (no more than 10% of the candlestick range). The color of the body in the long game is not important, with the short - white hammer is much stronger than the black one. Confirmation is suggested. Shooting Star Uptrend. The u
FREE
See the Asia, London and New York sessions at a glance: range boxes with their size in pips or points, optional ICT killzones and a live session panel that shows what is open now, how far it has moved and when the next session starts. Clean, automatic and correct for every broker time zone. SESSIONS - Asia, London and New York drawn as range boxes from the session high to the session low. - 50% level of every session as a subtle dotted line. - Session name and range (pips or points) on each box
FREE
The "Support Resistance Dynamic" indicator is a powerful technical analysis tool for the MetaTrader 5 platform, designed to automatically identify and plot dynamic Support and Resistance zones on price charts. This indicator helps traders easily recognize important price levels, potential reversal points, or breakout areas, thereby enabling more informed trading decisions. 2. Key Features Dynamic S/R Identification : Automatically identifies support and resistance zones based on an advanced Pivo
FREE
ICT Killzones and Liquidity Levels is a clean chart tool that marks the main ICT killzones and key liquidity levels directly on your chart. It is designed for traders who follow Smart Money Concepts and ICT-style price action and want a simple, non-repainting reference on the chart. The indicator draws the Asian, London, New York and London Close killzones as boxes based on the session high and low. A vertical line marks the start of each killzone for the current day, so you can see when each se
FREE
Bu ürünün alıcıları ayrıca şunları da satın alıyor
Trend Sniper X
Sarvarbek Abduvoxobov
4.9 (40)
Trend Sniper X , tüccarların trend yönünü ve olası dönüş noktalarını netlik ve hassasiyetle belirlemelerine yardımcı olan MetaTrader 5 için çoklu zaman dilimli bir trend takip göstergesidir. MT4 için: https://www.mql5.com/en/market/product/193245 Fiyat Bilgisi: Mevcut fiyat tanıtım amaçlıdır ve gelecek güncellemeler ile yeni özellikler yayınlandıkça değişebilir. Bonus Fırsatı: Bu indikatör için ÜCRETSİZ Oto-Trade Assistant EA'yı almak için lütfen satın aldıktan sonra yazara mesaj gönderin. Code
Smart Trend Trading System — MetaTrader 5 Satın aldıktan sonra Smart Universal Expert Advisor'ı ÜCRETSİZ edinmek ve beraberinde çevrimiçi kurs, PDF kılavuzu ve özel gruba erişim almak için MQL5 üzerinden bana mesaj gönderin. STTS; trend yönünü, giriş ve çıkış sinyallerini, dönüş bölgelerini ve önemli fiyat seviyelerini doğrudan grafiğinizde bir araya getirir. Sistemi manuel işlemler için kullanabilir veya ayrı bir uyumlu EA’yı bağlayarak seçtiğiniz ayarlarla otomatik işlem gerçekleştirebilirsini
ARIPoint
Temirlan Kdyrkhan
1 (4)
ARIPoint is a powerful trading companion designed to generate high-probability entry signals with dynamic TP/SL/DP levels based on volatility. Built-in performance tracking shows win/loss stats, PP1/PP2 hits, and success rates all updated live. Key Features: Buy/Sell signals with adaptive volatility bands Real-time TP/SL/DP levels based on ATR Built-in MA Filter with optional ATR/StdDev volatility Performance stats panel (Success, Profit/Loss, PP1/PP2) Alerts via popup, sound, push, or email Cu
Zoryk Gold
Reda El Koutbane
5 (15)
ZORYK — MetaTrader 5 İçin Gelişmiş XAUUSD Sinyal Sistemi Bu hissi biliyorsunuz. Altını analiz etmek için uzun zaman harcarsınız. Doğru giriş noktasını beklersiniz. Sonunda işlemi açarsınız ve fiyat hemen aleyhinize hareket etmeye başlar. İşlemi çok erken kapatırsınız, Stop Loss seviyesini değiştirirsiniz veya birkaç saniye tereddüt edersiniz. Daha sonra piyasa, başlangıçta beklediğiniz hedefe tam olarak ulaşır; ancak siz artık işlemin içinde değilsinizdir. Sorun her zaman yön değildi. Asıl sorun
SuperScalp Pro
Van Minh Nguyen
4.66 (35)
SuperScalp Pro - Professional Multi-Layer Confluence Scalping System SuperScalp Pro, klasik Supertrend'i birden fazla akıllı doğrulama filtresiyle geliştiren gelişmiş bir scalping göstergesidir. Daha yüksek olasılığa sahip Buy/Sell fırsatlarını belirlemenize yardımcı olurken yanlış sinyalleri önemli ölçüde azaltır. Net Buy ve Sell okları doğrudan grafik üzerinde görüntülenir ve ATR tabanlı Stop Loss ile Take Profit seviyeleri gerçek zamanlı olarak otomatik şekilde hesaplanır. Satın aldıktan sonr
Gann Made Easy , bay teorisini kullanarak ticaretin en iyi ilkelerine dayanan, profesyonel ve kullanımı kolay bir Forex ticaret sistemidir. WD Gann. Gösterge, Zararı Durdur ve Kâr Al Seviyeleri dahil olmak üzere doğru SATIN AL ve SAT sinyalleri sağlar. PUSH bildirimlerini kullanarak hareket halindeyken bile işlem yapabilirsiniz. Satın alma işleminden sonra, alım satım talimatlarını ve harika ek göstergeleri ücretsiz olarak almak için lütfen benimle iletişime geçin! Muhtemelen Gann ticaret yöntem
SMC Intraday Formula
VividMind Digital Solutions
5 (26)
Önce dürüst olalım. Hiçbir gösterge tek başına sizi kârlı yapmaz. Eğer biri size aksini söylüyorsa, size bir hayal satıyordur. Mükemmel al/sat okları gösteren her gösterge, kusursuzmuş gibi görünecek şekilde yapılabilir — sadece geçmişin doğru bir bölümünü yakınlaştırıp kazanan işlemleri ekran görüntüsü almanız yeterlidir. Biz bunu yapmıyoruz.  SMC Intraday Formula bir araçtır. Piyasa yapısını sizin için okur, en yüksek olasılıklı fiyat bölgelerini belirler ve şu anda akıllı paranın izinin nası
GoldenX Entry MT5
VividMind Digital Solutions
5 (16)
GoldenX Entry, adaptif Smart Entry Trend algoritmasına, sinyal skorlaması sistemine, piyasa rejimi algılayıcısına ve volatilite filtresine sahip bir MT5 indikatörüdür. Her sinyal; hesaplanmış bir giriş seviyesi, üç adet Take-Profit seviyesi (TP1, TP2, TP3) ve bir Stop-Loss seviyesi içerir. Farklı piyasa koşullarına uyum sağlamak için tasarlanmış çok katmanlı analitik yapı üzerine kuruludur ve yerleşik optimizasyon aracı ile istatistik takip sistemini birleştirir. Risk-ödül (RR) metrikleri ve geç
Şehre yeni bir Kral geldi - Gösterge + Emir Yönetimi göstergeleri (TP1 + TP2 + TP3) + Opsiyonel Telegram Sinyal Gönderici DAHİL (ÜCRETSİZ) (TAM TRADING ve SİNYAL SİSTEMİ) Altın için en iyi EA’mız: Gold Slayer Bu gösterge; gelişmiş bir strateji, özelleştirilebilir emir yönetimine sahip bir trading sistemi ve envelope uzantılarını birleştiren bir mean reversion sistemi içerir. Ayrıca RSI gibi birçok akıllı onay filtresiyle desteklenerek yüksek olasılıklı dönüş girişlerini AL ve SAT sinyalleriyle y
Neuro Poseidon MT5
Daria Rezueva
4.75 (52)
Neuro Poseidon is a new indicator by Daria Rezueva. It combines precise trading signals with adaptive TP/SL levels - creating best possible trades as a result! Message me and get  Neuro Poseidon Assistant  as a gift to automize your trading process! What makes it stand out? 1. Proven profitability on all assets and timeframes 2. Only confirmed BUY and SELL signals present on the chart 3. Adaptive TP & SL levels generated by the software for each trade 4. Easy to understand - suitable for al
Auto Optimized SpeedAngle , sürekli İleriye Dönük Optimizasyon (Walk-Forward Optimization, WFO) yoluyla eğri uydurmayı (curve-fitting) ortadan kaldıran kurumsal düzeyde bir momentum vektörleme sistemidir. Piyasa rejimleri değiştiğinde etkinliğini yitiren statik girdilere güvenmek yerine, gösterge, örneklem dışı (Out-of-Sample, OOS) doğrulama kullanarak parametrelerini dinamik olarak yeniden kalibre eder ve böylece gösterilen sinyallerin geçmişteki rastgele anomalileri değil, gerçek bir istatisti
Efsane geri dönüyor: Entry Points Pro 10. MQL5 Market'te 3 yıl boyunca ilk 3'te kalan efsanevi indikatörün yeniden lansmanı. Yüzlerce övgü dolu yorum (iki sürümde toplam 589), her gün binlerce trader onunla işlem yapıyor, 31.000+ demo indirmesi   MT4+MT5 . Beş yıl boyunca yazdığınız her yorumu okudum — ve söz vermek yerine yanıtları 10. sürümün içine işledim. 1999'dan beri piyasada olan ve dürüstlüğe, itibarına ve müşterilerine değer veren bir yazardan. Entry Points Pro, işleme giriş sinyallerin
FiboSniper Pro
Van Minh Nguyen
5 (3)
FiboSniper Pro – Multi-Filter Fibonacci System with Auto SL/TP and Control Panel FiboSniper Pro, seçilmiş Buy ve Sell sinyalleri üretmek için dinamik Fibonacci Envelopes ile birden fazla doğrulama filtresini birleştiren teknik bir göstergedir. Fibonacci seviyeleri Moving Average ve ATR temel alınarak hesaplanır ve ardından ADX, EMA, RSI, ATR, Volume, Time ve Candle yapısı ile filtrelenir. Gösterge, ATR tabanlı otomatik Stop Loss ve Take Profit seviyelerini doğrudan grafik üzerinde görüntüler ve
Welcome to ENTRY IN THE ZONE AND SMC MULTI TIMEFRAME SPECIAL BENEFIT / FOR OUR MQL5 CUSTOMERS FREE ACCESS TO THE NEW TOOL  — COMING SOON — Learn more on our official website  : https://www.fableedge.net Entry In The Zone and SMC Multi Timeframe is a real-time market analysis tool based on Smart Money Concepts (SMC), designed to analyze market structure, price direction, and key trading zones. It supports both Single-Timeframe Analysis and Multi-Timeframe Analysis, providing a clearer view of the
Unix Scalper
Issam Kassas
4 (4)
Unix Scalper — MetaTrader 5 Satın aldıktan sonra Smart Universal Expert Advisor'ı ÜCRETSİZ edinmek ve beraberinde çevrimiçi kurs, PDF kılavuzu ve özel gruba erişim almak için MQL5 üzerinden bana mesaj gönderin. İşlem fırsatını belirleyin. Planı görün. Nasıl işlem yapacağınıza karar verin. UNIX Scalper; piyasa analizini, BUY/SELL/WAIT kararlarını ve Entry, Stop Loss, TP1 ve TP2 seviyelerini düzenli bir panelde bir araya getirir. SİNYALİ VE PLANI GÖRÜN • Net kararlar: BUY, SELL veya WAIT. • Belir
M1 Sniper MT5
Oleg Rodin
5 (7)
M1 SNIPER   kullanımı kolay bir işlem göstergesi sistemidir. M1 zaman dilimi için tasarlanmış bir ok göstergesidir. Gösterge, M1 zaman diliminde scalping için bağımsız bir sistem olarak kullanılabilir ve mevcut işlem sisteminizin bir parçası olarak kullanılabilir. Bu işlem sistemi özellikle M1'de işlem yapmak için tasarlanmış olsa da, diğer zaman dilimleriyle de kullanılabilir. Başlangıçta bu yöntemi XAUUSD ve BTCUSD ticareti için tasarladım. Ancak bu yöntemi diğer piyasalarda işlem yaparken de
Adaptive Price Action Engine Göstergeyi al, EA'sı (Uzman Danışman) bedava gelsin Kendi Kendini Optimize Eden Multi-Timeframe Trend ve Mum Formasyonu Analizi Piyasalar sürekli değişir ve her Price Action formasyonu her piyasa koşulunda aynı değere sahip değildir. Adaptive Price Action Engine , değişen piyasa koşullarına uyum sağlamak amacıyla trend yapısını, Multi-Timeframe analizini, mum formasyonlarını ve istatistiksel optimizasyonu tek bir analiz sistemi içerisinde birleştirir. İki Adaptif Mod
Gold Entry Sniper
Tahir Mehmood
5 (21)
Gold Entry Sniper – Altın Scalping & Swing Trading için Profesyonel Çoklu Zaman Çerçeveli ATR Paneli Gold Entry Sniper , XAUUSD ve diğer enstrümanlar için doğru al/sat sinyalleri veren, ATR Trailing Stop mantığı ve çoklu zaman çerçevesi analizi ile geliştirilmiş gelişmiş bir MetaTrader 5 göstergesidir. Temel Özellikler ve Avantajlar Çoklu Zaman Çerçevesi Analizi – M1, M5, M15 trendlerini tek panelde gösterir. ATR Tabanlı Trailing Stop – Volatiliteye göre dinamik olarak ayarlanır. Profesyonel Gra
Tokyo mt5 Indicator
Vasiliy Strukov
5 (7)
Tokyo Indicator; trend yönü, potansiyel işlem sinyalleri ve piyasa koşulları hakkında net ve görsel bir genel bakış sunar. Renk kodlu ve kademeli trend çizgisi, yükseliş evrelerini (mavi) düşüş evrelerinden (macenta) ayırt eder. Trend değiştiğinde, buna karşılık gelen yön okları potansiyel alım ve satım fırsatlarını vurgular. Entegre bir panel; mevcut sinyali, piyasa eğilimini, momentumu, volatiliteyi ve sinyal kalitesini tek bir kullanışlı görünümde bir araya getirir. Bu sayede yatırımcılar, fa
Scalper Vault , başarılı bir scalping için ihtiyacınız olan her şeyi size sağlayan profesyonel bir scalping sistemidir. Bu gösterge, forex ve ikili opsiyon tüccarları tarafından kullanılabilecek eksiksiz bir ticaret sistemidir. Önerilen zaman çerçevesi M5'tir. Sistem size trend yönünde doğru ok sinyalleri sağlar. Ayrıca size üst ve alt sinyaller ve Gann piyasa seviyeleri sağlar. Göstergeler, PUSH bildirimleri dahil her türlü uyarıyı sağlar. Göstergeyi satın aldıktan sonra lütfen benimle iletişim
FX Trend MT5 NG
Daniel Stein
5 (6)
FX Trend NG: Yeni Nesil Çoklu Piyasa Trend Zekâsı Genel Bakış FX Trend NG , çoklu zaman dilimlerinde çalışan profesyonel bir trend analiz ve piyasa izleme aracıdır. Piyasanın yapısını saniyeler içinde anlamanızı sağlar. Birden fazla grafik arasında geçiş yapmak yerine, hangi enstrümanların trendde olduğunu, momentumun nerede zayıfladığını ve hangi zaman dilimlerinin uyumlu olduğunu anında görebilirsiniz. Lansman Teklifi – FX Trend NG sadece $30 (6 Ay) veya $80 Ömür Boyu Lisans ile edinin. Zate
FX Power MT5 NG
Daniel Stein
5 (33)
FX Power: Daha Akıllı Ticaret Kararları için Para Birimlerinin Gücünü Analiz Edin Genel Bakış FX Power , her piyasa koşulunda başlıca para birimlerinin ve altının gerçek gücünü anlamak için vazgeçilmez bir araçtır. Güçlü para birimlerini alıp zayıf olanları satarak, FX Power ticaret kararlarınızı basitleştirir ve yüksek olasılıklı fırsatları ortaya çıkarır. İster trendlere sadık kalın ister Delta'nın aşırı değerlerini kullanarak tersine dönüşleri öngörün, bu araç ticaret tarzınıza mükemmel bir
Smart Price Action Concepts — MetaTrader 5 Satın aldıktan sonra Smart Universal Expert Advisor'ı ÜCRETSİZ edinmek ve beraberinde çevrimiçi kurs, PDF kılavuzu ve özel gruba erişim almak için MQL5 üzerinden bana mesaj gönderin. Yapıyı görün. Bölgeleri belirleyin. İşlem planınızı oluşturun. Smart Money Concepts (SMC), ICT tarzı analiz ve fiyat hareketini düzenli bir grafikte birleştirin. Piyasa yapısını, emir bloklarını, likidite referans seviyelerini ve dengesizlikleri belirleyin; ardından Smart P
Power Candles MT5
Daniel Stein
4.58 (12)
Power Candles V3 - Kendi Kendini Optimize Eden Güç Göstergesi Power Candles V3, döviz ve enstrüman gücünü, eklendiği her grafikte eyleme geçirilebilir bir ticaret planına dönüştürür. Sadece mumları renklendirmek yerine, arka planda canlı bir otomatik optimizasyon çalıştırır ve önünüzdeki sembol için en iyi Stop Loss, Take Profit ve sinyal eşiğini size sunar. Tek bir tıklama ile canlı ticarete uyarlanır - giriş, Stop Loss ve Take Profit ışınları grafikte tam fiyatlarla görünür ve uyarılar yön bil
M1 Quantum MT5
Hamed Dehgani
4.2 (10)
M1 Quantum ile Canlı İşlem Sinyalleri : Sinyal   (İşlem otomatik olarak Quantum Trade Assistant tarafından gerçekleştirilmiştir ve bu ürüne ücretsiz olarak dahildir.) Son Haberler: Sürüm 1.64 yayınlandı. Artık tüm işlemlerde Stop Loss, ilgili Destek/Direnç bölgelerinin arkasına yerleştiriliyor. Bu sürümde EA'nın performansını artırmak için Smart Close fonksiyonu da geliştirildi. 9 Ağustos'tan bu yana canlı sinyal Sürüm 1.64 üzerinde çalışıyor. Fiyat Planı: Güncel Fiyat: $169 (Erken kullanıcı te
Market Structure Order Block Dashboard MT5, piyasa yapısını ve ana fiyat reaksiyon bölgelerini doğrudan grafikte okumak isteyen traderlar için tasarlanmış bir MT5 göstergesidir. BOS, ChoCH, Order Blocks, Fair Value Gaps (FVG), Likidite, Kill Zones, Volume Profile ve hızlı analiz için kompakt bir paneli bir araya getirir. Bu gösterge, piyasa yapısını, ICT ve Smart Money kavramlarını karar çerçevesi olarak kullanan traderlara yöneliktir. Trend devamlarını, olası tersine dönüşleri, fiyat dengesizli
Atomic Analyst MT5
Issam Kassas
4.47 (60)
Atomic Analyst — MetaTrader 5 Satın aldıktan sonra Smart Universal Expert Advisor'ı ÜCRETSİZ edinmek ve beraberinde çevrimiçi kurs, PDF kılavuzu ve özel gruba erişim almak için MQL5 üzerinden bana mesaj gönderin. Atomic Analyst; fiyat hareketini, trend yönünü, giriş ve çıkış sinyallerini, Stop Loss ve birden fazla Take Profit seviyesini doğrudan grafiğinizde bir araya getirir. SİNYALİ GÖRÜN. İŞLEM KOŞULLARINI ANLAYIN. Atomic Analyst, analizini anlaşılır görsel bilgiler halinde sunar: • Olası gir
Crystal Heikin Ashi Signals
Muhammad Jawad Shabir
5 (4)
Crystal Heikin Ashi Signals—Professional Trend & Signal Detection Indicator Advanced Heikin Ashi Visualization with Intelligent Signal System for Manual & Automated Trading Final Price: $149 ---------> Price goes up $10 after every 10 sales . Limited slots available — act fast . Overview User Guide PDF Crystal Heikin Ashi Signals is a professional-grade MetaTrader 5 indicator that combines pure Heikin Ashi candle visualization with an advanced momentum-shift detection system. Designed for both m
Divergence Bomber
Ihor Otkydach
4.89 (94)
Bu göstergeyi satın alan herkese aşağıdaki ekstra içerikler ücretsiz olarak sunulmaktadır: Her işlemi otomatik olarak yöneten, Stop Loss ve Take Profit seviyelerini ayarlayan ve işlemleri strateji kurallarına göre kapatan özel yardımcı araç: "Bomber Utility" Göstergenin farklı varlıklar üzerinde kullanılmasına yönelik ayar dosyaları (set dosyaları) Bomber Utility için 3 farklı modda kullanım sunan ayar dosyaları: "Minimum Risk", "Dengeli Risk" ve "Bekle-Gör Stratejisi" Bu ticaret stratejisini
Quant Direction MT5
Georgios Kalomoiropoulos
Quant Direction, 3 boyutlu bir piyasa analiz aracıdır. Çeşitli parametrelerdeki yüzdesel sapmaları hassas bir şekilde hesaplayan, tamamen objektif, algoritma tabanlı piyasa analizi sunar. Gelişmiş yapay zeka tabanlı modelleme araçları kullanılarak geliştirilen ve titizlikle test edilen bu algoritma, piyasayı benzersiz bir hassasiyetle analiz eder. Platformda herhangi bir döviz çiftini veya finansal enstrümanı analiz edebilirsiniz. İster kısa vadeli, ister günlük, isterse swing trading yapın, Qua
Yazarın diğer ürünleri
Yenilikleri görmek için "Neler Yeni" bölümüne göz atın. v1.4 sadece küçük düzenlemeler içeriyor, özel bir şey yok. Bu göstergede özelleştirilebilir bir fraktal göstergesine ihtiyaç duyduğum için bunu oluşturdum. Aynı zamanda azalan hacimleri kontrol ederek bir tür onay sağlar. Aşağıda detaylar mevcut: Genel Bakış Bu gösterge, fiyat hareketi ve hacim dinamiklerini analiz ederek piyasadaki anahtar dönüm noktalarını belirlemeye yardımcı olur. Özellikler Gösterge stratejisinin temeli, genellikle öne
FREE
Dynamic Volume Profile/Delta Selected Range Volume Delta Profile displays volume distribution and estimated delta within a user-defined chart range. Move or resize the selection rectangle to analyze a different period. The indicator plots the volume profile, positive and negative delta, Point of Control (POC), and Value Area Low and High levels (VVL and VVH). Profiles can be calculated from quote ticks or lower-timeframe bars, with support for tick or real volume when available. Adjustable opti
FREE
Filtrele:
Değerlendirme yok
Değerlendirmeye yanıt