Dynamic Global Exchange Sessions
- 指标
- 版本: 1.13
- 更新: 12 九月 2026

Global Exchange Sessions
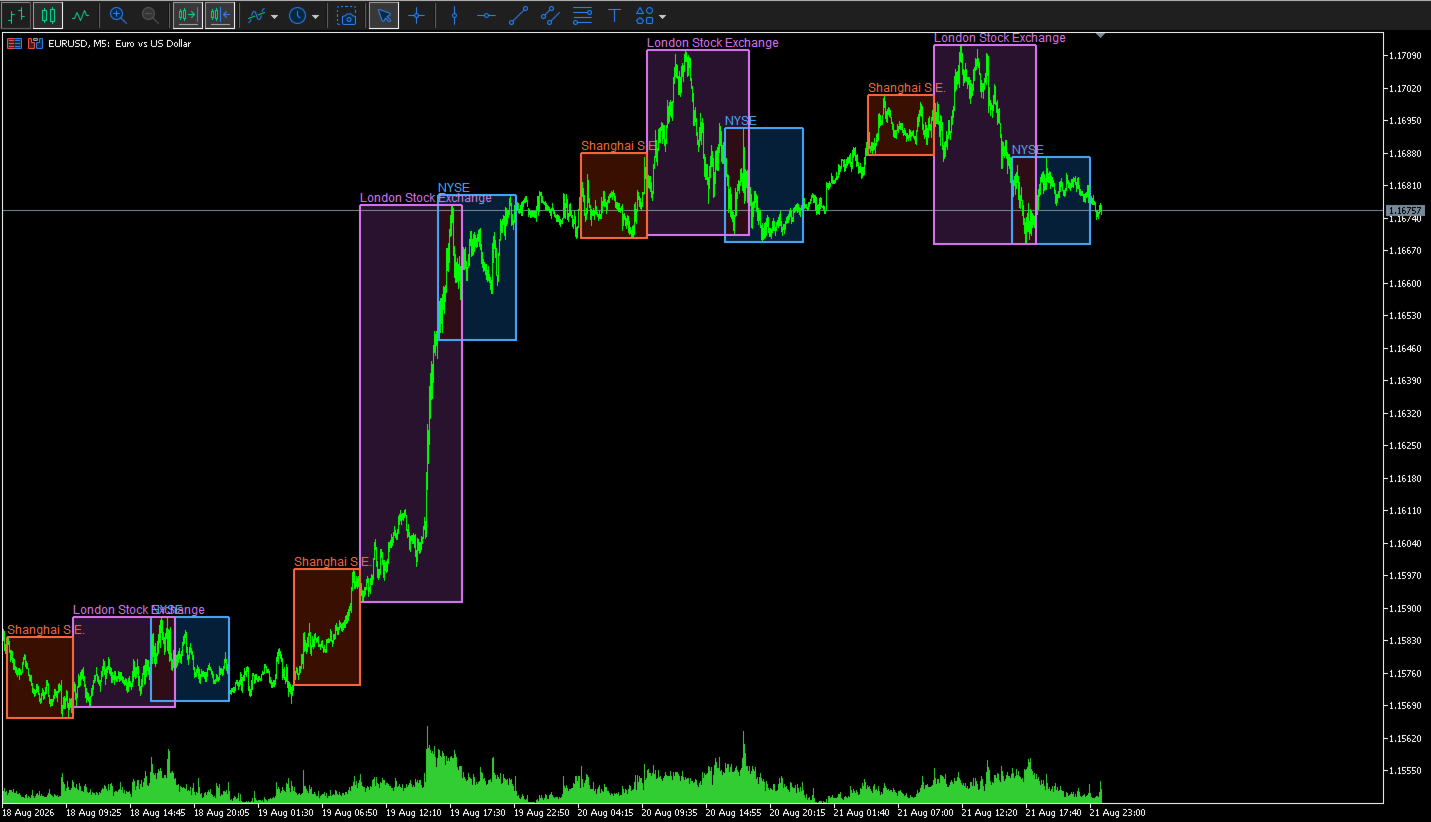
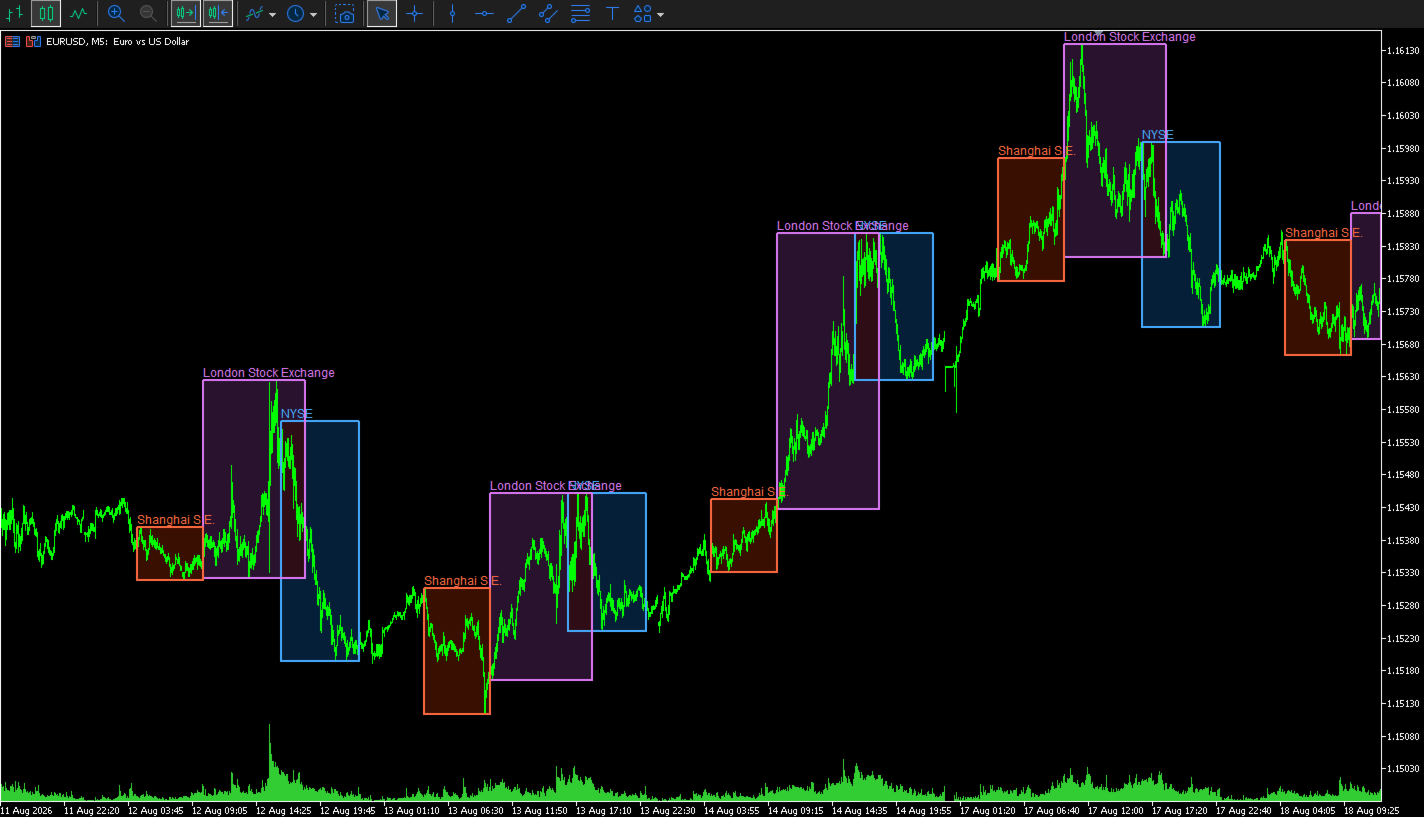
Global Exchange Sessions is an MQL5 indicator that marks the regular trading hours of the world’s main stock exchanges directly on your chart.
Each session is shown as a colored rectangle. The rectangle starts at the official market open and ends at the official market close. Its upper and lower edges follow the session high and low as new prices arrive.
This makes it easy to see when major equity markets are active, where each session formed its range, and how price reacted when sessions overlapped.
Included exchanges
The indicator supports six stock exchanges:
-
New York Stock Exchange — NYSE
-
London Stock Exchange — LSE
-
Shanghai Stock Exchange — SSE
-
Tokyo Stock Exchange — TSE
-
Hong Kong Stock Exchange — HKEX
-
Euronext
Each exchange can be enabled or disabled separately.
By default, the indicator displays:
-
NYSE
-
London Stock Exchange
-
Shanghai Stock Exchange
Tokyo, Hong Kong, and Euronext are included but disabled by default. You can enable them from the indicator inputs at any time.
Regular session hours
The indicator uses the following regular cash-market hours:
-
NYSE: 09:30–16:00 New York time
-
London Stock Exchange: 08:00–16:30 London time
-
Shanghai Stock Exchange: 09:30–15:00 Shanghai time
-
Tokyo Stock Exchange: 09:00–15:30 Tokyo time
-
Hong Kong Stock Exchange: 09:30–16:00 Hong Kong time
-
Euronext: 09:00–17:30 Central European time
Automatic broker-time conversion
You do not need to calculate the difference between exchange time and broker time.
The indicator reads the broker’s current server time and compares it with GMT. It then converts each exchange session into the time used by your chart.
This is useful because MetaTrader brokers do not all use the same server time. One broker may use UTC, another may use UTC+2, and another may change its server offset during daylight saving time.
Three broker-time modes are available.
Auto Current Offset
This is the default mode.
The indicator calculates the current broker offset from:
TimeTradeServer() - TimeGMT()
The detected offset is used for all displayed sessions.
This mode is suitable when you mainly use the current day or when your broker keeps a fixed UTC offset.
Auto European DST
This mode detects the current broker offset and applies a European daylight-saving schedule to historical dates.
It is useful for brokers that change their server time according to European summer-time rules.
Use this mode when older session rectangles shift by one hour after a daylight-saving change.
Manual Fixed Offset
This mode lets you enter the broker’s UTC offset in minutes.
Examples:
-
UTC: 0
-
UTC+1: 60
-
UTC+2: 120
-
UTC+3: 180
-
UTC-5: -300
This mode is useful when the automatic result does not match your broker or when you use a broker with a fixed server offset.
Exchange daylight saving time
The indicator calculates daylight saving time separately for the exchanges that use it.
It includes:
-
US daylight saving time for NYSE
-
UK daylight saving time for the London Stock Exchange
-
European daylight saving time for Euronext
Shanghai, Tokyo, and Hong Kong use fixed UTC offsets because these locations do not currently change their clocks during the year.
This separate calculation is important during the weeks when the United States and Europe change their clocks on different dates.
Dynamic session highs and lows
The rectangle is not based on a fixed price height.
When a session starts, the indicator reads the price bars inside that session. It finds the highest high and the lowest low, then uses those values as the top and bottom of the rectangle.
While the session is active:
-
A new session high moves the upper edge higher.
-
A new session low moves the lower edge lower.
-
The rectangle keeps its official opening and closing times.
-
The range updates as new price data arrives.
After the session closes, the completed high and low remain visible for the selected history period.
The default calculation timeframe is M1. This gives the indicator a more precise session range, even when it is attached to a higher chart timeframe.
You can change the calculation timeframe if you want to reduce the amount of historical data that MetaTrader must load.
Transparent-style session fills
Each session uses two separate rectangles:
-
A soft background fill
-
A clear foreground border
The fill color is blended with the current chart background. This produces a transparent-style result on both dark and light chart themes.
The default fill opacity is 22%.
You can change the opacity from 0 to 100:
-
0 makes the fill fully hidden.
-
Lower values create a softer session area.
-
Higher values make the session color stronger.
-
100 uses the full selected fill color.
The border is not affected by the fill opacity. It remains clear so that the session range is still easy to identify.
By default, fills are drawn behind the candles and borders are drawn in front of the candles.
Session colors
Every exchange has separate fill and border color settings.
The default colors are:
-
NYSE: blue
-
London: purple
-
Shanghai: orange-red
-
Tokyo: yellow
-
Hong Kong: green
-
Euronext: cyan
You can change each color from the indicator inputs.
The fill and border colors do not need to match. For example, you can use a dark blue fill with a bright blue border, or turn the fill off and display only the session outline.
Labels
The indicator can place the exchange name at the upper-left area of each session rectangle.
Labels use the session border color, which helps connect the name with its rectangle.
You can:
-
Show or hide labels
-
Change the label font size
-
Change the label color by changing the session border color
Labels are enabled by default.
Border settings
The session border can be adjusted to match your chart style.
Available settings include:
-
Border color for each exchange
-
Border width
-
Border line style
-
Foreground or background drawing
The default border width is two pixels, which keeps the session outline visible without covering too much price information.
Historical sessions
The History Days input controls how many calendar days the indicator processes.
The default value is 10 days.
A higher value displays more historical sessions, but it also requires more price data and more chart objects.
For normal intraday use, a value between 5 and 20 days is usually sufficient.
Only Monday-to-Friday session dates are processed. Weekend sessions are not drawn.
Refresh rate
The indicator checks active sessions at a regular interval.
The default refresh interval is five seconds.
It also updates when:
-
A new price calculation occurs
-
The chart changes
-
The chart scale or visible area changes
A shorter refresh interval gives faster visual updates but causes MetaTrader to process the session data more often.
Main inputs
General settings
InpHistoryDays
Sets the number of historical calendar days to process.
InpHighLowTimeframe
Sets the timeframe used to calculate each session high and low. The default is M1.
InpRefreshSeconds
Sets the update interval in seconds.
InpShowLabels
Shows or hides exchange names.
InpLabelFontSize
Sets the label text size.
InpFillRectangles
Enables or disables the colored session fills.
InpFillOpacityPercent
Controls the strength of the session fill from 0 to 100.
InpDrawFillBehindCandles
Places the session fill behind the price candles.
InpDrawBordersInForeground
Places session borders in front of the candles.
InpBorderStyle
Sets the border line style.
InpBorderWidth
Sets the border thickness.
Broker-time settings
InpBrokerOffsetMode
Selects automatic current offset, automatic European DST, or manual fixed offset.
InpManualBrokerUTCMinutes
Sets the manual broker UTC offset in minutes.
This value is used when Manual Fixed Offset is selected. It is also used as a fallback if automatic time detection is not available.
Exchange settings
Each exchange has:
-
An enable or disable switch
-
A fill color
-
A border color
This lets you build a simple three-session layout or display all six exchanges.
Suggested setup
For a clean intraday chart, start with the default settings:
-
NYSE enabled
-
London enabled
-
Shanghai enabled
-
All other exchanges disabled
-
M1 high and low calculation
-
10 history days
-
22% fill opacity
-
Two-pixel borders
-
Labels enabled
If the chart becomes too busy, reduce the history period or disable the labels.
If the fill is too weak, increase the opacity to approximately 30–35%.
If the fill is too strong, reduce it to approximately 10–15%.
Practical uses
The indicator can help with several types of analysis.
Session range analysis
See the high and low formed during each stock-market session.
Session overlap
Identify periods when two major markets are open at the same time, such as London and New York.
Breakout context
See whether price breaks above or below a completed session range.
Volatility comparison
Compare the size of the Asian, European, and US session ranges.
Intraday support and resistance
Use completed session highs and lows as reference levels for later price action.
Market timing
See which major equity market is active without converting local exchange times manually.
Important notes
The indicator uses regular weekday session schedules.
It does not contain an exchange holiday calendar. It also does not automatically adjust for special early-close days, emergency closures, or temporary exchange schedule changes.
If the chart symbol continues to trade while a stock exchange is closed for a holiday, MetaTrader may still provide price bars during the normal session window. In this case, the indicator can draw a rectangle even though the physical exchange is closed.
Historical accuracy also depends on the price history supplied by your broker. Missing M1 data can prevent a session rectangle from appearing or can produce an incomplete range.
The indicator is designed for visual analysis. It does not provide trading signals, alerts, order execution, or profit guarantees.