The Cube MA Cross
- Indicators
- Version: 1.1
- Activations: 5

MATC CROSS VERSION — Arithmetic Averages Cube Theory
An indicator that only moves when the price actually touches the structure — not with each bar, with each event.
Description
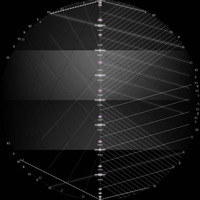
Most oscillators and moving averages recalculate with each closed bar, following time. MATC follows a different logic: it only updates its value when the price touches one of the levels of a four-layer fractal grid (Cube Theory — M1 to M4, from larger to smaller scales). Between touches, the value remains still. The result is an average that reacts to real price events, not to the passage of time.
How it works
Four grid layers (M1 "Iron", M2 "Steel", M3 "Aluminum", M4 "Plastic"), each with its own scale and density
With each touch at any level of any layer, an EMA is updated — the EMA factor is calculated on the number of touches (N), not on the number of bars
The plotted value is always the exact level touched (multiple of the grid step), not the raw price — that's why the line moves "in steps"
MATC Fast/Slow — two MATCs with different periods plotted together, with discreet arrows at the crossing points between them — designed for those who trade moving average crossovers, but with touch behavior instead of time
Features
Information panel on the chart (symbol, current value, total touches, last layer touched, distance from price)
Colored touch markers per layer (M1-M4)
All scale, touch tolerance and period parameters configurable
Performs even in long history (Configurable safety ceiling per bar)
Recommended for:
Traders who want to use dynamic support/resistance based on price structure, or trade moving average crossovers with logic that reacts to actual grid touches instead of elapsed time.
Main parameters:
InpScaleM1..M4 — scale of each grid layer (adjust according to asset volatility/price)
InpTouchPoints — tolerance (in points) to consider a level "touched"
InpTouchPeriod (or N_Fast/N_Slow in the dual version) — EMA period, in number of touches
InpShowPanel, InpShowMarkers — turns visual elements on/off
Important note:
The M1-M4 scales are absolute price values — they work best when calibrated for the asset/timeframe you will be trading in (the pattern was designed for forex, but serves as a starting point for any market). Like any technical analysis tool, MATC does not guarantee results — test it on a demo account and adjust the parameters to your liking.