The Cube MA Cross

MATC CROSS VERSION — Arithmetic Averages Cube Theory
An indicator that only moves when the price actually touches the structure — not with each bar, with each event.

Description
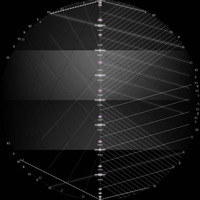
Most oscillators and moving averages recalculate with each closed bar, following time. MATC follows a different logic: it only updates its value when the price touches one of the levels of a four-layer fractal grid (Cube Theory — M1 to M4, from larger to smaller scales). Between touches, the value remains still. The result is an average that reacts to real price events, not to the passage of time.

How it works
Four grid layers (M1 "Iron", M2 "Steel", M3 "Aluminum", M4 "Plastic"), each with its own scale and density
With each touch at any level of any layer, an EMA is updated — the EMA factor is calculated on the number of touches (N), not on the number of bars
The plotted value is always the exact level touched (multiple of the grid step), not the raw price — that's why the line moves "in steps"
MATC Fast/Slow — two MATCs with different periods plotted together, with discreet arrows at the crossing points between them — designed for those who trade moving average crossovers, but with touch behavior instead of time
Features
Information panel on the chart (symbol, current value, total touches, last layer touched, distance from price)
Colored touch markers per layer (M1-M4)
All scale, touch tolerance and period parameters configurable
Performs even in long history (Configurable safety ceiling per bar)
Recommended for:
Traders who want to use dynamic support/resistance based on price structure, or trade moving average crossovers with logic that reacts to actual grid touches instead of elapsed time.

Main parameters:
InpScaleM1..M4 — scale of each grid layer (adjust according to asset volatility/price)
InpTouchPoints — tolerance (in points) to consider a level "touched"
InpTouchPeriod (or N_Fast/N_Slow in the dual version) — EMA period, in number of touches
InpShowPanel, InpShowMarkers — turns visual elements on/off
Important note:
The M1-M4 scales are absolute price values ​​— they work best when calibrated for the asset/timeframe you will be trading in (the pattern was designed for forex, but serves as a starting point for any market). Like any technical analysis tool, MATC does not guarantee results — test it on a demo account and adjust the parameters to your liking.
おすすめのプロダクト
How it works –   Base-departure detection — algorithmically finds consolidation bases (overlapping range with compressed volatility) followed by displacement departures. Patterns: Drop-Base-Rally, Rally-Base-Drop, Rally-Base-Rally, Drop-Base-Drop — detected structurally, not by candle names. –   Strength score (0–100) — from departure velocity, time-at-base, freshness (each revisit decays the score), higher-timeframe confluence and origin volume. –   Lifecycle — Fresh, Tested (decaying), Broken
FREE
概要 このインジケーターは、クラシックな ドンチャンチャネル を強化したバージョンで、実践的なトレード機能を追加しています。 標準の3本線(上限、下限、中央線)に加え、 ブレイクアウト を検出し、チャート上に矢印で視覚的に表示します。また、チャートを見やすくするために、 現在のトレンド方向と逆側のラインのみを表示 します。 インジケーターの機能: 視覚的シグナル :ブレイクアウト時にカラフルな矢印を表示 自動通知 :ポップアップ、プッシュ通知、Eメール RSIフィルター :市場の相対的な強弱に基づいてシグナルを検証 カスタマイズ可能 :色、ラインの太さ、矢印コード、RSI閾値など 動作原理 ドンチャンチャネルは次のように計算します: 上限線 :直近N本のクローズ済みローソク足の最高値 下限線 :直近N本のクローズ済みローソク足の最安値 中央線 :最高値と最安値の平均値 上方ブレイクアウト は終値が上限線を超えたときに発生し、 下方ブレイクアウト は終値が下限線を下回ったときに発生します。 インジケーターは以下を行います: 3本のドンチャンラインを描画 方向転換後の最初のブレイクアウト
FREE
ピボットポイントフィボRSJは、フィボナッチレートを使用してその日のサポートラインとレジスタンスラインを追跡するインジケーターです。 この壮大な指標は、フィボナッチレートを使用してピボットポイントを通じて最大7レベルのサポートとレジスタンスを作成します。 価格がこのサポートとレジスタンスの各レベルを尊重する方法は素晴らしいです。そこでは、オペレーションの可能な入口/出口ポイントを認識することができます。 特徴 最大7レベルのサポートと7レベルの抵抗 レベルの色を個別に設定します 入力 ピボットタイプ ピボットフィボRSJ1 =フィボ比1の計算 ピボットフィボRSJ2 =フィボ比2の計算 ピボットフィボRSJ3 =フィボ比3の計算 ピボットフィボクラシック=クラシックピボット計算 最小ピボットレベル ピボット3レベル ピボット4レベル ピボット5レベル ピボット6レベル ピボット7レベル それでも質問がある場合は、ダイレクトメッセージで私に連絡してください: https://www.mql5.com/ja/users/robsjunqueira/
FREE
QuantumAlert Stoch Navigator is a free indicator available for MT4/MT5 platforms, its work is to provide "alerts" when the market is inside "overbought and oversold" regions in the form of "buy or sell" signals. This indicator comes with many customization options mentioned in the parameter section below, user can customise these parameters as needful. Join our   MQL5 group , where we share important news and updates. You are also welcome to join our private channel as well, contact me for the p
FREE
Zaxti Trend Levels [SORSAWO]: Where Algorithmic Precision Meets Visual Elegance Step into a new era of technical analysis. Zaxti Trend Levels is not just another charting tool; it is a comprehensive trend-visualization engine crafted for the discerning trader. By seamlessly blending the mathematical rigor of advanced adaptive filtering with intuitive visual mapping, this indicator transforms chaotic price action into a clear, actionable roadmap. Designed to eliminate noise and highlight what tru
FREE
Wave Box Market Frenquency
Jean Jacques Huve Ribeiro
4.75 (4)
Totally linked to the result of a movement and the duration he had. Its height records how many ticks the asset walked during a given movement, its width shows us the duration that movement had. Its configuration must be in line with the Weis Wave Indicator configuration to observe the movement force and can indicate a possible accumulation or distribution of the movement;
FREE
Are you tired of drawing trendlines every time you're analyzing charts? Or perhaps you would like more consistency in your technical analysis. Then this is for you. This indicator will draw trend lines automatically when dropped on a chart. How it works Works similar to standard deviation channel found on mt4 and mt5. It has 2 parameters: 1. Starting Bar 2. Number of bars for calculation The   starting bar   is the bar which drawing of the trend lines will begin, while the   number of bars for c
FREE
FX Clock
Abderrahmane Benali
FXClock – Professional Clock Indicator for Traders Please leave a 5 star rating if you like this free tool! Thank you so much :) The FXClock indicator is a practical and simple tool that displays time directly on your trading platform, allowing you to track multiple key pieces of information at the same time. It is specially designed to help traders synchronize their trading with market hours and global sessions. Key Features: Displays the broker server time with precision. Displays your local c
FREE
PROMETHEUS TECHNICAN VERSION Free | By THE SONS A gift from The Sons — no strings, no trial, no expiry. Every trader deserves access to professional-grade market intelligence. That belief is why Prometheus Technical Version exists, and why it costs nothing. Consider it our handshake to the trading community. What You're Getting This is not a simplified tool dressed up as a gift. Prometheus Technican Version is a fully built, institutional-quality technical analysis indicator running a dual-model
FREE
Follow The Line MT5
Oliver Gideon Amofa Appiah
4.6 (35)
This indicator obeys the popular maxim that: "THE TREND IS YOUR FRIEND" It paints a GREEN line for BUY and also paints a RED line for SELL. (you can change the colors). It gives alarms and alerts of all kinds. IT DOES NOT REPAINT and can be used for all currency pairs and timeframes. Yes, as easy and simple as that. Even a newbie can use it to make great and reliable trades. NB: For best results, get my other premium indicators for more powerful and reliable signals. Get them here: https://www.m
FREE
RSI abcd
Francisco Gomes Da Silva
4.33 (3)
RSI ABCDパターンファインダー:テクニカル戦略 1. インジケーターの仕組み 古典的RSI と ABCD調和パターン の自動検出を組み合わせたものです。 主要コンポーネント 標準RSI (調整可能な期間) 高値・安値マーカー (矢印) ABCDパターン (緑/赤の線) 過買(70)・過売(30)フィルター 2. MT5設定 period = 14 ; // RSI期間 size = 4 ; // 最大パターンサイズ OverBought = 70 ; // 過買水準 OverSold = 30 ; // 過売水準 Filter = USE_FILTER_ YES ; // 確認フィルター 3. 取引戦略 3.1. 買いエントリー(強気ABCD) 条件: RSIが以下を形成: 谷( A )→ 山( B )→ より高い谷( C ) D が過売域(30)より上だが C より下 確認:A-B-C-Dを結ぶ緑色の線 目標: TP1: B-Cの61.8% TP2: B-Cの100% ストップロス: D より下 3.2. 売りエントリー(弱気ABCD) 条件: RSIが以下を形成: 山( A
FREE
Coral trend is   a trend-following indicator that is widely popular among FOREX traders . It is usually used as a confluence with other indicators. It uses combinations of moving averages with complex smoothing formulas! It has two configurable parameters: Coefficient   - smoothing ratio (*) Applied price Calculation: Coral = (-0.064) * B6 + 0.672 * B5 - 2.352 * B4 + 2.744 * B3
FREE
高度な経済カレンダーインジケーター このインジケーターは、選択した通貨ペアまたは取引銘柄に関連するすべての今後の経済イベントをチャート上に直接表示します。高ボラティリティのタイミングを事前に把握し、より正確に取引戦略を立てることができます。 主な機能 最大 5日先 までの経済イベントを表示(カスタマイズ可能)。 ニュースの影響度 (高・中・低)によるフィルタリング。 垂直ライン や 番号付きマーカー の表示を選択可能。 ニュースの重要度を区別するための色を自由に設定可能。 主要な 世界通貨 (USD, EUR, GBP, JPY, CNY, AUD, CAD, NZD, CHF など)に自動・手動対応。 主要な 世界指数や金融商品 を自動認識(SP500, NASDAQ, DAX, FTSE, CAC40, 日経225, ハンセン指数, Eurostoxx, IBEX, MIB など)。 日付・時間・通貨・影響度・イベント名 を表示する内蔵イベントテーブル。 イベントが重なった場合も、マーカーを自動調整して見やすさを確保。 利用する理由 このインジケーターは、FX、株価指数、コモディ
FREE
The concept is simple: Plotting Price behavior within several periods of time. Some Symbols behave very well during the trading day - with this I mean Intraday trading - and this behavior ends up plotting effectively well with the proposed Exponential Moving Averages in this indicator... Obviously that this behavior could not be seen in all Symbols, but you can give it a try... Just drop this indicator in a chart and you will see for yourself... This indicator is intended for "Feeling the Trend"
FREE
The one minute chart has a bug, but the one-day chart can still be used after deleting the bug and reloading the indicators, This indicator can be used to determine how far the indicator goes up to place an order to buy, how far it goes down to place an order to sell, and not placing an order until it reaches this distance, which is considered oscillation, open an account gift index
FREE
QuantumAlert RSI Navigator is a free indicator available for MT4/MT5 platforms, its work is to provide "alerts" when the market is inside "overbought and oversold" regions in the form of "buy or sell" signals. This indicator comes with many customization options mentioned in the parameter section below, user can customise these parameters as needful. Join our MQL5 group , where we share important news and updates. You are also welcome to join our private channel as well, contact me for the priva
FREE
Important Lines
Terence Gronowski
4.88 (24)
This indicator displays Pivot-Lines, preday high and low, preday close and the minimum and maximum of the previous hour. You just have to put this single indicator to the chart to have all these important lines, no need to setup many single indicators. Why certain lines are important Preday high and low : These are watched by traders who trade in a daily chart. Very often, if price climbs over or falls under a preday low/high there is an acceleration in buying/selling. It is a breakout out of a
FREE
Trade Behavior Mirror は、自分の口座の確定した取引履歴だけを読み、「損失が確定した直後に、自分のふだんの水準より大きいロットで新規ポジションを開いた」というパターンを1つだけ数えるツールです。予測も助言もしません。パネルに出るのは、すでにこの口座で起きたことの実測値だけです。 数字の作り方: 全銘柄・全マジック番号を対象に、最大31日分の確定した約定を読み込みます(チャートの銘柄に限らない、口座全体の集計です)。当日より前の30日間から、1日あたりの新規エントリー件数の中央値と、そのエントリーのロットの中央値を求めます。平均ではなく中央値を使うのは、1件だけ大きな取引があっても基準値全体が引きずられないようにするためです。その30日間のエントリーが5件に満たない場合は、十分な標本が無いということなので、無理に数字を出さず「Collecting history」と表示します。 核となる集計(画面では Entries within 10min of a loss, at above-median lot: の行): 新しいエントリーのたびに、その直前10分以内に損
FREE
Nexora EA Monitoring System — Free Remote Position Monitor for MetaTrader 5 (VPS-Friendly) Nexora Monitor is a free, read-only MetaTrader 5 indicator that displays a live dashboard of your open positions — designed for traders who run an Expert Advisor on a VPS and want to check its status from a separate MT5 desktop terminal without remoting into the VPS itself. Attach it to a chart on any MT5 desktop terminal (Windows or Mac) logged into the same trading account and it reconstructs a clear s
FREE
概要 Heiken Ashi Smoothwaveは、メインチャートウィンドウ上でチャートを直接スムージングされた平均足キャンドルに変換し、標準キャンドルを置き換えてよりクリーンなトレンドビューを提供します。別ウィンドウ不要、シンプルな表示。 動作の仕組み 各バーで実際の価格データから平均足のOHLC値を計算します。 カラー表示された平均足キャンドルをメインチャート上に直接描画します。 ネイティブのチャートキャンドルを自動的に非表示にし、平均足キャンドルのみを表示します。 インジケーターを削除すると、標準キャンドルが自動的に復元されます。 入力パラメータ 設定可能なパラメータはありません。アタッチするだけで使用できます。 推奨設定 あらゆる銘柄、あらゆる時間足に対応。Forex、ゴールド、指数、MetaTrader 5で利用可能なすべての銘柄で動作します。 スクリーンショット Heiken Ashi Smoothwave適用後のチャート、ネイティブキャンドルは自動的に非表示。 免責事項 本インジケーターはトレンド分析のための視覚的ツールであり、売買シグナルを生成するものではあ
FREE
Free automatic Fibonacci is an indicator that automatically plots a Fibonacci retracement based on the number of bars you select on the BarsToScan setting in the indicator. The Fibonacci is automatically updated in real time as new highest and lowest values appears amongst the selected bars. You can select which level values to be displayed in the indicator settings. You can also select the color of the levels thus enabling the trader to be able to attach the indicator several times with differe
FREE
マルチタイムフレーム対応、カスタマイズ可能なビジュアルシグナル、設定可能なアラートシステムを備えたAverage True Range(ATR)インジケーター。 フリーランスプログラミングサービス、アップデート、その他のTrueTL製品は私の MQL5プロフィール でご覧いただけます。 フィードバックとレビューを大変お待ちしております! ATRとは? Average True Range(ATR)は、J. Welles Wilderが開発した市場のボラティリティを測定するテクニカルインジケーターです。指定した期間のTrue Rangeの平均を計算します。True Rangeは以下の中で最大の値です:現在の高値から現在の安値までの距離、前回の終値から現在の高値までの距離、または前回の終値から現在の安値までの距離。 ATRは価格方向を示しません — ボラティリティのみを測定します。ATRが上昇するとボラティリティの増加を示し、ATRが低下するとボラティリティの減少を示します。トレーダーはATRを使用して市場状況を評価し、動的なストップロスを設定し(例:ATRベースのトレーリングストッ
FREE
High Low Open Close
Alexandre Borela
4.98 (45)
このプロジェクトが好きなら、5つ星レビューを残してください。 このインジケータは、指定されたためのオープン、ハイ、ロー、クローズ価格を描画します 特定のタイムゾーンの期間と調整が可能です。 これらは、多くの機関や専門家によって見られた重要なレベルです トレーダーは、彼らがより多くのかもしれない場所を知るために有用であり、 アクティブ。 利用可能な期間は次のとおりです。 前の日。 前週。 前の月。 前の四半期。 前年。 または: 現在の日。 現在の週。 現在の月。 現在の四半期。 現年。
FREE
XAU VWAP Mean Reversion H4 Expert Advisor for MetaTrader 5 — Gold / XAUUSD focus Version: 1.00 What it is XAU VWAP Mean Reversion H4 is an Expert Advisor for gold on the H4 chart. Intraday VWAP mean-reversion style participation on gold H4. Built for structured automated participation — not grid , not martingale . Evaluate on your broker and risk profile before any live use. This product is a technical system . Exact thresholds and entry equations remain internal product design and are not publ
FREE
Note from Developer: This is the lite version of the Double TMA with Bands Indicator. You can find the paid version that comes with alerts and on screen signal arrows built in here . I will also be selling an EA based on this trading system soon once all backtesting and optimization have been completed. Unlock your trading potential with the Double TMA Indicator with Reversal Detection! Designed for swing and reversal trading, this versatile tool integrates two Triangular Moving Averages (
FREE
Donchian Pro
Paulo Henrique Faquineli Garcia
5 (3)
The Donchian Channel Channels are among the most popular tools of technical analysis, as they visually convey to the analyst the limits within which most price movement tends to occur. Channel users know that valuable information can be obtained at any time, whether prices are in the central region of a band or close to one of the border lines. One of the best known techniques to explore these concepts is Bollinger Bands. However, John Bollinger was not the only one to research the application
FREE
My other indicators: https://www.mql5.com/en/market/product/156702 (FREE) https://www.mql5.com/en/market/product/153968 (FREE) https://www.mql5.com/en/market/product/153960 (FREE) This indicator displays higher timeframe candles directly on your lower timeframe chart, allowing you to monitor higher timeframe price action without switching between charts. It also plots session highs and lows for the Asia, London, and New York kill zones, giving you key liquidity levels directly on your chart. Wh
FREE
Cybertrade Keltner Channels - MT5 Created by Chester Keltner, this is a volatility indicator used by technical analysis. It is possible to follow the trend of financial asset prices and generate support and resistance patterns. In addition, envelopes are a way of tracking volatility in order to identify opportunities to buy and sell these assets. It works on periods longer than the period visible on the chart. All values ​​are available in the form of buffers to simplify possible automations.
FREE
The indicator draws daily support and resistance lines on the chart, as well as the Pivot level (reversal level). Adapted to work in MT5 The standard timeframe for calculating support and resistance levels is D1. You can choose other timeframes according to your strategy (for example, for M1-M15, the optimal timeframe for calculations is H1) The function for calculating support and resistance levels has been updated; in this calculation option, fibonacci levels are taken into account, respec
FREE
Donchian Channel is an indicator created by Richard Donchian. It is formed by taking the highest high and the lowest low of the last specified period in candles. The area between high and low is the channel for the chosen period. Its configuration is simple. It is possible to have the average between the upper and lower lines, plus you have alerts when price hits one side. If you have any questions or find any bugs, please contact me. Enjoy!
FREE
このプロダクトを購入した人は以下も購入しています
SMART TREND TRADING SYSTEM — 特別オファー トレードシステム、自動化EA、学習コンテンツとサポートをひとつに。 MT5用のSmart Trend Trading Systemを99米ドルでご購入いただくと、シグナルの自動売買に使える Smart Universal Expert Advisorを無料でプレゼント します。 STTSは、トレンドの方向、エントリー・決済シグナル、反転ゾーン、重要な価格水準をチャート上にまとめて表示します。システムを参考に手動で取引することも、付属のEAを接続し、ご自身で選んだ設定に基づいて自動売買することもできます。 現在の99米ドルという価格は、これからの30件の購入に適用されます。その後、価格は149米ドルに上がります。 充実のパッケージ内容 ご購入には以下が含まれます。 • MT5用Smart Trend Trading System。 • Smart Universal Expert Advisor — 無料。 • STTSの完全版PDFユーザーマニュアル。 • STTS公式オンラインコース。 • インストールと
Trend Sniper X
Sarvarbek Abduvoxobov
4.89 (35)
Trend Sniper X は、トレードの方向性と潜在的な反転ポイントを明確かつ正確に特定するのに役立つ、MetaTrader 5 用のマルチタイムフレーム・トレンドフォロー指標です。 MT4用: https://www.mql5.com/en/market/product/193245 価格情報: 現在の価格はプロモーション価格であり、今後のアップデートや新機能のリリースに伴い変更される場合があります。 ボーナス特典: このインジケーター用の無料自動売買アシスタントEAを入手するには、購入後に an 著者(開発者)へメッセージをお送りください。 Code2Profit チャンネル マルチタイムフレーム分析で相場をマスターしよう! Trend Sniper X で勝率を最大化する方法:重要なルールとセッションのコツ 技術仕様 プラットフォーム MetaTrader 5 インジケータータイプ マルチタイムフレーム・トレンドインジケーター 操作タイムフレーム あらゆるチャートタイムフレームに対応。個別に選択可能な上位タイムフレーム (M1–MN1) を搭載 主要銘柄 FX、ゴールド (X
Zoryk Gold
Reda El Koutbane
5 (10)
割引は 24 時間後に終了します — 次の価格は$ 69 ZORYK — MetaTrader 5専用 XAUUSDシグナル・トレードプランニングシステム このような経験はありませんか。 ゴールドを分析し、エントリーを待ち、ようやくポジションを持った直後に価格が逆方向へ動く。 早すぎる決済をしてしまったり、Stop Lossを動かしたり、数秒迷っている間にチャンスを逃したりする。 その後、相場は自分が最初に予想していた方向へ進み、目標へ到達する。 問題は常に方向判断ではありません。 本当の問題は、明確な計画がなかったことです。 どこでエントリーすべきか。 どこでトレードの前提が無効になるのか。 近い利益を確保すべきか、より大きな値動きを待つべきか。 現在のsetupが本当に強いのか、それとも無理にトレードを探しているだけなのか。 ゴールドは非常に速く動きます。 正しい分析でも、明確なプランがなければ数秒で悪い判断に変わることがあります。 ZORYKは、その問題を解決するために開発されました。 ZORYKとは ZORYKは、MetaTrader 5とXAU
まず正直に言いましょう。 どんなインジケーターも、それ単体であなたを利益化させることはできません。もしそう言う人がいるなら、それは夢を売っているだけです。完璧な売買シグナル(矢印)を表示するインジケーターは、いくらでも“完璧に見せる”ことができます。正しい過去の区間を拡大して、勝ちトレードだけを切り取ればいいだけです。私たちはそれをしません。 SMC Intraday Formula はツールです。 市場構造を読み取り、最も高い確率の価格ゾーンを特定し、今この瞬間のスマートマネーの痕跡をシンプルな言葉で正確に示します。最終判断はあなたが行います。トレードを実行するのもあなたです。しかし今は「希望」ではなく「精度」でエントリーできます。 私たちはこのインジケーターを、ゴールド(XAUUSD)および主要FX通貨ペアで約3年間、日々のスキャルピングに使用してきました。M1、M5、M15、M30の主要ツールです。これは未来を予測しようとするのではなく、今まさに形成されている高確率セットアップを示し、その理由を説明します。 他のすべてのインジケーターと何が違うのか? ほとんどのトレーディングイ
UNIX SCALPER — 特別オファー セットアップを見つけ、取引プランを確認し、取引方法を選ぶ。 MT5用UNIX Scalperを99米ドルで購入すると、シグナルを自動売買に活用できるSmart Universal Expert Advisorが無料で付属します。 UNIX Scalperは、市場分析、BUY/SELL/WAITの判断、Entry、Stop Loss、TP1、TP2の水準を、見やすいパネルにまとめています。取引プランに沿って手動で取引することも、付属のEAを接続し、ご自身の設定に従って自動執行することもできます。 現在の99米ドルの価格は、今後30件の購入に適用されます。その後、価格は149米ドルになります。 パッケージの内容 ご購入には以下が含まれます。 • MT5用UNIX Scalper。 • Smart Universal Expert Advisor — 無料。 • UNIX Scalperの完全版PDFユーザーマニュアル。 • UNIX Scalper公式オンラインコース。 • インストールと設定の手順ガイド。 • 購入者限定コミュニティへ
SuperScalp Pro
Van Minh Nguyen
4.64 (33)
SuperScalp Pro - Professional Multi-Layer Confluence Scalping System SuperScalp Proは、クラシックなSupertrendに複数のインテリジェントな確認フィルターを追加した、高度なスキャルピングインジケーターです。より高い確率が期待できるBuy/Sellの取引機会を特定し、ダマシのシグナルを大幅に減らすことをサポートします。 明確なBuyとSellの矢印がチャート上に直接表示され、ATRに基づくStop LossとTake Profitのレベルがリアルタイムで自動計算されます。 購入後、設定方法や推奨設定についてのサポートが必要な場合は、私にご連絡ください。 SuperScalp Pro Auto Traderを使用して、シグナルを簡単に自動化できます: [Auto Trader] 推奨設定ファイルをダウンロード: [Set File] 完全なドキュメントは製品ブログでご覧いただけます: [User Guide] 最新情報を受け取るには公式チャンネルに参加してください: [Official Channel]
Neuro Poseidon is a new indicator by Daria Rezueva. It combines precise trading signals with adaptive TP/SL levels - creating best possible trades as a result! Message me and get  Neuro Poseidon Assistant  as a gift to automize your trading process! What makes it stand out? 1. Proven profitability on all assets and timeframes 2. Only confirmed BUY and SELL signals present on the chart 3. Adaptive TP & SL levels generated by the software for each trade 4. Easy to understand - suitable for al
Reversion King Indicator
Eugen-alexandru Zibileanu
5 (8)
新たな王者が登場 - インジケーター + 注文管理表示(TP1 + TP2 + TP3)+ オプションのTelegramシグナル送信機能付き(無料) (完全なトレード&シグナルシステム) ゴールド向け最高のEA: Gold Slayer このインジケーターには、高度な戦略、カスタマイズ可能な注文管理システム、そしてエンベロープ拡張を組み合わせた平均回帰システムが搭載されています。さらに、RSIなど複数のインテリジェントな確認フィルターによって、高確率の反転エントリーをBUY・SELLシグナルとして検出します。 単にトレードを学ぶだけでなく、複数ポジションを効果的に管理し、過去に利益を出しているオープンポジションで損失トレードをカバーする方法も学べます。 M5向けに構築・最適化されており、流動性が高くシグナルの精度が安定しているBTCUSDとXAUUSDで優れたパフォーマンスを発揮します。 このインジケーターは、ATRを基に自動計算されたエントリー、ストップロス、テイクプロフィットレベルを備えた明確なLong・Shortシグナルを提供するため、リスク管理が最初から組み込まれています。 マ
GoldenX Entryは、MT5向けのインジケーターであり、適応型Smart Entry Trendアルゴリズム、シグナルスコアリングシステム、マーケットレジーム検出機能、およびボラティリティフィルターを備えています。各シグナルには、計算されたエントリーレベル、3つのテイクプロフィット(TP1、TP2、TP3)、およびストップロスレベルが含まれます。本インジケーターは、異なる市場環境に適応するために設計された複数の分析レイヤー上に構築されており、マルチレイヤー分析システムと内蔵オプティマイザーおよび統計トラッキングシステムを組み合わせています。リスク・リワード(RR)指標および過去のトレード履歴に基づく定量分析を提供します。 使い始めは簡単です — 選択した時間足でオプティマイザーを実行し、そのままチャート上でインジケーターを使用します。 コア機能 GoldenX Entryは、シグナルエンジンとトレード管理機能、そして過去統計トラッキングを1つのチャートに統合しています: - 内蔵オプティマイザー: オプティマイザーはチャート上でワンクリックで実行できます。200通りのパラメー
伝説が帰ってきました:Entry Points Pro 10。 MQL5 Marketのトップ3に3年間入り続けた伝説的インジケーターの再始動です。 2つのバージョンで合計589件の高評価レビュー、毎日数千人のトレーダーが実際のトレードに使用し、デモのダウンロードは31,000件以上   MT4+MT5 。 私はこの5年間に寄せられたレビューをすべて読み、約束を並べる代わりに、その答えをバージョン10に組み込みました。1999年から相場に携わり、 誠実さ、自らの評判、そして顧客を大切にする 作者による製品です。 Entry Points Proのエントリーシグナルは、リペイント(再描画)を一切行いません。 そして今回初めて、これは作者の言葉ではなく検証可能な事実になりました。確定シグナルはローソク足の終値確定後にのみ表示され、自動テストで リペイントはゼロ と確認されています(EURUSD、XAUUSD、BTCUSDで2,486,568回の不変条件チェック、違反0件)。検証方法は公開されており、ストラテジーテスターでご自身で再現できます。 ご購入後は、必ずすぐにダイレクトメッセージでご
M1 SNIPER は使いやすいトレーディングインジケーターシステムです。M1時間足向けに設計された矢印インジケーターです。M1時間足でのスキャルピングのためのスタンドアロンシステムとして、また既存のトレーディングシステムの一部としても使用できます。このトレーディングシステムはM1時間足での取引に特化して設計されていますが、他の時間足でも使用できます。元々、この手法はXAUUSDとBTCUSDの取引用に設計しましたが、他の市場においても役立つと考えています。 インジケーターのシグナルは、トレンドの方向と逆方向に取引できます。インジケーターのシグナルを利用して両方向に取引するのに役立つ特別な取引テクニックをご紹介します。この手法は、特別な動的なサポートとレジスタンスの価格帯を利用することに基づいています。 ご購入後、M1 SNIPER矢印インジケーターをすぐにダウンロードできます。さらに、M1 SNIPERツールのすべてのユーザーに、以下のスクリーンショットに表示されているApollo Dynamic SRインジケーターを無料で提供しています。この2つのインジケーターを組み合わせることで
Welcome to ENTRY IN THE ZONE AND SMC MULTI TIMEFRAME Entry In The Zone and SMC Multi Timeframe is a real-time market analysis tool based on Smart Money Concepts (SMC), designed to analyze market structure, price direction, and key trading zones. It supports both Single-Timeframe Analysis and Multi-Timeframe Analysis, providing a clearer view of the overall market structure across multiple timeframes, with real-time BUY / SELL signals that do not repaint. It is designed to help filter trading opp
このインジケーターを購入された方には、以下の特典を 無料 で提供しています: 各トレードを自動で管理し、ストップロスとテイクプロフィットを設定し、戦略ルールに基づいてポジションを決済する補助ツール 「Bomber Utility」 様々な銘柄に合わせたインジケーターの設定ファイル(セットファイル) 「最小リスク」、「バランスリスク」、「待機戦略」 の3つのモードで使用できる Bomber Utility 用の設定ファイル このトレーディング戦略をすぐに導入・設定・開始できる ステップバイステップのビデオマニュアル ご注意: 上記の特典を受け取るには、MQL5のプライベートメッセージシステムを通じて販売者にご連絡ください。 オリジナルのカスタムインジケーター 「Divergence Bomber(ダイバージェンス・ボンバー)」 をご紹介します。これは、MACDのダイバージェンス(乖離)戦略に基づいた 「オールインワン」型のトレーディングシステム です。 このテクニカルインジケーターの主な目的は、価格とMACDインジケーターの間に発生するダイバージェンスを検出 し、将来の価格の動きを示
ATOMIC ANALYST — 特別オファー 市場分析、自動化EA、学習コンテンツとサポートをひとつに。 MT5用のAtomic Analystを99米ドルでご購入いただくと、シグナルの自動売買に使える Smart Universal Expert Advisorを無料でプレゼント します。 Atomic Analystは、プライスアクション、トレンドの方向、エントリー・決済シグナル、損切り水準、複数の利確水準をチャート上にまとめて表示します。分析を参考に手動で取引することも、付属のEAを接続し、ご自身で選んだ設定に基づいて自動売買することもできます。 現在の99米ドルという価格は、これからの30件の購入に適用されます。その後、価格は149米ドルに上がります。 充実のパッケージ内容 ご購入には以下が含まれます。 • MT5用Atomic Analyst。 • Smart Universal Expert Advisor — 無料。 • Atomic Analystの完全版PDFユーザーマニュアル。 • Atomic Analyst公式オンラインコース。 • インストールと設
Scalper Vault は、スキャルピングを成功させるために必要なすべてを提供するプロフェッショナルなスキャルピング システムです。このインジケーターは、外国為替およびバイナリー オプションのトレーダーが使用できる完全な取引システムです。推奨される時間枠は M5 です。 システムは、トレンドの方向に正確な矢印シグナルを提供します。また、トップとボトムのシグナルとギャン マーケット レベルも提供します。 インジケーターは、プッシュ通知を含むすべてのタイプのアラートを提供します。 インジケータの購入後にご連絡ください。私の個人的な取引の推奨事項と素晴らしいボーナス指標を無料で共有します! 幸せで有益な取引をお祈りします!
Power Candles V3 - 自己最適化型強弱インジケーター Power Candles V3は 、通貨や銘柄の強さを、適用されたすべてのチャート上で実行可能なトレードプランに変換します。単にローソク足を色分けするだけでなく、バックグラウンドでリアルタイムの自動最適化を実行し、目の前の銘柄に対して最適なストップロス、テイクプロフィット、およびシグナルの閾値を提示します。ワンクリックで実取引に適用でき、エントリーポイント、ストップロス、テイクプロフィットのラインが正確な価格位置にチャート上に表示され、方向性を示すアラートがリアルタイムで発動します。 このツールは、Stein Investmentsのエコシステムの一部です。  18種類以上のツールをすべて閲覧し、AIを活用したセットアップの推奨事項を入手し、  https://stein.investments でコミュニティに参加しましょう クローズしたバーごとに3,000回以上のトレードシミュレーション。9つの強さの状態。2つの戦略を並行してテスト。勝率の高い設定をワンクリックで適用。 なぜこれが必要なのか ほとんどの強
FiboSniper Pro – Multi-Filter Fibonacci System with Auto SL/TP and Control Panel FiboSniper Proは、動的なFibonacci Envelopesと複数の確認フィルターを組み合わせ、選別されたBuyおよびSellシグナルを生成するテクニカルインジケーターです。FibonacciレベルはMoving AverageとATRを基に計算され、その後ADX、EMA、RSI、ATR、Volume、Time、Candle構造によってフィルタリングされます。インジケーターは、ATRに基づく自動Stop LossおよびTake Profitレベルをチャート上に直接表示し、さらに迅速な調整が可能なインタラクティブControl Panelを提供します。 購入後、推奨設定ファイルと詳細な使用方法については、私にご連絡ください。 Auto Trader Xを使用してFiboSniper Proのシグナルを自動化できます: [Auto Trader X] User GuideとSet Files: [Click her
トレンドキャッチャーインジケーター トレンドキャッチャーインジケーターは、開発者独自の適応型トレンド分析指標を組み合わせることで、市場価格の動きを分析します。短期的なノイズを除去し、根底にあるモメンタムの強さ、ボラティリティの拡大、価格構造の挙動に焦点を当てることで、真の市場方向性を特定します。また、移動平均線、RSI、ボラティリティフィルターなどの平滑化およびトレンドフィルタリング機能を備えたカスタマイズ指標も使用します。 実際の運用状況のモニタリングやその他の製品については、こちらをご覧ください: https://www.mql5.com/en/users/mechanic/seller ご注意ください。私はTelegramでEAや設定を販売していません。詐欺です。すべての設定はブログで無料で公開しています。 重要!ご購入後すぐにご連絡ください。手順とボーナスをお送りします!
Gann Made Easy   は、ミスター・ギャンの理論を使用した取引の最良の原則に基づいた、プロフェッショナルで使いやすい外国為替取引システムです。 W・D・ガン。このインジケーターは、ストップロスとテイクプロフィットレベルを含む正確な買いと売りのシグナルを提供します。 PUSH通知を利用して外出先でも取引可能です。 ご購入後、取引方法の説明と優れた追加インジケーターを無料で入手するには、私にご連絡ください! おそらく、ギャンの取引手法についてはすでに何度も聞いたことがあるでしょう。通常、ギャンの理論は初心者のトレーダーだけでなく、すでにある程度の取引経験がある人にとっても非常に複雑なものです。なぜなら、ギャンの取引手法は理論的にはそれほど簡単に適用できるものではないからです。私はその知識を磨き、最良の原則を私の外国為替インジケーターに組み込むために数年を費やしました。 このインジケーターは非常に簡単に適用できます。必要なのは、それをチャートに添付し、簡単な取引推奨事項に従うだけです。このインジケーターは常に市場分析の仕事を行い、取引の機会を探します。適切なエントリーポイントを検
UZFX {SSS} スキャルピング・スマートシグナル v5.0 MT5は、変動の激しい市場において正確かつリアルタイムのシグナルを求めるスキャルパー、デイトレーダー、スイングトレーダー向けに設計された、リペイントのない高性能な取引インジケーターです。(UZFX-LABS)によって開発されたこのインジケーターは、価格行動分析、トレンド確認、スマートフィルタリングを組み合わせることで、すべての通貨ペアおよび時間枠において、高確率の売買シグナル、警告シグナル、トレンド継続の機会を生成します。 トレードの判断に迷うのはもうやめましょう。明確さ、正確さ、そして規律ある市場執行を求めるトレーダーのために設計された、体系的なシグナルシステムに従い始めましょう。 間違いなく、MQL5で入手可能な最高のインジケーターの一つです。絶対に見逃さないでください!!「スマートなトレーダーのためのスマートシグナル」 最新バージョン5.0がリリースされました。価格は予告なく最大499.99ドルまで値上がりする可能性がありますので、チャンスを逃さないようお早めにお求めください!! 購入を決める前に!無料トライアル
Smc Pro ToolKit
Talal N Z Aljarusha
5 (12)
SMC PRO TOOLKIT — SMART MONEY ANALYSIS & STRUCTURED TRADE PLANNING SMC Pro ToolKit is a professional Smart Money Concepts analysis workspace for MetaTrader 5. It combines market structure, multi-timeframe analysis, institutional price zones, setup evaluation, confirmation tools, volume context, alerts, and risk planning inside one organized chart environment. One workspace. Multiple layers of confirmation. One structured trading plan. OPEN COMPLETE USER GUIDE MULTI-CONDITION SETUP ENGINE At
Axiom Matrix — 特別オファー Axiom Matrix を 49 米ドルで購入すると、Smart Universal Expert Advisor を無料でプレゼント。 市場をスキャン。セットアップを比較。次のチャートを選ぶ。 Axiom Matrix は複数銘柄・複数時間足の分析を一つのダッシュボードに集約します。チャートを一つずつ開かずに注目する市場を探せます。 気配値表示または選択した銘柄を複数の時間足でスキャン。 トレンド、モメンタム、出来高、ボラティリティ、市場環境の質を比較。 Best Axiom Pick、シグナルの状態、クリックできるセルでセットアップを確認。 Axiom Matrix は分析用ダッシュボードです。取引は実行しません。 パッケージ内容 Axiom Matrix Smart Universal Expert Advisor PDF ユーザーガイドとオンライン講座。 設定ガイドと購入者コミュニティへのアクセス。 Smart Universal Expert Advisor は独立した特典です。本製品の直接的な自動化を約束するものではありません。
CRT Candle Range Theory HTF MT5 - Ultimate CRT Indicator: 高度なICTコンセプトとMalaysian SnRトレーディングシステム 最も先進的なCandle Range Theoryインジケーターでマーケットメーカーの足跡をマスターしましょう。Ultimate CRT Indicatorを使用して、Smart Money Concepts (SMC)の真の力を解き放ち、機関投資家のように正確にトレードします。真剣なトレーダー専用に構築されたこのインジケーターは、ICT Concepts (Inner Circle Trader)の核となる柱である、非常に効果的なCandle Range Theory (CRT)を自動化し、Malaysian Support and Resistance (SnR)エントリー手法とFVG (Imbalance)ゾーンの致命的な精度でそれを強化します。 MT5でForex、Crypto、Indicesのいずれを取引している場合でも、このアルゴリズムは市場のノイズを取り除き、ダマシ(fakeout)を
Crystal Heikin Ashi Signals - Professional Trend & Signal Detection Indicator Advanced Heikin Ashi Visualization with Intelligent Signal System for Manual & Automated Trading Final Price: $149 ---------> Price goes up $10 after every 10 sales . Limited slots available — act fast . Overview Crystal Heikin Ashi Signals is a professional-grade MetaTrader 5 indicator that combines pure Heikin Ashi candle visualization with an advanced momentum-shift detection system. Designed for both manual traders
ATSTRONG PRO:市場構造&ブレイクアウトインジケーター ブレイクアウト検出エンジン | 5つの動的TPターゲット | ライブダッシュボードパネル | リペイントなし 導入価格 現在の価格: $59 — 10回の販売ごとに価格が$10上昇します。 ATSTRONG PRO は、MetaTrader 5 用に設計された高度なブレイクアウトおよび機関投資家向け市場構造インジケーターです。 高確率のスイングピボットを検出し、クラスター化されたサポートとレジスタンスの蓄積ゾーンを特定し、 リアルタイムで構造の破壊(BOS)と性質の変化(CHoCH)のシグナルを発します。 このインジケーターは、ダイナミックなストップロスと5つの個別のテイクプロフィットレベル(TP1〜TP5)をチャート上に自動的に直接描画します。 リスクリワード予測ボックス、星付けされたシグナル品質の評価、およびリアルタイムのオンチャートパフォーマンス分析ダッシュボードを備えています。 取引に関する注意: これは手動取引および市場分析用のインジケーターです。ローソク足の確定時に明確な視覚的シグナル、レベル、アラー
Azimuth Pro
Ottaviano De Cicco
5 (7)
Azimuth Pro V2:MT5向けシンセティック・フラクタル構造分析と確認済みエントリー 概要 Azimuth Pro は Merkava Labs によるマルチレベルスイング構造インジケーターです。4つのネストされたスイングレイヤー、スイングアンカーVWAP、ABCパターン検出、3タイムフレーム構造フィルタリング、そして確定バーでの確認済みエントリー — 1つのチャートで、ミクロスイングからマクロサイクルまでを網羅するワークフロー。 これはブラインドシグナル製品ではありません。ロケーション、コンテキスト、タイミングを重視するトレーダーのための構造ファーストワークフローです。 ️ サマーセール — 夏至とThe Oracle Proの発売を記念して、Azimuth Proが30%オフ。現在279 USD(通常399 USD)。期間限定の夏季オファー。 1. V2での変更点 シンセティック・マルチタイムフレームエンジン 上位タイムフレーム分析をMeridian Proと同じ独自のシンセティックアーキテクチャで一から再構築。よりクリーンなHTFコンテキスト、安定したライブ動作、
Quantum TrendPulse を ご紹介します。これは、   SuperTrend   、   RSI   、および Stochastic のパワーを 1 つの包括的なインジケーターに組み合わせて、取引の可能性を最大限に引き出す究極の取引ツールです。精度と効率を求めるトレーダー向けに設計されたこのインジケーターは、市場のトレンド、勢いの変化、最適なエントリー ポイントとエグジット ポイントを自信を持って特定するのに役立ちます。 主な特徴: SuperTrend 統合: 現在の市場動向に簡単に追従し、収益性の波に乗ることができます。 RSI精度: 買われすぎと売られすぎのレベルを検出し、市場の反転のタイミングに最適で、SuperTrendのフィルターとして使用されます。 確率的精度: 確率的振動を活用して、変動の激しい市場で隠れたチャンスを見つけます。SuperTrend のフィルターとして使用されます。 マルチタイムフレーム分析:   M5 から H1 または H4 まで、さまざまなタイムフレームで市場を常に把握します。 カスタマイズ可能なアラート: カスタム取引条件が満たされ
Currency Strength Anchor — セッション適応型の相対的強さ指標。日足・週足・月足の始値をアンカーとして使用。非リペイント。 多くの強さメーターは、固定された過去期間で銘柄を比較します。しかし、取引日がアジアから欧州、そして米国セッションへと進むにつれ、その比較結果の意味は変化します。アジアセッションのデータで作られたランキングは、ロンドンやニューヨークが取引している時間帯にはほとんど役に立ちません。 Currency Strength Anchor は異なる基準を採用しています。各銘柄を、日足・週足・月足の3つの固定アンカーポイントに対して測定し、取引している時間帯に応じて計算範囲を自動調整します。 コンテキストは自動的に以下の間で切り替わります: アジアセッションのみ アジア+欧州セッション アジア+欧州+米国セッション 米国セッションのみ 値は確定した価格データから算出され、リペイントしません。 読み方 インジケーターは、チャート上のシンボルを構成する各コンポーネントに1本ずつラインを描画します。つまり、常に2本のラインを比較することになります。 例 1
ご紹介     Quantum Breakout PRO は 、ブレイクアウト ゾーンの取引方法を変革する画期的な MQL5 インジケーターです。 13年以上の取引経験を持つ経験豊富なトレーダーのチームによって開発されました。     クォンタム ブレイクアウト プロ   は、革新的でダイナミックなブレイクアウト ゾーン戦略により、あなたのトレーディングの旅を新たな高みに押し上げるように設計されています。 クォンタム ブレイクアウト インジケーターは、5 つの利益ターゲット ゾーンを備えたブレイクアウト ゾーン上のシグナル矢印と、ブレイクアウト ボックスに基づいたストップロスの提案を提供します。 初心者トレーダーにもプロのトレーダーにも適しています。 量子EAチャネル:       ここをクリック 重要!購入後、インストールマニュアルを受け取るためにプライベートメッセージを送ってください。 推奨事項: 時間枠: M15 通貨ペア: GBPJPY、EURJPY、USDJPY、NZDUSD、XAUUSD アカウントの種類: ECN、Raw、またはスプレッドが非常に低い R
SMART PRICE ACTION CONCEPTS — 特別オファー 構造を確認し、ゾーンを見つけ、取引プランを立てる。 MT5用Smart Price Action Conceptsを49米ドルで購入すると、Smart Universal Expert Advisorが無料で付属します。 Smart Money Concepts(SMC)、ICTスタイルの分析、プライスアクションを、見やすいチャートにまとめます。市場構造、オーダーブロック、流動性の参考水準、インバランスを確認し、Smart Panelで表示する要素を選択できます。 現在の49米ドルの価格は、今後30件の購入に適用されます。その後、価格は100米ドルになります。 パッケージの内容 • MT5用Smart Price Action Concepts。 • Smart Universal Expert Advisor — 無料特典。 • 完全版PDFユーザーマニュアルと公式オンラインコース。 • インストールと設定の手順ガイド。 • 購入者限定コミュニティへの参加とサポート。 ツール、学習教材、わかりやすい入門
作者のその他のプロダクト
VeloTicker PRO is a professional trading indicator designed to reveal hidden market pressure at key institutional price levels. At these levels, the market often experiences: - Liquidity concentration - Institutional participation - Price reactions (reversals or breakouts) The indicator displays two real-time gauges: BUY Pressure Gauge SELL Pressure Gauge Each gauge measures the strength of buying and selling activity based on tick volume flow. This allows traders to instantly iden
FREE
価格範囲計算機 私の価格を信じて、信じて、信仰! Lekimdikator LiveでYouTubeのビデオを毎日フォローしてください! Lekimdikatorは、市場に出入りするための最高の価格を計算します お気に入りのインジケーターと組み合わせて使用​​! 証券取引所、外国為替、株式、ストックオプション、外国為替、投資ファンド、不動産ファンド、またはLekimdikatorでMetaTrader 5にアクセスできる市場で取引する方法を学ぶ それは初心者または経験豊富なトレーダーのためのツールであり、誰もが自分のアカウントを保護し、取引により多くの規律を得るためにそれを使用する必要があります Kakaku han'i keisanki watashi no kakaku o shinjite, shinjite, shinkō! Lekimdikator raibu de yūchūbu no bideo o mainichi forō shite kudasai! Lekimdikator wa, ichiba ni deiri suru tame no saikō no ka
TheCubeBars - Colored Volume Indicator for MetaTrader 5 Full Description What is TheCubeBars? TheCubeBars is a revolutionary indicator that transforms volume visualization in MetaTrader 5, coloring candles according to the intensity of tick volume. Developed by Ethernal, it offers: Instant visualization of volume strength in each candle Testimonials "After I started using TheCubeBars, my breakout hit rate improved by 40%!" - Ricardo F., Professional Trader "Finally a volume indicato
TheCubeBars - Colored Volume Indicator for MetaTrader 5 Full Description What is TheCubeBars? TheCubeBars is a revolutionary indicator that transforms volume visualization in MetaTrader 5, coloring candles according to the intensity of the tick volume. Developed by Ethernal, it offers: Instant visualization of the volume strength in each candle Testimonials "After I started using TheCubeBars, my breakout success rate increased by 40%!" - Ricardo F., Professional Trader "Finally a vol
NO DLL NEEDED ! #property description "  RÁ – WHY RÁ ?" #property description "  YOU CAN START WITH LITTLE AND MAKE A LOT OF PROFIT" #property description "  ADX with thousandths filter for precise entries" #property description "  Trade only at the best times or 24 hours, you choose! " #property description "  Resets lot size when targets are reached" #property description "  Customizable settings for any trading style" #property description "  CREATED BY TOMAS LEKIM "
TheCubeTheory - Seu Indicador de Análise de Mercado em Cubos Descrição Completa  O Que é o TheCubeTheory? O   TheCubeTheory   é um indicador exclusivo para MetaTrader 5 que   mapeia os níveis de suporte e resistência   usando uma abordagem inovadora baseada em   cubos de tempo e Fibonacci . Desenvolvido pela   Ethernal , ele combina: Análise de Máximas e Mínimas   em períodos personalizáveis Níveis Automáticos   (8 níveis ajustáveis) Visualização em Tempo Real   com retângulos e linhas col
PaintPatternCandle - The Most Advanced Candlestick Pattern Indicator on the Market Detailed Description (300+ Lines) What is PaintPatternCandle? PaintPatternCandle is a revolutionary indicator for MetaTrader 5 that automatically identifies and colors 13 candlestick patterns in real time. Developed by ETHERNAL, it transforms your technical analysis into an intuitive visual process, highlighting buy and sell opportunities with vibrant colors. Unique Features 13 Recognized Patterns: E
ISIS Indicator - The Power of Moving Average Crossovers for Accurate Trading ISIS Indicator Overview ISIS is an advanced technical indicator for MetaTrader 5, designed to identify accurate buy (BUY) and sell (SELL) signals based on the crossover of two configurable moving averages. It is designed to be used in conjunction with the OSIRIS robot, but can also be applied manually by traders looking for trend-based strategies. With a smart combination of a fast moving average (Fast MA) and a sl
Osirisで市場での一貫性を確保 インテリジェントな移動平均線と高度なリスク管理に基づく高精度な自動システム! トレンドフォロー: EURUSDやGBPUSDなどの変動の激しい通貨ペアに最適 Osirisは、FX、指数、貴金属の取引向けに設計されたプロフェッショナルなエキスパートアドバイザー(EA)で、以下の機能を備えています。 サブウィンドウに2つのカスタマイズ可能な移動平均線を表示し、トレンドを正確に特定します。 Tomas LekimのCUBE THEORY価格のみで取引します。 反転ゾーン(12.5%~87.5%)をハイライトするダイナミックな水平線。 インテリジェントなリスク管理:損切り、利益確定、自動ロット調整。 変動の激しい市場に適応するためのオプションの反転モード。 ◼ ◼ ◼ 残高と利益を管理 リセット後の最低残高と 利益目標設定付き 日次、週次、月次ロット増分キー ◼ ◼ ◼ ロジック制御「損失が利益を上回った場合、反転または停止」 注文数を制御するMAXORDERSパラメータ!
H4des
Alexandro Matos
Hades EA販売のための魅力的な説明 「HADES EA」 – FXの神々のロボット! 真のFXの神のようにトレードできるように設計されたエキスパートアドバイザー、HADESで市場を制覇しましょう!インテリジェントな移動平均戦略と高度なリスク管理を組み合わせたHADESは、資金を守りながら利益を最大化するよう設計されています。 なぜHADES? 実証済みの戦略 – 正確なエントリーを可能にする1000分の1フィルターを備えた移動平均クロスオーバー 時間管理 – 最適な時間のみ、または24時間取引可能! インテリジェントなリスク管理 – 損切り、利益確定、自動ロット増分 利益リセット – 目標達成時にロットサイズをリセットし、利益を守ります 柔軟でパワフル – あらゆる取引スタイルに合わせて設定をカスタマイズ可能 「今夜はHadesでディナーだ!」 – レオニダス王 お金を眠らせないで – HADES を活用してアカウントを変革しましょう! 堅牢なバックテスト | 簡単なセットアップ | 一貫した結果
Product Name: The Cube Regressions - The Oracle of Future Trends Predict the Market with Surgical Precision - Advanced Regression Technology The indicator that projects price movements 5 minutes ahead  Full Description: Unlock the power of predictive analysis with ANHURIX PRO, a revolutionary indicator based on: Military Linear Regression - Algorithm developed for special forces in the financial market Precision Scatter Analysis - Identify turning points based on historical data Re
#property description " ANUBIS – WHY ANUBIS ?" #property description " YOU CAN START WITH LITTLE AND MAKE A LOT OF PROFIT" #property description " CCI INDICATOR FOR TRIGGERS with thousands of filters for precise entries" #property description " Trade only at the best times or 24 hours, you choose!" #property description " Resets lot size when targets are reached" #property description " Customizable ATR BASED STOPS settings for any trading style" #property description " CREATED BY
NO DLL NEEDED ! DEMIURGO — The Market Architect Demiurgo is more than an Expert Advisor — it’s a market architect, designed to build trades with precision, discipline, and adaptability. Named after the ancient concept of the Demiurge, the creator who shapes order from chaos, this EA uses layered Moving Average strategies, dynamic lot sizing, and time-based control to turn volatile price action into structured profit opportunities. Key Features Controlled Operation Hours — Activate on
AETHER – Dual Matrix Adaptive Trading System AETHER is a unique Expert Advisor that combines two independent matrices to map the market: Price Matrix: Precise division of the price into thousandths to find strategic reversal or continuation points. Time Matrix: Intelligent segmentation of the chart into time columns, adapting the strategy to the asset and timeframe in use. 100% automated trading Compatible with any asset and timeframe Integrated dashboard showing: Open positions E
EnkY
Alexandro Matos
NO DLL NEEDED ! //+------------------------------------------------------------------+ #property description "  ENKI – WHY ENKI ?" #property description "  YOU CAN START WITH LITTLE AND MAKE A LOT OF PROFIT" #property description "  SAR PARABOLIC  with thousandths filter for precise entries" #property description "  Trade only at the best times or 24 hours, you choose! " #property description "  Resets lot size when targets are reached" #property description "  Customizable setting
NO DLL NEEDED ! Centundecim Automata Negotiationis Strategia mathematica a gradibus numericis universalibus inspirata Centundecim Automata Negotiationis est Consiliarius Peritus plene automatus qui pretia in millesimis identificat et negotiationes in punctis mathematice pertinentibus in charta aperit. Proprietates principales: Inscriptiones in incitamentis numericis (L1–L6) fundatae, sine indicibus externis. Gestio voluminis automatica: magnitudinem partis ad bilancium et marginem praest
SHAMASH is a simple and efficient robot that allows the user to start with a small balance and, depending on how they use it, can turn them into a millionaire. - Balance and profit control - lot increments input double lot_size = 0.01;                                        // Lotz input double stop_loss = 900;                                        // sTOp lOSs  input double take_profit = 95;                                       // tAKe peoFIt input int order_deviation = 4;                 
VeloTicker PRO — Real-Time Flow Reading VeloTicker PRO is an advanced indicator designed for traders looking to interpret market dynamics beyond just price. With an intuitive visual interface based on dual gauges (BUY vs. SELL), it transforms market flow into clear signals, enabling faster and more precise decision-making. What It Delivers Instant reading of buying and selling pressure Clear visualization in a gauge (speedometer) format Rapid response to market changes Intelligent smoot
ADX Panel - Professional Trading Dashboard Monitor the Market in Real Time with Surgical Precision The TCT ADX Panel is a professional indicator that transforms your chart into a complete control center for your trades. With a clean design and essential information always visible, you'll never miss important market details again. WHAT YOUR DASHBOARD SHOWS Real-Time Account Status Balance, Equity, and Profit/Loss updated tick by tick Percentage drawdown with color-coded visual alert
TCT RSI PANEL - Relative Strength Dashboard IDENTIFY OVERBOUGHT AND OVERSOLD CONDITIONS WITH PRECISION The TCT RSI PANEL is a professional indicator that monitors the RSI (Relative Strength Index) and generates signals at extreme levels, combined with "thousandths" levels for precise entry points. WHAT YOUR DASHBOARD DISPLAYS ACCOUNT DATA: • Balance, Equity, Profit, and Drawdown in real-time O
TCT MACD PANEL - Momentum Dashboard CAPTURE MOMENTUM SHIFTS WITH PRECISION The TCT MACD PANEL monitors the MACD (Moving Average Convergence Divergence) and generates signals based on the crossover of the MACD line with the signal line, combined with "Milésimos" (Thousandths). WHAT YOUR PANEL DISPLAYS Account: Balance, Equity, Profit, Drawdown Positions: Buys, Sells, Total MACD: MACD Line, Sig
TCT CCI PANEL - Commodity Channel Dashboard DETECT BREAKOUTS AND REVERSALS IN THE COMMODITY CHANNEL The TCT CCI PANEL monitors the CCI (Commodity Channel Index) and generates signals within extreme zones (+100/-100), combined with "Milésimos" (thousandths) for maximum precision. WHAT YOUR DASHBOARD DISPLAYS Account: Balance, Equity, Profit, Drawdown Positions: Buys, Sells, Total CCI: Current
TCT MA PANEL - Moving Average Dashboard THE BEST WAY TO VISUALIZE PRICE VS. MOVING AVERAGE The TCT MA PANEL monitors the relationship between price and its Moving Average, generating clear trend signals. WHAT YOUR PANEL DISPLAYS Account: Balance, Equity, Profit, Drawdown Positions: Buys, Sells, Total MA: Average value, relationship to current price Milestones: Detection, Last Touched, Next
TCT SAR PANEL - Parabolic Dashboard SMART TRAILING STOP WITH VISUAL SIGNALS The TCT SAR PANEL monitors the Parabolic SAR—one of the best indicators for trailing stops and trend identification. WHAT YOUR DASHBOARD DISPLAYS Account: Balance, Equity, Profit, Drawdown Positions: Buys, Sells, Total SAR: Position of the dots relative to the price Millipips: Detection, Last Touched, Next
TCT BB PANEL - Bollinger Bands Dashboard MASTER VOLATILITY WITH BOLLINGER BANDS The TCT BB PANEL monitors Bollinger Bands, identifying volatility squeezes and price extremes. WHAT YOUR DASHBOARD DISPLAYS Account: Balance, Equity, Profit, Drawdown Positions: Buys, Sells, Total BB: Upper, Middle, and Lower Bands Milestones: Detection, Last Touched, Next
TCT COMPLETE BUNDLE - All 7 Panels COMPLETE COMBO WITH ALL INDICATORS Get all 7 TCT panels at a special price and have every trend analysis tool right at your fingertips! PACKAGE INCLUDES TCT ADX PANEL (Direction & Strength) TCT RSI PANEL (Overbought/Oversold) TCT CCI PANEL (Channels & Breakouts) TCT MACD PANEL (Momentum) TCT MA PANEL (Moving Average) TCT SAR PANEL (Parabolic Stop) TC
MULTIPLE VOTING INDICATOR - The Power of 7 Indicators in ONE Trade with Consensus, Not Guesses Stop relying on individual indicators that generate false signals. The MULTIPLE VOTING INDICATOR combines 7 professional indicators into one powerful system that generates a signal only when the MAJORITY agrees. WHAT YOU GET 1. VISUAL ARROWS ON THE CHART GREEN ARROW UP = BUY Signal (majority voted BUY) RED ARROW DOWN = SELL Signal (majority voted SELL) Appears directly on your chart, on
MATC — Cube Theory M.A An indicator that moves only when the price actually touches the structure—not on every bar or event. Description Most oscillators and moving averages recalculate at the close of each bar, tracking the passage of time. The MATC follows a different logic: it updates its value only when the price touches one of the levels of a four-layer fractal grid (Cube Theory—M1 through M4, ranging from larger to smaller scales). Between touches, the value remains static. The result i
フィルタ:
レビューなし
レビューに返信