GER40 Regime Adaptive EA
- Experts
-
Purvang Gandhi
 Purvang Gandhi | Founder, Ask Mr. GP
Fully Mechanical Trading Systems. 27+ Years in Markets. - Version: 1.0
- Activations: 5
How This System Actually Thinks About the Market
A mean reversion system built on more than price
What It Actually Watches
Instead of tracking price on its own, the system watches a single combined reading built from four things together: momentum, trend, the market's cycle position, and volatility. That combined reading - not the price chart by itself - is what tells the system it has reached an extreme worth acting on.
This matters because price and that reading don't always move together. There are stretches where price hasn't actually traveled very far, but the underlying reading has already reached its extreme. A system built on price alone would still be waiting. Ours has already started paying attention.
Inside an Extreme Zone
Once inside one of these extreme zones, the system doesn't take one trade and sit still. It watches for a burst of momentum within that zone. When momentum shows up, it buys. If momentum fades or goes nowhere, it exits. If momentum shows up again while still in that same zone, it buys again. This can repeat several times before the market finally works its way through to the other side.
Why the Win Rate Looks Low
Most of these individual attempts don't pay off - momentum flickers more often than it truly commits. But when it does commit, the move tends to be a real one, because that is exactly the kind of move this reading was designed to catch.
That's the honest reason the win rate looks low on paper: most entries in a zone are small tests, not full commitments, and only a few of them catch the actual move. It's also why losses tend to stay small and isolated, one at a time, while the wins that do land are outsized by comparison.
Many small losses. A handful of large wins.
That shape is what brings the drawdown down.
That shape is what makes running more leverage safely possible - not because any single trade is safer, but because the mix behaves differently than a single large price-only bet ever could.
Verification Materials
Strategy Tester simulation (video): Watch the simulation
Full White Paper (PDF): Read the white paper
All figures referenced in the materials above are the result of historical simulation and are not live trading results.
Quality over Quantity: "This EA uses strict filtering and is active in the market only 15% of the time to avoid bad setups. Do not expect 10 trades a day. Expect highly selective, high-probability setups."
GER40 Regime-Adaptive EA
Institutional-Grade Validation for Systematic Index Trading
Limited License Slots. Price Increases as Slots Fill.
This is not sold as an unlimited-copy retail product. Total live copies are capped, and price rises in tiers as slots are claimed. Positioned for traders operating $50,000–$100,000+ in capital who want position sizing and risk decisions backed by verifiable data.
Pricing & License Tiers
Pricing rises in fixed steps as license copies are claimed. Once a tier is sold out, it does not reopen.
| License Slot | Price (USD) | Objective / Strategy |
|---|---|---|
| Copies 1 to 3 | $1,300 | The Pilot Launch: Minimum baseline. A strong incentive for the first three elite early adopters. |
| Copies 4 to 6 | $1,600 | The Proof Step: A minor, gradual step up once the first three users confirm successful deployment. |
| Copies 7 to 9 | $1,900 | The Momentum Tier: Continued gradual step up as adoption builds and results accumulate. |
| Copies 10 to 12 | $2,200 | The Premium Target: The established base retail price prior to closing the public market phase. |
| Copies 13 to 15 | $4,400 | The Institutional Double: Price doubles immediately once copy 12 clears. |
All prices are annual licenses. No monthly or partial-term options are offered. INR figures are approximate; the USD price is binding at time of purchase.
What You Are Buying
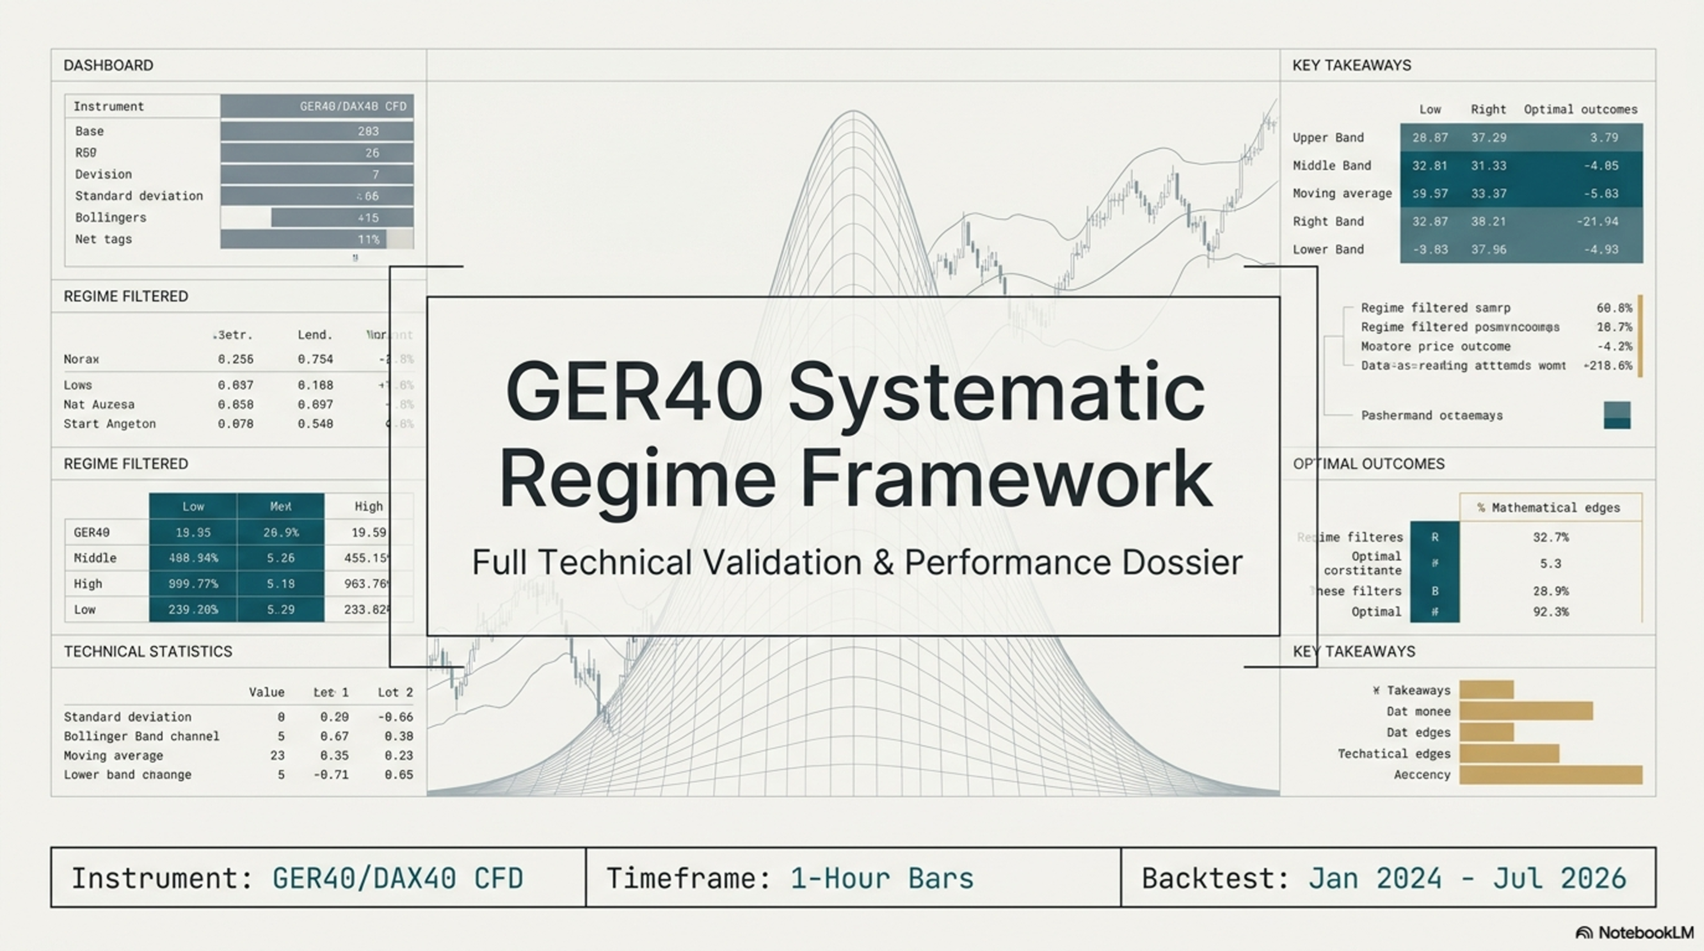
A fully automated, long-only Expert Advisor for GER40 (DAX40), H1 timeframe, built on a two-state regime-switching model. Every claim below is backed by a verified 6-month MetaTrader Strategy Tester run and a separate 18-page independent technical validation white paper covering 2.5 years of data, 10,000-simulation Monte Carlo stress tests, and a full funded-account risk simulation. Both source documents are available for review.
Strategy Tester Verified Performance
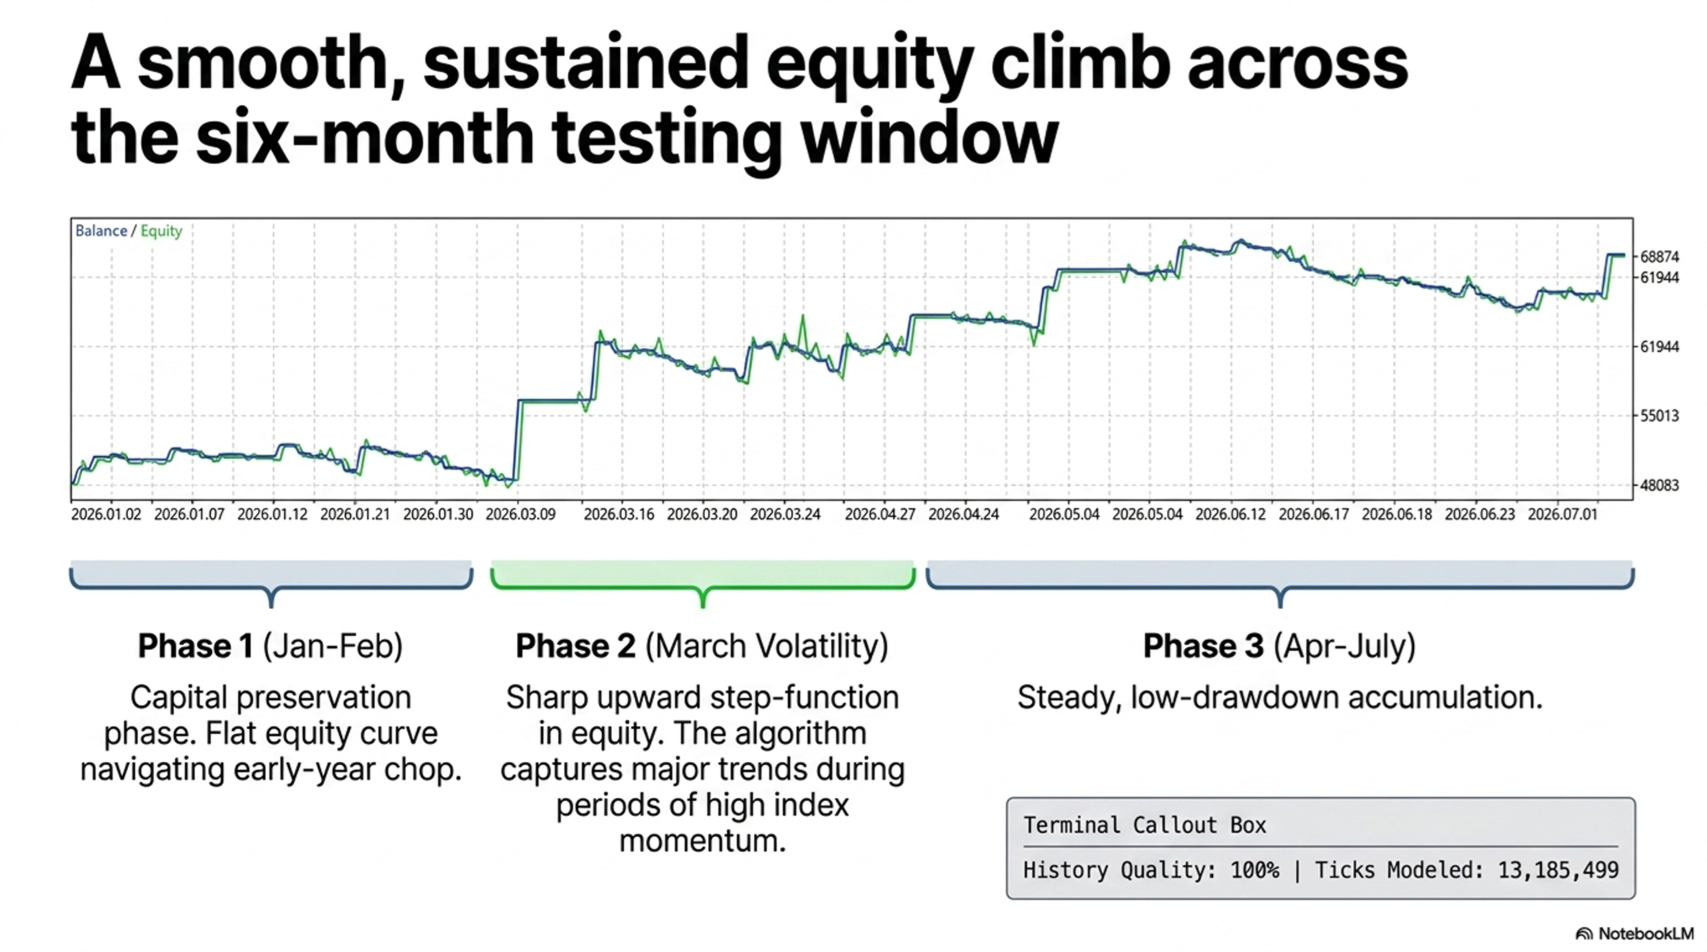
Important: The results below were generated using MetaTrader's Strategy Tester on historical price data (January – July 2026, GER40 H1, FOREX.com data, 100% history quality). These are backtest results, not live or demo account trading results in real time.
| Metric | Result |
|---|---|
| Net Profit | $19,217 on $50,000 account |
| Profit Factor | 1.48 |
| Sharpe Ratio | 3.95 |
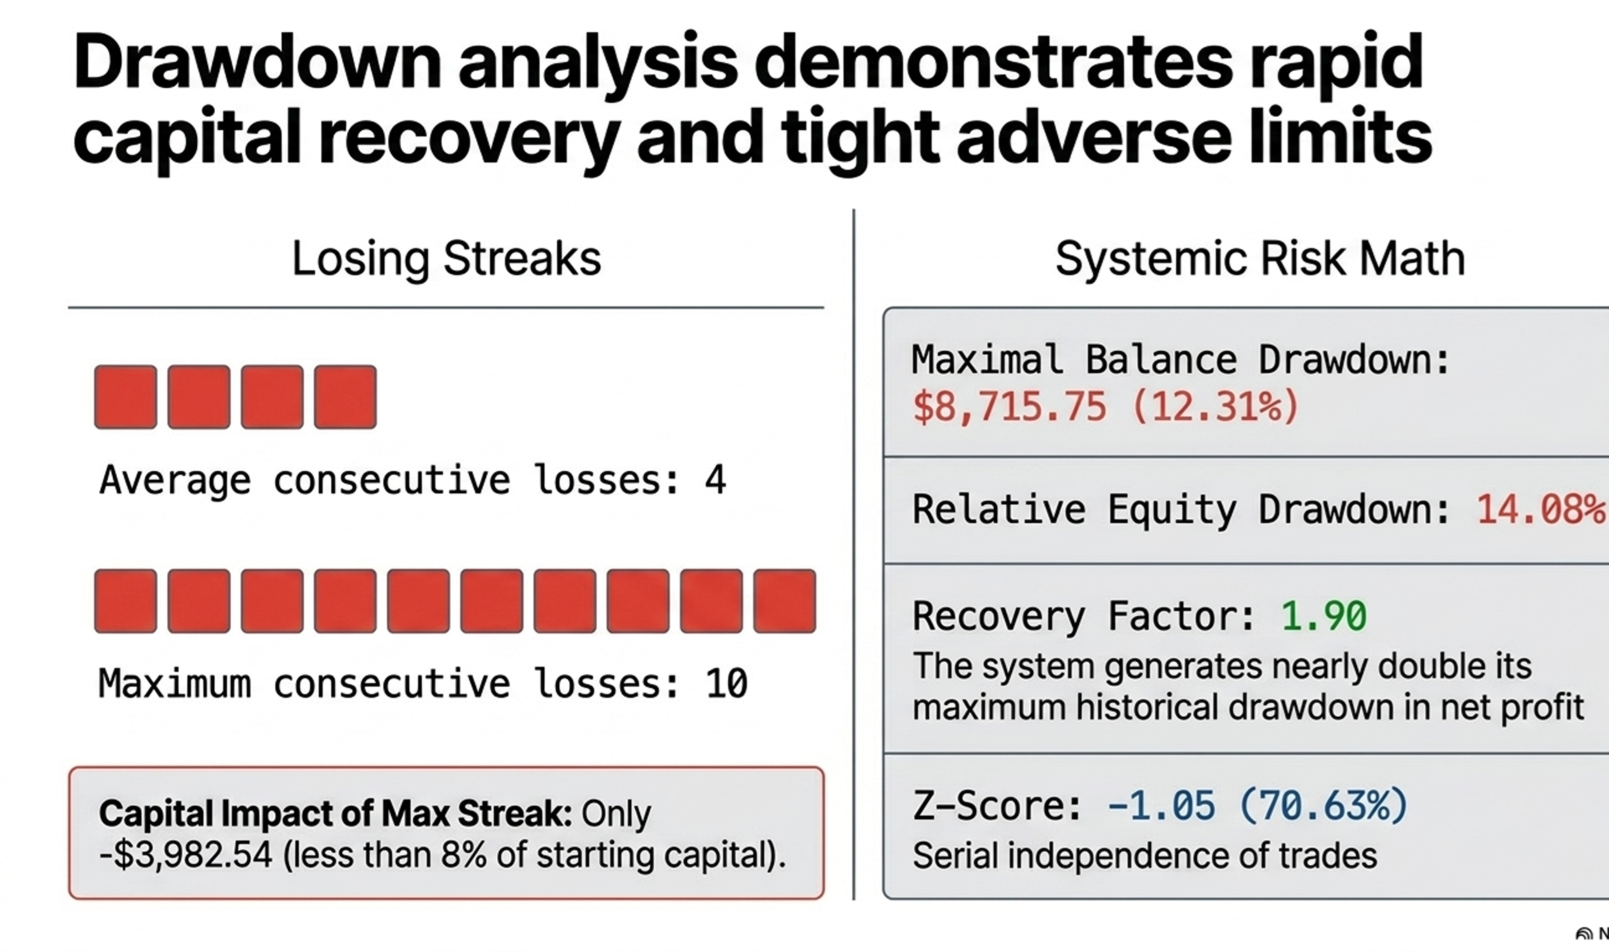
| Recovery Factor | 1.90 |
| Max Equity Drawdown | 14.05% |
| Total Trades | 121 |
| History Quality | 100% |
Addressing the Win Rate Directly
The win rate is approximately 31 to 35 percent. That is by design, not a weakness - this is a breakout/trend-capture engine, not a scalper. It absorbs many small, controlled losses while waiting for the outsized winners that carry the strategy.
| Metric | Strategy Tester (6mo) | Independent Study (2.5yr) |
|---|---|---|
| Win Rate | 30.6% | 35.5% |
| Avg Winning Trade | $1,601 | 121.8 pts |
| Avg Losing Trade | -$476 | -40.9 pts |
| Reward to Risk | 3.4 to 1 | 2.98 to 1 |
| Profit Factor | 1.48 | 1.65 |
The independent study specifically tested adding hard stop losses to fix the low win rate. Result: every hard stop level tested destroyed profitability, because winning trades average 84+ points underwater before they turn and run. The system needs room to work - that room is precisely what produces the near 3-to-1 payoff structure. This is documented in the white paper, not assumed.
Independent Validation Highlights (2.5 Years, 15,174 Bars)
- Parameter Verification - Core entry logic independently reverse-engineered from raw data, matched to 1-part-in-100-million accuracy.
- Monte Carlo Trade-Order Risk (10,000 runs) - Historical trades reshuffled 10,000 times to isolate luck-of-sequence. The regime-filtered system's real drawdown sits on the favourable side of its own distribution.
- Forward Monte Carlo (10,000 simulated years) - 81 to 86 percent probability of reaching a 10% profit target, only 2 to 5 percent probability of breaching drawdown limits.
- Transaction Cost Stress Test - At a punishing 3-point round-trip cost, net profit fell only 17% (vs. 57% for the unfiltered base version).
- Time-Segmented Consistency - Every single 6-month window across 2.5 years closed net profitable, no dead stretches.
- Funded-Account Simulation - Against a $50k account, $5,000 drawdown limit, $2,500 daily loss limit: 86.5% pass rate at 2x exposure, only 6.7% breach rate.
Infrastructure Requirements
| Requirement | Specification |
|---|---|
| Execution Latency | Must run on a VPS with latency under 15ms relative to your broker's matching server. |
| Minimum Capitalization | Recommended minimum account balance of $5,000 (or equivalent prop challenge scale) to comfortably clear intraday contract tick values. |
| Broker Selection | Use a broker offering tight, consistent GER40 spreads and reliable fill quality. A broker with wide or erratic spreads will silently erode the reward-to-risk edge documented above. Confirm your broker's typical GER40 spread and slippage during your intended trading hours before going live. |
Position Sizing - How Leverage, Account Size & Drawdown Relate
Value per Point ($) = (Account Size × Exposure Multiplier) ÷ GER40 Index Level
Worked example, GER40 at 25,700: $50,000 account × 2.0x exposure ÷ 25,700 = $3.89 per index point
| Exposure | Historical Max DD | Stress-Case Worst DD | Risk Profile |
|---|---|---|---|
| 1.0x | ~4.5% | ~10.1% | Conservative |
| 1.5x | ~6.8% | ~15.1% | Moderate |
| 2.0x | ~9.1% | ~20.2% | Standard (matches funded-account test) |
| 2.2x | ~10.0% | ~22.2% | Aggressive (tested ceiling) |
What This Means in Dollars
| Account Size | Exposure | Value/Point | Historical DD ($) | Stress-Case DD ($) |
|---|---|---|---|---|
| $50,000 | 1.5x | $2.92/pt | ~$3,400 | ~$7,570 |
| $50,000 | 2.0x | $3.89/pt | ~$4,540 | ~$10,090 |
| $75,000 | 1.5x | $4.38/pt | ~$5,100 | ~$11,350 |
| $100,000 | 1.5x | $5.84/pt | ~$6,810 | ~$15,140 |
| $100,000 | 2.0x | $7.78/pt | ~$9,080 | ~$20,180 |
Figures use GER40 ≈ 25,700 for illustration. Recalculate the formula above using the current index level and your actual account size before deploying capital.
Recommended Sizing by Risk Appetite
- Conservative (capital preservation priority): 1.0x to 1.25x exposure. Historical DD stays under ~5.5% of account.
- Moderate (balanced growth): 1.5x to 1.75x exposure. Historical DD in the 6.5 to 8.5% range.
- Standard - as independently tested: ~2.0x exposure. Matches the study's funded-account simulation, showing an 86.5% pass rate against a real $5,000 drawdown / $2,500 daily-loss mandate.
- Aggressive (maximum, not recommended beyond this): 2.2x exposure - the upper bound the independent study found still fit inside a 10% total drawdown mandate. Untested and not advised beyond this point.
Important - Prop Firm & Evaluation Accounts
Most prop firm and funded-account evaluation programs explicitly prohibit the use of third-party or purchased Expert Advisors during the evaluation phase, and many prohibit them on funded stages too. Do not run this EA on an evaluation or funded account unless you have personally confirmed with that firm's rulebook that external EAs are permitted. Running a disallowed EA on an evaluation account can result in disqualification regardless of profitability. The funded-account simulation in the validation study is a risk-mandate stress test, not a claim of compatibility with any specific prop firm's terms of service.
Disclaimer
Trading CFDs and leveraged index products carries a high level of risk and may not be suitable for all investors. All performance figures shown were generated using MetaTrader's Strategy Tester on historical data and are not live or demo account trading results, except where a specific cost scenario is explicitly stated. Past performance, whether backtested or simulated, is not a reliable indicator of future results. Monte Carlo simulations assume future trade and profit/loss distributions resemble historical ones, which cannot capture a genuine change in market conditions. Leverage magnifies both gains and losses; the drawdown figures above are illustrative estimates based on historical data and can be exceeded in live trading. This product and its accompanying documentation are for informational and educational purposes only and do not constitute financial, investment, or trading advice. You are solely responsible for your own risk management, position sizing, and compliance with your broker's or prop firm's terms of service. Verify point value, margin, and leverage conventions with your own broker before committing capital.
Full 18-page independent technical validation report and Strategy Tester statement available on request.